
Nelda J. Milburn
Civil Aerospace Medical Institute
Federal Aviation Administration
Oklahoma City, OK 73125
June 2004
Final Report
This document is available to the public
through the National Technical Information
Service, Springeld, Virginia 22161.
Ofce of Aerospace Medicine
Washington, DC 20591
DOT/FAA/AM-04/10
A Historical Review of Color
Vision Standards for Air Trafc
Control Specialists at Automated
Flight Service Stations
NOTICE
This document is disseminated under the sponsorship of
the U.S. Department of Transportation in the interest of
information exchange. The United States Government
assumes no liability for the contents thereof.

i
Technical Report Documentation Page
1. Report No. 2. Government Accession No. 3. Recipient's Catalog No.
DOT/FAA/AM-04/10
4. Title and Subtitle 5. Report Date
June 2004 A Historical Review of Color Vision Standards for Air Traffic Control
Specialists at Automated Flight Service Stations
6. Performing Organization Code
7. Author(s) 8. Performing Organization Report No.
Milburn NJ
9. Performing Organization Name and Address 10. Work Unit No. (TRAIS)
FAA Civil Aerospace Medical Institute
P.O. Box 25082
11. Contract or Grant No.
Oklahoma City, OK 73125
12. Sponsoring Agency name and Address 13. Type of Report and Period Covered
Office of Aerospace Medicine
Federal Aviation Administration
800 Independence Ave., S.W.
Washington, DC 20591
14. Sponsoring Agency Code
15. Supplemental Notes
Work was accomplished under approved task HRR-522.
16. Abstract
This report chronicles several experiments the Civil Aerospace Medical Institute has conducted to
assess the effects that advances in technology have had on automated flight service station air traffic
control specialists color identification tasks and the ensuing revisions to the color vision standard and
verification testing.
17. Key Words 18. Distribution Statement
Automated Flight Service Station, Air Traffic Control Document is available to the public through the
Specialists, Color Vision, ATC history, Color Weather National Technical Information Service
Radar, Color Vision Standards, Work-Sample Tests,
Color Vision Deficiency
Springfield, Virginia 22161
19. Security Classif. (of this report) 20. Security Classif. (of this page) 21. No. of Pages 22. Price
Unclassified Unclassified 11
Form DOT F 1700.7 (8-72) Reproduction of completed page authorized

1
A HISTORICAL REVIEW OF COLOR VISION STANDARDS FOR AIR TRAFFIC CONTROL
SPECIALISTS AT AUTOMATED FLIGHT SERVICE STATIONS
INTRODUCTION
In conjunction with the celebration of 100 years of
ight, this report provides a historical overview of the
technological innovations within the automated ight
service station (AFSS) facilities that subsequently affected
the controllers' tasks and increased the demand on their
color perception ability. Air trafc control specialists
(ATCSs) at AFSS facilities brief pilots on weather con-
ditions both before and during ights. The good news is
that the ways in which weather information is obtained,
coded, and conveyed have evolved from simply making
out-the-window observations to having immediate access
to worldwide, detailed weather information, color-coded
and displayed on high-resolution monitors. As with many
technological improvements, there are often unforeseen
consequences that may adversely affect performance. In-
deed, this was the case with the implementation of new
weather displays. After all, there was no need for a color
vision standard for early-day ATCSs who used teletyped
textual information or who later used crude, 3-level mono-
chromatic graphical depictions of the weather situation.
However, as equipment changed, so did the demand on
color discrimination ability and, consequently, the need
to verify that ability.
As a result, the FAA now requires that all applicants
for ATCS positions demonstrate their color discrimina-
tion ability because several ATC tasks involve critical,
nonredundant, color-coded information. Furthermore,
technological advancements now allow computers to
produce 16 million colors. To take advantage of this
new technology, many weather radar maps use a non-
standardized, 16-level color code to depict various levels
of reectivity. Each level is related to the increasing prob-
ability of hazardous weather and is coded in shades of
blue, green, yellow, red, purple, and white.
With the rapid proliferation of computer technology
and the concomitant ability to utilize color in displays,
it has become increasingly necessary to develop a color
vision standard. Toward these ends, the Civil Aerospace
Medical Institute has been involved in evaluating the
changing color perception tasks of pilots and controllers
for more than 30 years. The Civil Aerospace Medical
Institute has also continually substantiated the need for
a color vision standard. Furthermore, recommendations
made to the Federal Air Surgeon derived from periodic
re-evaluations of the standard necessitated revisions to the
regulation to keep pace with changing technology. This
report chronicles several experiments the Civil Aerospace
Medical Institute has conducted to assess the effects that
advances in technology have had on AFSS ATCS color-
identication tasks and the ensuing revisions to both the
color vision standard and verication testing.
HISTORICAL OVERVIEW
In the early 1920s when ight service station air traf-
c controllers rst began providing weather information
to pilots, there were no air-to-ground communications.
According to 70 Years of Flight Service, operators “made
their own weather observations and forecasts, passing
information to pilots during their ground stops” (Terrana,
1990, p. 29). Terrana (1991a, 1991b, 1992) chronicles
the creation of the ight service stations—rst known
as Air Mail Radio Stations—to the AFSSs of today. The
Weather Bureau, as it was called then, furnished textual
weather reports that were transmitted to the ight service
stations via teletype. Although only anecdotal information
is available, it is believed that most operators converted
the textual information to national, regional, or local
hand-drawn maps fairly early. The maps used a color-
coding system that depicted the various levels of weather
intensities to better conceptualize weather patterns.
However, in the mid-1960s access to radar imagery
became available. Using a monochromatic (one color)
coding scheme, weather could be portrayed in shades of
gray representing 3 levels of intensity. By the early 1980s,
“color radar imagery could be accessed from National
Weather Service radars (WSR-57 and WSR-74) and the
Federal Aviation Administration (FAA) radars situated
across the country” (WSI Corp., 2001). Six intensity
levels displayed in color replaced the gray-coding scheme.
The new digitized weather product was called the Radar
Remote Weather Display System (RRWDS) and boasted
the “most advanced state-of-the-art color weather radar
display ever produced” with a “high resolution, non-
interlace 60Hz raster scan of 512 x 512 pixels” (Talley
Industries, undated product brochure, p.2). Not only
could weather level colors be individually selected for
viewing or masked (hidden), but users could select only
the most intense weather levels to be shown, thus declut-
tering the display and emphasizing the most trouble-

2
3
some areas. Furthermore, specic colors could be set to
blink, thus alerting the operator to the presence of that
particular level.
At least three RRWDS design aspects added a level
of redundancy to interpreting the color-coding. Features
such as zoom, level select, and blinking enhanced color
perception by increasing size or otherwise isolating specic
coding and thereby protecting the performance of control-
lers with normal color vision over the range of viewing
distances and consequent image size variation. Equally
important, the redundant design features protected the
performance of controllers with color vision defects.
The weather intensity was depicted in 3 colors (green,
yellow, and red), 2 intensities each, representing levels 1
through 6 (light, moderate, heavy, very heavy, intense,
and extreme) as dened by the National Weather Service
and the National Bureau of Standards. The system pro-
vided meteorologists at Air Route Trafc Control centers
with detailed information on the location and severity of
weather conditions nationwide by allowing the operator
to dial-up any of several dedicated radar sites by entering
its telephone number into a computer keypad.
During the 1980s, ATCSs experienced several techno-
logical changes made at ight service stations that revolu-
tionized their tasks, including the invention of a monitor
that allowed controllers to exchange their colored pencils
for a color display of weather maps. Perhaps a carryover of
the colors used in the paper-and-colored-pencils phase (or
more likely the limitations of the display) and/or perhaps
some remote connection to the cultural connotations at-
tached to colors (such as green—go, yellow—caution, and
red—danger) dictated the colors designated to represent
each weather level. Regardless of the origin of the color-
coding, by the mid-1980s color weather radar was being
used to display weather information (see Figure 1).
One of the rst color codes in use illustrated bodies
of water with the color blue and used two shades each of
green, yellow, and red to represent 6 weather intensities
on a black background. Basically, 16 colors were possible
on the CGA (color graphics adapter) monitors with the
red, green, and blue color guns. The 16 colors were hard-
wired into CGA displays and consisted of full-intensity
(light) and half-intensity (dark) versions of the primary
colors and their combinations, plus white, black, and
two shades of gray.
Additional technological changes allowed comput-
ers to produce 256 colors and, eventually, 16.7 million
colors. Simultaneously, the resolution on the displays
improved from 400 x 200 to 1280 x 1024 pixels. The
improved resolution allowed weather maps to be presented
in greater detail that more closely represented weather
patterns. By the mid-1990s, color weather radar product
suppliers expanded from 7- to 16-levels to represent a
ner gradation of weather intensities (Table 1). A new
program from the National Weather Service, called Next
Generation Weather Radar (NEXRAD), was established
with the goal of replacing the 128 aging WSR-57/74
radars in ight service stations across the country. The
NEXRAD radars, called WSR-88D, were a new Doppler-
type that allowed the user to see motion in atmospheric
conditions. This enabled the user to view cold fronts,
dry lines, and thunderstorm gust fronts as never before
possible. A major advantage of NEXRAD was to provide
early warning in cases of potentially severe weather. These
technological advances and product improvements not
only changed the job tasks, but also, presumably, the
level of color vision ability required in air trafc control
personnel. Because the older system, the RRWDS, had
redundant cues available in addition to color that the
new systems did not, the new systems required the user
to rely more heavily on the color-coded information for
interpretation. For those reasons, conrmation of one’s
ability to interpret the color-coded information became
necessary, thus leading to a color vision standard and,
subsequently, the need for a color weather radar work-
sample test.
Color Vision Standards for All Controllers
Applicants for Federal Aviation Administration ATCS
jobs in en route centers, terminal towers, and ight service
stations were required to demonstrate their color vision
discrimination ability as early as 1978, when Medical
Guideline Letter Number B-5A-0002 was written. It
required normal color vision for all ATCSs because a
number of ATCS tasks involved critical, nonredundant,
color-coded information. The following are ATCS tasks
involving color-coded information identied by job analy-
sis in the mid-1980s and used in subsequent research
Figure 1. Radar Remote Weather Display System
(RRWDS)

2
3
(Adams & Tague, 1985; Lahey, Veres, Kuyk, Clark, &
Smith, 1984; Lahey, Veres, Kuyk, & Clark 1984; Mertens,
1990; Mertens, Milburn, & Collins, 1995, 1996, 2000;
Pickrel & Convey, 1983):
1. Reading of red and black printing and also red and black
(or blue) handwriting on ight progress strips used by
ATCSs at en route facilities.
2. Scanning of color weather radar displays at en route centers
and AFSS facilities. Blue, green, yellow, red, purple and
white indicate different weather levels.
3. Identifying an aircraft’s direction at night by tower con-
trollers both while it is in the air and on the ground.
Identication is based on red, green, and white navigation
lights.
4. Identifying the color of the Aviation Signal Light indicator
that gives a tower ATCS visual feedback concerning the
signal light color (red, green, or white) that is used to direct
an aircraft or ground vehicle when radio communication
fails or is not available.
5. Identifying aircraft by the color of aircraft or its markings
from within air trafc control towers in the daytime.
6. Reading a variety of color-coded charts at all types of
facilities.
7. Selecting the appropriate colored indicator lights, keys,
switches, and buttons at all types of facilities.
Not all of the above listed tasks are relevant to AFSS
ATCSs. Furthermore, some of the tasks involve redun-
dantly color-coded materials that would allow a person
with color vision deciencies to operate or interpret the
meaning of the color-coding based on the availability of
the redundancy. The built-in redundancies guard against
misinterpretation of the simple color-coding. Tasks 5,
6, and 7 listed above have some built-in redundancy;
and therefore, color-coding has a secondary importance.
However, tasks 1 through 4 rely heavily or entirely upon
color-coding to convey meaning to the user for interpreta-
tion. The primary color-related tasks include interpreting
color coding on ight progress strips, aircraft naviga-
tion lights, and color weather radar images on a cathode
ray tube (CRT). Most relevant to ight service is color
weather radar.
Given the number of critical tasks that require ATCSs
to decipher the meaning of the color-coded material, it is
not surprising that “normal color vision” was a pre-employ-
ment job requirement. In this context, normal color vision
refers to the way approximately 95+% of the population
sees colors. Estimates vary, but about 8 to 10% of all males
and about one-half of 1% of females see colors differently
than the majority of people (Wyszechi & Stiles, 1982).
Because a very high percentage of the population match
Table 1
Comparison of 7-Level WSR-57 to the 16-Level WSR-88D Weather Intensities
a
Precipitation Intensity Levels
Refectivity
Level
b
WSR-57 WSR-88D
Approximate
Rainfall Rate
5-10 Level 1 Drizzle
d
10-15
Level 2 Light snow
d
15-20
Level 3 Light snow
d
20-25
c
Level 1 Light Level 4 Light .02”/hour
25-30 Level 1 Light
Level 5 Light .02”/hour
30-35 Level 2 Moderate
Level 6 Moderate .09”/hour
35-40 Level 2 Moderate
Level 7 Moderate .09”/hour
40-45 Level 3 Heavy
Level 8 Heavy .48”/hour
45-50 Level 4 Very Heavy
Level 9 Very Heavy 2.5”/hour
50-55 Level 5 Intense
Level 10 Intense 5.7”/hour
55-60 Level 5 Intense
Level 11 Intense 5.7”/hour
60-65 Level 6 Extreme/Hail
Level 12 Extreme/Hail 12.9”/hour
65-70 Level 6 Extreme/Hail
Level 13 Extreme/Hail 12.9”/hour
70-75 Level 6 Extreme/Hail
Level 14 Extreme/Hail 12.9”/hour
>75 Level 6 Extreme/Hail
Level 15 Extreme/Hail 12.9”/hour
a
original source of tabled information unknown
b
measured in dBZ
c
18-25 dBZ for WSR-57
d
precipitation may not be hitting ground
4
5
colors in a similar way, they are said to have normal color
vision. In contrast, those persons who see colors differ-
ently are labeled as color vision decient. The incidence
of color vision deciency occurs across ethnic groups with
the prevalence varying but with Caucasian males showing
the largest ratio of red-green color vision decients (Hunt,
1998; Pokorny, Smith, Verriest, & Pinckers, 1979). The
initial, normal color vision pre-employment job require-
ment remained in effect until the Equal Employment
Opportunity Commission regulation (29 C.F.R. Section
1613.705a) was written. It stated that an agency could
not make use of any employment test that screens out
qualied handicapped persons unless it is shown to be
job-related for the position in question. Consequently,
the rst step was to substantiate the need for a color vi-
sion requirement. Justication for the screening test was
based on its job-relevance, especially the non-redundant
nature of color-coding in some ATCS tasks. However,
making the connection between color vision screening
test results and performance involving on-the-job tasks
was harder to establish when the screening test was not
composed of actual ATCS materials and/or tasks. At that
time, the determination of normal color vision and one’s
capability of performing the color-related tasks was based
on passing a pseudoisochromatic plate (PIP) test.
Need for Work-Sample Color Vision Tests
A court decision in 1980 determined that PIP tests were
medical tests designed to measure genetically determined
variations of color vision among individuals. Notably,
the PIP tests do not predict the potential satisfactory
performance of air trafc control duties related to color
vision. This is an important point because the require-
ment that the applicant must have normal color vision
should be interpreted to mean that the individual must
be able to function normally in recognizing colors in the
work environment. Consequently, the court found that
ATCS applicants who did not pass the PIP tests should
be given the opportunity to demonstrate their ability to
recognize colors using work-sample materials.
In 1981, the Ofce of Personnel Management un-
dertook an “examination of ATCS job requirements
for color vision, asking nearly thirty ATCSs to list tasks
that might require them to be able to distinguish and/or
name colors” (Pickrel & Convey, 1983, pp. 4-5). From
that list, “simulations of ATC tasks were created in three
content areas: 1) aircraft colors for fuselage and lights, 2)
color weather radar displays, and 3) navigational chart
terrain elevations” (ibid., p. 5). The sub-tests consisted of
color-identications on ATCS task simulations and were
assembled in a loose-leaf notebook requiring a paper-
and-pencil answer sheet. The speeded test was called the
Air Trafc Controllers Functional Color Perception Test
(ATC-FCPT, Pickrel & Convey, 1983; Convey, 1985).
Later, the ATC-FCPT was combined with the Dvorine
Pseudo-Isochromatic Plates test and the Farnsworth D-
15 test. Both of the latter tests used special disposition
criteria, fully described in Mertens (1990). The resulting
“Three-Test Battery” was then recommended by the FAA’s
Ofce of Aviation Medicine to test ATCS applicants who
had failed their initial aeromedical color vision test. The
scoring criteria for the Dvorine PIP (failure with 5 or
more errors) and the special scoring procedure for the
D-15 were based on recommendations of Lahey, Veres,
Kuyk, Clark, and Smith (1984), who provided an in-
depth “Job Analysis and Determination of Color Vision
Requirements for Air Trafc Control Specialists” for the
Ofce of Personnel Management.
In December 1985, the FAA’s Medical Guideline
Letter Number B-5a-0061 established a procedure for
“Testing of ATCS Applicants Appealing Disqualication
for Color Perception Deciency.” To be considered for
employment as an ATCS, an applicant had to pass 2 of
the 3 tests constituting the battery. That pass criterion
was based on reports by Lahey, Kuyk, Veres, and Clark,
(1984); Lahey, Veres, Kuyk, Clark, and Smith (1984);
Pickrel and Convey (1983); and Convey (1985).
Re-Evaluation of the Work-Sample Test
Several years later, the Three-Test Battery was included
in a study designed to determine the relationship between
errors in performance of simulated ATCS color tasks
and color vision deciency “in order to evaluate the
level of color vision ability required in ATCS person-
nel” (Mertens, 1990, p. 2). The Mertens study included
all aeromedical color vision screening tests in use (in
1988) “by Aviation Medical Examiners (AMEs) for the
initial medical examinations of ATCSs and pilots” (p.
4). The experiment included 9 PIP tests, 3 lantern tests,
and 4 vision testers--all listed in the then current FAA
Aviation Medical Examiner’s Guide (1980). The study
compared pass/fail performance on each of the FAA-ac-
cepted tests, the Three-Test Battery as a whole, and each
of its component tests separately, to 4 simulated ATCS
color-identication tasks: Flight Progress Strips, Color
Weather Radar, Aircraft Lights, and Aviation Signal
Lights. That study also used actual ight progress strips
obtained from an en route center to serve as a criterion
(work-sample) test to examine the predictive validity of
the Three-Test Battery and other FAA-accepted tests. The
study made a substantial contribution by analyzing per-
formance on simulated ATCS tasks as a function of type
and degree of color vision deciency. Most importantly,
ndings from the study negated previous opinions about
individual test performance and the predictive quality of
each test—especially the Three-Test Battery. Although
4
5
performance on the ATC-FCPT was poor, it was most
likely because it was a cognitively difcult, timed test
that was not strictly a color-perception test.
Based on results from Mertens’ (1990) original study
and a later replication study (Mertens & Milburn, 1992a),
a new directive from the Federal Air Surgeon was writ-
ten instructing regional ight surgeons to administer the
Dvorine PIP, rather than the Three-Test Battery, to all
individuals seeking initial employment with the FAA as
ATCSs. In addition, the Medical Guideline letter de-
scribed the course of action to be taken in the event an
applicant failed the Dvorine PIP. Specically, it stated that
the applicant would be “notied of their opportunity to
be re-evaluated” (MGLRM, 1995, MGL-87, p. 3).
The guidance stated that applicants who desired re-
evaluation would be presented a repeat administration
of the Dvorine PIP under standardized conditions. If no
more than 2 errors were made, the person was passed
and no further testing was required. The applicant thus
qualied for all ATCS options. Otherwise, if the applicant
failed the Dvorine PIP, the practical test that applied to a
specic work option had to be passed for the applicant to
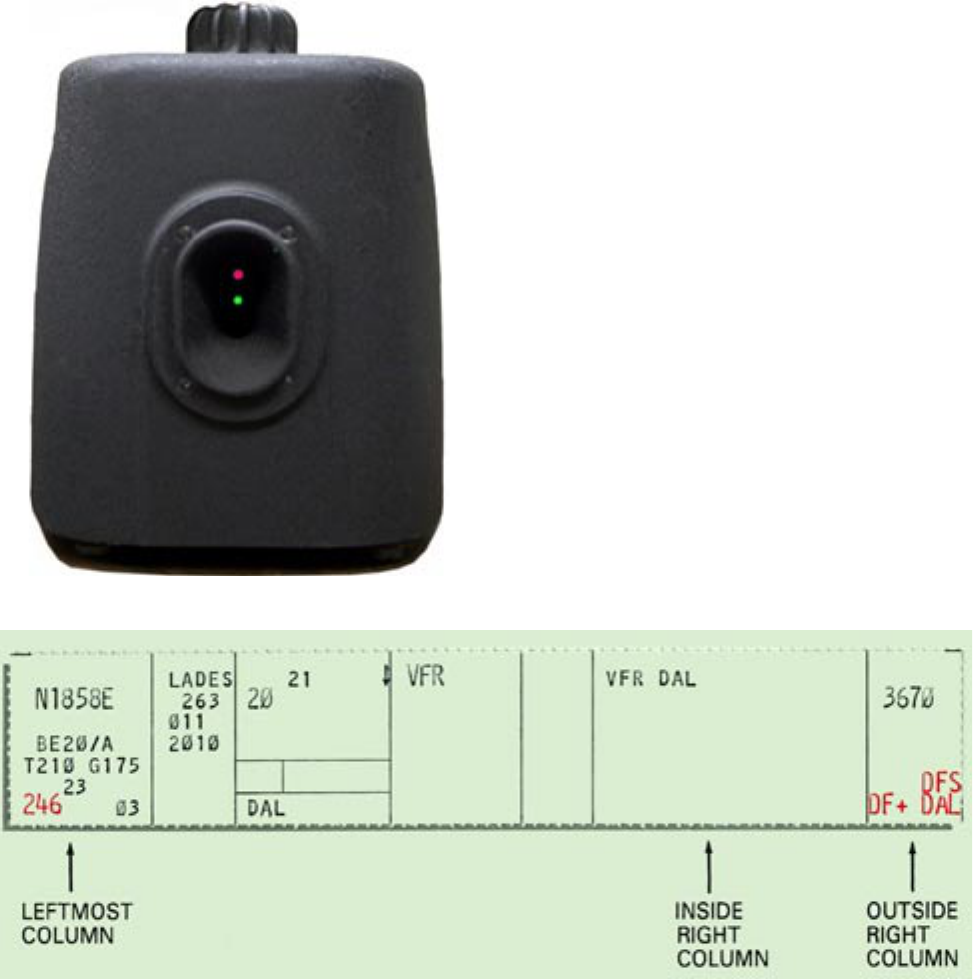
be considered for that work option. The Aviation Lights
Test (Figure 2) is the work-sample test for ATCSs wish-
ing to work in the terminal option. The Flight Progress
Strips Test (Figure 3) applies to the en route (or center)
option and is composed of several ight progress strips
lithographed onto the same green ledger paper used in
the eld. The notable difference is that in the Aviation
Lights Test, the applicant identies red, green, and white
lights that meet the FAA (1988) and ICAO (1988) stan-
dards; whereas the Flight Progress Strips Test requires the
identication of red and black printing.
Need for a Work-Sample Test for AFSS
At the time MGL-87 was issued, only the practical
tests for the en route (center) and terminal options had
been developed. Consequently, MGL-87 stated that an
alternative color perception test for the ight service sta-
tion option was under development at the Civil Aerospace
Medical Institute. “Until another test is adopted, appli-
cants for the ight service station option must success-
fully pass the Dvorine pseudoisochromatic plate test by
making no more than two (2) errors under standardized
conditions” (MGLRM, 1995, MGL-87, p. 3).
By 1993, in compliance with the above-mentioned direc-
tives from the Ofce of Personnel Management, the Equal
Employment Opportunity Commission, and the Federal
Air Surgeon, two practical (job-sample) tests had been
Figure 2. Aviation Lights Test
Figure 3. Flight Progress Strips Test
6
7
developed to allow ATCS applicants who failed their ini-
tial color vision screening the opportunity to demonstrate
their color-vision abilities using simulated ATCS materials.
Specically, the color-related tasks described in Task 1 above
were carefully reproduced in the Flight Progress Strips
Test; and, similarly, Tasks 3 and 4 were simulated in the
Aviation Lights Test (Mertens, 1990; Mertens & Milburn,
1992a; Mertens, Milburn, & Collins, 1996, 2000). Because
Tasks 5, 6, and 7 have some inherent redundant coding
available to the ATCSs to aid interpretation, only the task
related to deciphering the color coding on a weather radar
CRT had not been accomplished. Accordingly, Task 2 was
addressed in an initial laboratory depiction of the AFSS
color weather radar display that involved two concentric
squares with the inner square representing the target color
and the outer square representing various background or
surround colors (Mertens, 1990). In that experiment, two
target sizes were evaluated (0.1 and 0.5 degrees), but only
1 color palette measured at the McAlester, OK, AFSS
containing 7 color-coded weather levels was duplicated
in the laboratory. The participant’s task was to identify
the color of the inner square by color name and intensity
such as light or dark--green, yellow, or red. All colors and
intensities served as target and surround colors, and all
combinations were presented. The targets were presented
on 2-in squares on a black CRT screen. The small target
size was used because discussions with AFSS ATCSs and
meteorologists working at FAA facilities indicated that
being able to identify the color of very small areas on a
color weather radar display is important. In the labora-
tory, 7 of 31 participants with normal color vision made
at least 1 color identication error on the 0.1-degree target
(Mertens, 1990). However, the current weather displays
used by ATCSs allow the user to “zoom” the weather image
at any location on the display and thus enlarge the target
to several times its original size. In defense of the small
target size, the user must recognize a potentially hazardous
area as such, to know to enlarge that area, leading to the
conclusion that recognition of a small color-coded area is
a prerequisite to prompt enlargement of the area.
Since that experiment, technological changes have
allowed weather image providers to market improved
products to AFSSs and, in turn, the technological ad-
vances have changed the demands on the user’s color
perception. One such product change occurred when
weather image providers expanded the color coding from
7 levels to 16 in the NEXRAD system. Not only were new
colors added to the original coding scheme, (e.g., blue,
purple, and white), but several intensities of each color
were possible. Although some composite radar displays
using 7 levels are still in use, the 16-level weather product
has gained wide acceptance because it more precisely
depicts the weather situation. The National Weather
Service generates weather information and/or radar im-
ages. From that information, a few companies produce
color-graphic weather images that the FAA purchases.
Each company is free to develop its own color palette
for coding the weather levels. Additionally, some AFSSs
locally produce some types of weather images that are
unique to that particular facility.
Challenges and Design Issues of a CRT-Based Color
Vision Test
One can quickly understand that creating a computer-
ized color vision test that will re-create the AFSS ATCS’s
color discrimination tasks (relevant to Task 2) will pres-
ent several challenges including accurately duplicating,
on laboratory equipment, the colors that were measured
at various AFSS eld facilities. An initial survey revealed
that each eld facility uses a variety of brands and sizes of
monitors. Because each CRT monitor has several adjust-
ments available to the user such as brightness and contrast
that act in conjunction with the individual limitations and
capabilities of the monitor, color appearance differences
exist between monitors. (This is similar to the differences
apparent between television sets in a department store
showroom.) Therefore, it is necessary to evaluate the effect
on color perception as measured by test performance as a
result of using different monitor brands, ages, sizes, and
adjustments (with a specically designated color card).
The second challenge will be producing a test with
a clear, understandable task that captures the essence of
the ATCS color-identication task that can be performed
by applicants who have not received any ATCS training.
The test has to be strictly a color vision test.
The third challenge of creating a computerized color
vision test will be assuring that the colors used in the
laboratory for test development and validation can be
accurately reproduced on the CRTs at eld testing sites.
The CRTs must be calibrated on site just before testing
with small tolerances specied for the chromaticities
used in the test.
An important design issue will be selecting an appro-
priate target size for test trials of the color weather radar
test. Previous work on the topic of target size revealed
“the occurrence of some errors in normal trichromats…
under adverse observation conditions in the ight strips
and radar tasks…for identication of small targets on
the order of 0.1 deg in size on radar displays” (Mertens,
1990, p. 8).
The next steps will involve selecting sets of color pal-
ettes for examination, creating an initial set of test trials,
ensuring content validity, developing a scoring strategy,
and establishing a pass/fail criterion. The nal step will
involve comparing performance on the Color Weather Ra-
dar Test to the Dvorine PIP as a function of anomaloscope

6
7
diagnoses with its purpose being to identify individuals
who fail the initial color vision screening test and who
perform similarly to people with normal color vision on
the work-sample test. Previous studies (Mertens, 1990;
Mertens & Milburn, 1992a, 1992b; Mertens, Milburn,
& Collins, 1998) reported high predictive validity values
for the Dvorine PIP test (all reporting Kappas near .90)
for simulated ATCS color-identication tasks. As with the
practical color vision tests for the en route and terminal
options, a few people were able to perform the work-sample
tasks but were unable to pass the Dvorine PIP screening
test. Mertens (1990) reported false-positive rates ranging
between 7.1% and 35.8% for the Dvorine PIP test for
prediction of performance on the 7-level color weather
radar tests using small and large targets, respectively.
CONCLUSIONS
This paper has provided a historical review of the
technological changes that have affected the color-
identication tasks of the AFSS ATCSs and the subsequent
changes to the color vision standards and testing materials.
Furthermore, the paper introduces the challenges relevant
to the development of a work-sample color vision test
intended to allow AFSS ATCS applicants the opportunity
to demonstrate their color vision ability while performing
CRT-related color weather radar tasks. Specically, the
challenges and initial decisions include selection of an
appropriate target size, size of monitors, brand of moni-
tors, characteristics of the color palettes, number of colors
used, and the presence or absence of a color legend.
Future Issues
Although the initial goal of using color on displays
was to declutter, speed, and simplify the interpretation
of textual information, now the number of codes possible
are almost limitless by combining 16.7 million colors
with many other display techniques (e.g., reverse video,
ashing, brightness contrast, text size, and font). This
is important because it has the potential to complicate
the use of color displays by providing an overwhelming
amount of information. So now, not only is color percep-
tion a vital issue but also the overall complexity of the
color-coded display.
As additional uses of color are introduced by new
advanced technologies entering the ATC terminal, au-
tomated ight service, and en route environments, clini-
cal evaluations of the resulting changes to those ATCSs’
knowledge, skills, and abilities must be conducted. Ul-
timately, as long as technology continues to change the
controller’s color identication job tasks, the work-sample
testing materials used to verify the applicant’s ability must
also be dynamic to keep pace.
REFERENCES
Adams AJ, Tague MK. Performance of air trafc control
tasks by protanopic color defectives. Am J Optom
Physiol Opt. 1985;62:744-50.
Convey JJ. Passing scores for the FAA ATCS color
vision test. Washington, DC: Department of
Transportation/Federal Aviation Administration;
1985;FAA report no. FAA/AM-85/4.
1
Federal Aviation Administration (1988). Federal Aviation Regu-
lations Part 23, Section 23.1397, Washington DC.
Federal Aviation Administration. (1980, 1985, 1996, &
1999). Guide for Aviation Medical Examiners Wash-
ington, DC: FAA Ofce of Aviation Medicine.
1
Hunt RWG. Measuring Colour, (3
rd
ed.). England: Foun-
tain Press; 1998.
International Civil Aviation Organization. Technical
Airworthiness Manual. (2
nd
ed.-1987 Document
9051-AN/896), Amendment 10. 1000 Sherbrooke
Street West, Suite 400, Montreal, Quebec, Canada,
1988.
Lahey MA, Veres III JG, Kuyk TK, Clark DJ. The impact
of color weather radar equipment on the job of air
trafc control specialists – ight service station op-
tion. Report submitted under Contract OPM-50-
83 with the U.S. Ofce of Personnel Management.
Montgomery, AL: Auburn University Press 1984.
Lahey MA, Veres III JG, Kuyk TK, Clark DJ, Smith EN.
Job analysis and determination of color vision re-
quirements for air trafc control specialists. Report
submitted under Contract OPM-50-83 with the
U.S. Ofce of Personnel Management. Montgom-
ery, AL, Auburn University Press 1984.
Medical Guideline Letters Reference Manual, MGLRM
(January, 1995). DOT/FAA, Washington, DC:
Federal Aviation Administration, Ofce of Avia-
tion Medicine.
Mertens HW. Evaluation of functional color vision
requirements and current color vision screening
test for air trafc control specialists. Washington,
DC: Department of Transportation/Federal Avia-
tion Administration; 1990;FAA report no. DOT/
FAA/AM-90/9.
1
1
This publication and all Ofce of Aerospace Medicine technical
reports are available in full-text from the Civil Aerospace Medical
Institute’s publications Web site: http://www.cami.jccbi.gov/aam-
400A/index.html
8
Mertens HW, Milburn NJ. Performance of color-depen-
dent tasks of air trafc control specialists as a func-
tion of type and degree of color vision deciency.
Washington, DC: Department of Transportation/
Federal Aviation Administration; 1992a;FAA report
no. DOT/FAA/AM-92/28.
1
Mertens HW, Milburn NJ. Validity of clinical color vision
tests for air trafc control specialists. Washington,
DC: Department of Transportation/Federal Avia-
tion Administration; 1992b;FAA report no. DOT/
FAA/AM-92/29.
1
Mertens HW, Milburn NJ, Collins WE. Practical color
vision tests for air trafc control applicants: En
route center and terminal facilities. Washington,
DC: Department of Transportation/Federal Avia-
tion Administration; 1995;FAA report no. DOT/
FAA/AM-95/13.
1
Mertens HW, Milburn NJ, Collins WE. A further valida-
tion of the practical color vision test for en route
air trafc control applicants. Washington, DC:
Department of Transportation/Federal Aviation
Administration; 1996;FAA report no. DOT/
FAA/AM-96/22.
1
Mertens HW, Milburn NJ. Validity of clinical color vi-
sion tests for air trafc control. Aviat Space Environ
Med 1998; 69:666-74.
Mertens HW, Milburn NJ, Collins WE. Practical color
vision tests for air trafc control applicants: En route
center and terminal facilities. Aviat Space Environ
Med 2000; 71:1210-17.
Pickrel EW, Convey JJ. Color perception and ATC job
performance. Washington, DC: Department of
Transportation/Federal Aviation Administration;
1983;FAA report no. DOT/FAA/AM-83/11.
1
Pokorny J, Smith VC, Verriest G, Pinckers AJLG. Con-
genital and acquired color vision defects. New York:
Grune & Stratton. 1979.
Terrana J. 70 years of ight service. J Air Trafc Control
1990; Jul-Sep:28-9.
Terrana J. 70 years of ight service. J Air Trafc Control
1991a; Jan-Mar:45-9.
Terrana J. 70 years of ight service. J Air Trafc Control
1991b; Oct-Dec:49-54.
Terrana J. 70 years of ight service. J Air Trafc Control
1992; Jan-Mar:19-20.
Weather Services International Corporation (WSI).
Retrieved September 3, 2001, from: http://
www.wsicorp.com
Wyszechi G, Stiles WS. Color Science (2
nd
ed.). New York:
Wiley. 1982.
