
© www.bluewatermiles.com 1
www.bluewatermiles.com
LOGBOOK
FOR CRUISING UNDER SAILS
Boat Name .................................................................................................................
Onwer’s Name ...........................................................................................................
Onwer’s Phone ..........................................................................................................
Port of Registry ..........................................................................................................
Flag ............................................................................................................................
Type (M/Y, S/Y, other) ...............................................................................................
Year Built: ..................................................................................................................
Sea areas in which the boat is authorised to operate ...............................................
Call Sign ................................ Official Number ...............................
MMSI .....................................
Starting Date ................................. End Date .................................

© www.bluewatermiles.com 2
Boat Details
Length Over All ............................. m Length Water Line .................................... m
Draught ......................................... m Beam ........................................................ m
Masthead Height ........................... m Gross Tonnage (GT) .................................. t
Fuel Tank Capacity ........................ L Spare Fuel Capacity .................................. L
Engine Type ................................... HP Engine Oil ..........................................
Fuel Consumption ................. L per Hour at RPM .................
Range on engine ................... NM
Water Tank Capacity ................. L
Domestic Battery Capacity ................. Ah Engine Battery Capacity ................ Ah
Electricity Consumption (avg) ................. Ah
Electricity Generation:
☐ Engine .................. h run to top up batteries
☐ Solar panels .................. Ah / day (avg)
☐ Wind generator .................. Ah / day (avg)
☐ ........................ .................. Ah / day (avg)
Main Anchor ................. Kgs .......................... m
& chain / cable length
Kedge Anchor ................. Kgs ........................ m
& chain / cable length
Sails
No.
Name
Sail Area m
2
Sign
Remarks
1
2
3
4
5
6
7
8
9

© www.bluewatermiles.com 3
Instructions
A well-kept ship’s logbook should serve as an
accurate narrative, permitting anyone to
subsequently plot the cruise again from the
information supplied.
"The entries in the ship’s log can be
followed in reverse over the course run, rather
in the way that Theseus found his way out of
the labyrinth. All the details used in laying the
course must be entered: compass course (the
one asked for and the one actually followed),
the log readings, strength and direction of the
wind, and sea conditions. “All changes should
also be noted: going about, changes of sail,
changes in the weather, fixes taken (and how
they were made), along with any ships met.
Nothing must be judged insignificant… “The
ship’s log must be kept scrupulously up to date,
even when dead reckonings are not expected to
be made. If there is an accident, then the ship’s
log can be invaluable as evidence of what
actually happened. “If the boat is equipped with
GPS or other electronic position finders, the log
must still be kept up to date and the position
noted regularly. This can then serve as the
starting point for dead reckoning in case of
instrument malfunction or failure."
—The Glenans Manual of Sailing
At the beginning of each cruise, enter the
crew list, departure port and date, and other
details.
Each morning, enter the tides and draw the
day’s tidal curve. Take the first hourly
barometer reading. Make your passage plan
for the day and write it down, listing the
charts required. If a night sail is involved, list
the characteristics of any relevant lights.
Every time something happens, or when
something changes, or once an hour, enter
details of a position fix, weather forecast
received and sailing observations (leaving or
entering a harbour, changing course, taking a
reef, spotting a navy boat, something has
broken). Details of that whale on the port
side, flying fish, and interesting birdlife can
be entered in side notes as well.
At the end of each shift make a navigational
and deck watch hand over, log consumables
level (water, battery, and fuel).
A well-kept personal log book is useful to
keep track of your sea miles / time. When
sailing as crew, ask your skipper to sign and
date the entries after each cruise. Fill the log
using black pen and cross any non-filled fields
so that the log cannot be tempered later.

© www.bluewatermiles.com 4
The Beaufort Scale (B)
No
Description
Wind Speed
At Sea
On Land
m/sek
km/h
knots
0
Calm
0.0 – 0.2
<1
<1
Sea like a mirror
Smoke rises vertically
1
Light Air
0.3 – 1.5
1- 5
1- 3
Ripples like scales form
Wind direction shown
by smoke drift, but not
by wind vanes
2
Light breeze
1.6 – 3.3
6 - 11
4 - 6
Small wavelets
Wind felt on face,
leaves rustle, ordinary
vane moved by wind
3
Gentle breeze
3.4 – 5.4
12 - 19
7 - 10
Large wavelets, crests
begin to break
Leaves and small twigs
in constant motion,
light flags fly
4
Moderate breeze
5.5 – 7.9
20 - 28
11 - 15
Small wavelets becoming
longer, frequent white
horses
Raises dust and loose
paper, small branches
move
5
Fresh breeze
8.0 – 10.7
29 - 38
16 - 21
Moderate waves, many
white horses, chance of
spray
Small trees in leaf sway,
crested wavelets on
inland waters
6
Strong breeze
10.8 – 13.8
39 - 19
22 - 27
Large waves, extensive
white foam crests,
probably some spray
Large branches in
motion, whistling
telephone wires,
umbrellas difficult
7
Near gale
13.9 – 17.1
50 - 61
28 - 33
Sea heaps up, streaks of
white foam
Whole trees in motion,
walking against the
wind feels inconvenient
8
Gale
17.2 – 20.7
62 - 74
34 - 40
Moderately high waves of
greater length
Breaks off twigs,
generally impedes
walking progress
9
Strong / Severe gale
20.8 – 24.4
75 - 88
41 - 47
High waves, dense streaks
of foam, wave crests
topple, spray may reduce
visibility
Slight structural damage
to buildings
10
Storm
24.5 – 28.4
89 - 102
48 - 55
Very high waves, sea
surface appears white,
visibility affected
Trees uprooted,
considerable structural
damage, rarely occurs
inland
11
Violent storm
28.5 – 32.6
103 - 117
56 - 63
Exceptionally high waves,
long white foam patches
cover sea, poor visibility
Widespread damage
12
Hurricane
> 32.6
> 117
> 63
Air filled with foam and
spray, sea completely
white, bad visibility
Widespread damage

© www.bluewatermiles.com 5
State of the Sea (Douglas scale)
Wave Heights are issued in the warnings section of the Sea Area Forecast, using the mariners’ convention whereby heavy
swell means significant wave height of 4 metres or higher.
Sea State
Wave height (m)
Description
0
0
Calm (Glassy)
1
0 – 0.10
Calm (rippled)
2
0.10 – 0.50
Smooth
3
0.50 – 1.25
Slight
4
1.25 – 2.50
Moderate
5
2.50 – 4.00
Rough
6
4.00 – 6.00
Very rough
7
6.00 – 9.00
High
8
9.00 – 14.00
Very high
9
Over 14.00
Phenomenal
Cloud Cover
Additional information can include atmospheric phenomena like rain, hail, drizzle, fog, snow, thunder etc.
Visibility
Air pressure changes and their meanings (applicable for *40-60 degrees N, and pressure < 1005 hpa)
*The lower the latitude (i.e. the closer you are to the equator), the more wind you will see from small changes due to a weak
Coriolis force. Conversely, higher latitudes require more of a barometric change to produce a given amount of wind.
Symbol
Description
0
None or little
1
1/4
2
1/2
3
3/4
X
Completely covered
Symbol
Description
Description
3
Good
more than 5 NM
2
Moderate
2 NM to 5 NM
1
Poor
0.5 NM to 2 NM
0
Very poor (Fog)
less than 0.5 NM
Air pressure change / 1 hour
Air pressure change / 3 hours
Expected wind speed (Bft)
> +1,3 hPa
> +4 hPa
6 – 7
+2 bis +3 hPa
+6 bis +9 hPa
8 – 9
> +3,3 hPa
+10 hPa
10 or more
-1 bis -2 hPa
-3 bis -6 hPa
6 – 7
> -2 hPa
> -6 hPa
8 – 12

© www.bluewatermiles.com 6
Leeway (example for a modern cruiser)
*Depends on boat design (e.g. shallow draft, deep keel, long keel), apparent angle to the wind, sail trim, tack, wind and wave
conditions. Adjust leeway less if the wind is light, and more if the wind is strong. Reduce this amount linearly as you bare away
from the wind.
Estimating leeway
1. Sail with a recognizable land marker dead ahead.
2. Measure your speed.
3. Drop the sails and begin motoring at the same speed in exactly the same direction.
4. Take note of your GPS course.
5. Set the sails and turn off the engine.
6. Continue to aim for the same point on land.
7. Read out your GPS course.
8. The difference in course angles is your leeway.
9. Repeat for different points of sails, opposite tack, and different wind and wave conditions.
Note that:
(a) In an area of heavy current, you will also need to allow for that.
(b) This method does not account for the leeway due to the hull of your boat presented to the wind and swell.
Variation (Declination) on large-scale charts
Variation can be found by looking at the magenta compass rose on a chart. The bearings on the rose refer to true
north and the arrow inside the rose indicates the direction of magnetic north. You should always use the compass rose
closest to your position.
Fig. 1 - Example of compass rose magnetic variation. In 2005 the magnetic north pole was 7°25’ West of the true north pole and
estimated to be traveling 8’ East per year.
Point of sails
Leeway*
Close-hauled
10 (light wind and slight waves) -
20
o
(strong wind and rough seas)
Close-reach
5
o
- 15
o
Beam-reach
4
o
- 10
o
Broad-reach
2
o
- 6
o
Dead-run (running)
0
o
- 2
o

© www.bluewatermiles.com 7
What is the variation in 2021?
1. Find the difference in years between 2021 and 2005 = 16 (years).
2. Multiply 16 (years) x 8' (decrease per year) = 128' or 2º 8'.
3. Apply this to the variation shown. In this example, we subtract: 7°25’ W - 2º 8' E = 5º 17' W.
4. Round off the final number to the closest whole degree. Use 5º W variation at this location.
Variation (Declination) on offshore charts
Offshore charts rarely show more than one or two compass roses and only show true direction. Variation is presented
using lines (curves) of equal variation, the so-called isogonals. These are magenta-coloured, diagonal lines running
across the chart. Use the variation indicated on the isogonic line closest to your position. The isogonal lines show the
variation for the year indicated in the chart description. You have to apply the annual difference in the same way as
for the rose magnetic variation.
Fig. 2 - Variation on offshore charts.
Alternatively, the variation can also be read from magnetic variation charts or from the world magnetic model:
Calculating compass deviation
See: https://bluewatermiles.com/docs/deviation-card.pdf
Abbreviations and symbols used in the logbook
Abbreviations:
Symbols:
Comp. Course - Compass course in [
o
]
↑ set sails
True Course - True course in [
o
]
↓ drop sails
Log - Distance run in [NM]
berth / moor
Speed – Average boat speed in [kn]
depart berth / mooring
Position Fix - lat. & long. or location relative to nav. aids
anchor
Sails - sails set (e.g. J – Jib, M
II
– mainsail second reef)
change course / tack
Motor - revolutions per minute [rpm] if operating engine
(e.g. 1600)
Ship’s TZ - Time zone used on board (e.g. UT+1)
position fix obtained from GPS
position fix obtained without GPS
estimated position (EP) / dead reckoning pos (DR)
Wind Dir & Force - Wind direction and speed in knots or Beaufort
scale (e.g. NW 6)
strbd / port - starboard side / port side
Use other symbols as per „Symbols and Abbreviations
used on Admiralty Paper Charts (NP5011)”
Vis - visibility (e.g. 3, see visibility table)
Baro - pressure at sea level measured by barometer in [hpa], rate
of change is critical, not the absolute reading
Air / Sea Temp - air and sea temperature in Celsius degree

© www.bluewatermiles.com 8
Marine Forecast Glossary
Marine forecasts contain a number of terms which are used to convey specific meanings.
Gale warnings
Timing
Visibility
Movement of pressure systems
Pressure tendency in station reports
Gale
Winds of at least Beaufort force 8 (34-40 knots) or gusts reaching 43-51 knots
Severe gale
Wind force 9 (41-47 knots) or gusts reaching 52-60 knots
Storm
Wind force 10 (48-55 knots) or gusts reaching 61-68 knots
Violent storm
Wind force 11 (56-63 knots) or gusts of 69 knots or more
Hurricane force
Wind force 12 (64 knots or more)
Imminent
Expected within 6 hours of the time of issue
Soon
Expected within six to 12 hours of the time of issue
Later
Expected more than 12 hours from the time of issue
Good
more than 5 NM
Moderate
2 NM to 5 NM
Poor
0.5 NM to 2 NM
Very poor
less than 0.5 NM
Slowly
Moving at less than 15 knots
Steadily
Moving at 15 to 25 knots
Rather quickly
Moving at 25 to 35 knots
Rapidly
Moving at 35 to 45 knots
Very rapidly
Moving at more than 45 knots
Rising (or falling) more slowly
Pressure rising (or falling) at a progressively slower rate through the
preceding three hours
Rising (or falling) slowly
Pressure change of 0.1 to 1.5 hPa in the preceding three hours
Rising (or falling)
Pressure change of 1.6 to 3.5 hPa in the preceding three hours
Rising (or falling) quickly
Pressure change of 3.6 to 6.0 hPa in the preceding three hours
Rising (or falling) v. rapidly
Pressure change of more than 6.0 hPa in the preceding three hours
Now rising (or falling)
Pressure has been falling (rising) or steady in the preceding three hours,
but at the time of observation was definitely rising (falling)

© www.bluewatermiles.com 9
Wind
Sea State
Term
Wave height (m)
Smooth
< 0.50
Slight
0.50 – 1.25
Moderate
1.25 – 2.50
Rough
2.50 – 4.00
Very rough
4.00 – 6.00
High
6.00 – 9.00
Very high
9.00 – 14.00
Phenomenal
Over 14.00
Classification of Tropical Cyclones
Term
Wind speed (kn)
Tropical depression
< 34
Tropical storm
34 – 63
Hurricane
> 63
Category of Hurricanes (Tropical Revolving Storms) in the Saffir-Simpson wind scale
Category
Wind speed (kn)
1
64 – 82
2
83 – 96
3
97 – 113
4
114 – 134
5
> 134
Whilst all hurricanes have their origins in tropical depressions, not all tropical depressions become hurricanes. Of the 70 areas of
tropical circulation that occur annually, less than 10% become hurricanes.
Wind direction
Indicates the direction from which the wind is blowing
Becoming cyclonic
Indicates that there will be a considerable change in wind direction
across the path of a depression within the forecast area
Veering
The changing of the wind direction clockwise, e.g. SW to W. If Tropical
Revolving Storm is approaching it will indicate a dangerous semicircle.
Backing
The changing of the wind in the opposite direction to veering
(anticlockwise), e.g. SE to NE. If Tropical Revolving Storm is approaching
it will indicate a navigable semicircle.
© www.bluewatermiles.com 10
"Traditional" Navigation Primer
Convert True course (T) to Compass course (C)
True course (T) ± Variation (V) = Magnetic (M) ± Deviation (D) = Compass course (C)
Apply a simple mnemonic to remember the formula:
True Virgins Make Dull Company + Whiskey (add westerly)
Deviation (D): effect of deflecting a compass by electrical equipment or metal. Read this off from the boat’s deviation
card. Since hand-bearing compasses are not used on a fixed position, no deviation table can be used to correct
deviation errors. As a consequence, bearings should preferably be taken from deviation-free locations on the boat well
away from electronic and metallic gear. Make sure to remove watch and metal frame glasses too. Remember that
deviation is determined by the course you are sailing (heading), not the bearing. If you bear 015
o
but sail on 220
o
, read
deviation for 220
o
.
Variation (V) - aka Magnetic Declination: the difference between the direction of true and magnetic north. Read this
off from a chart’s compass rose or isogonic lines (magenta-coloured, diagonal dashed lines on offshore charts).
You can apply a simple mnemonic to know which sign (+ or -) to use for deviation and variation when converting from
True course to Compass course and vice versa:
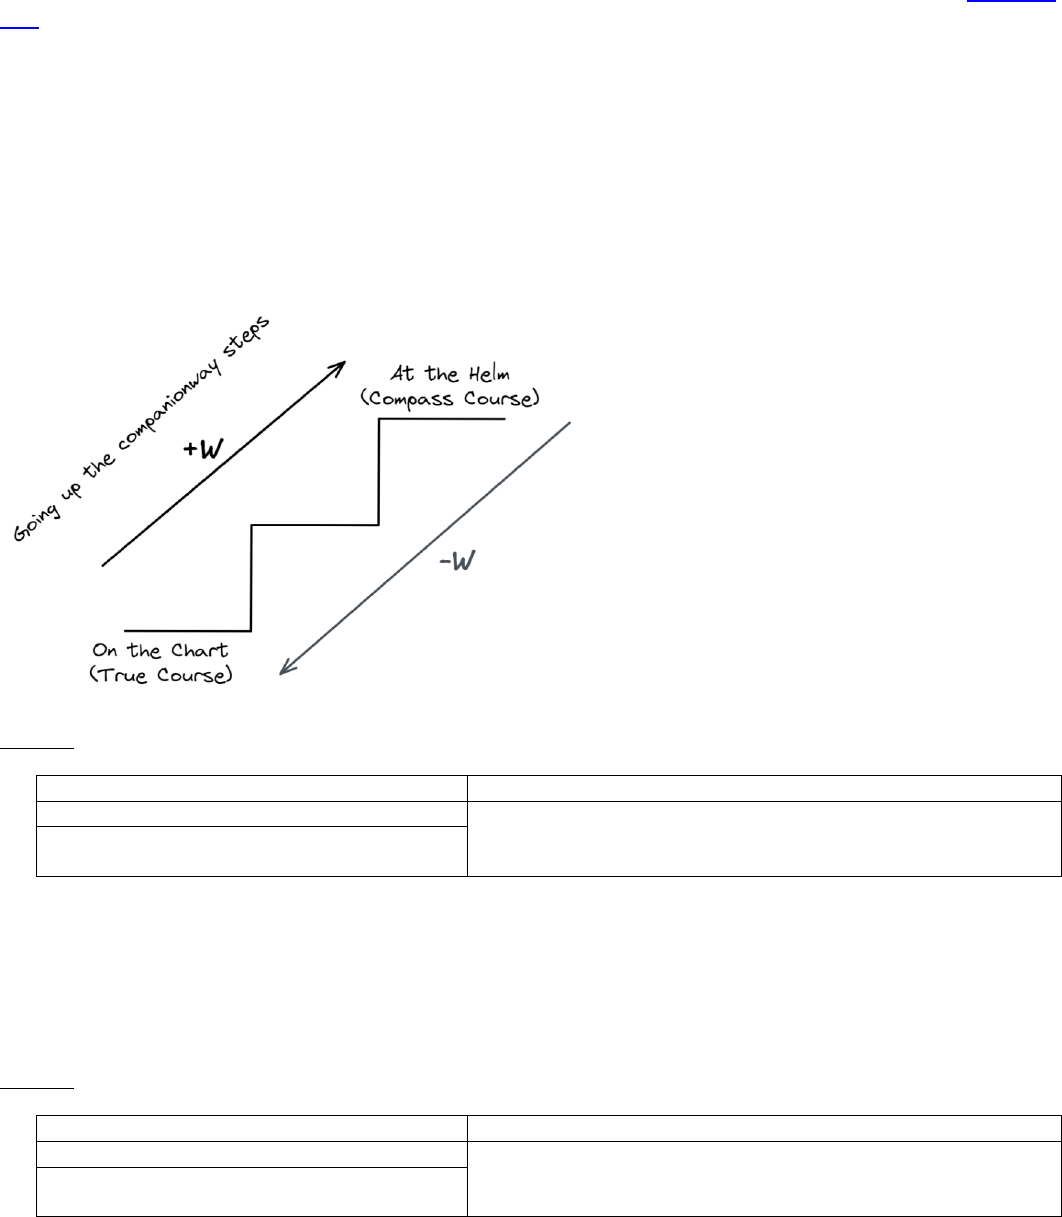
If you are going from True Course (shown on the
chart down below deck) to Compass Course (shown
by the compass at the helm) then Westerly degrees
are added, and Easterly subtracted. When going
backwards the opposite logic applies.
Fig. 3 - Sign rule when converting courses from True to
Compass and vice versa.
Example:
Input
Solution
True course (T): 40
o
40
o
(T) + 3
o
W (V) - 2
o
E (D) = 41
o
Compass course (C)
Variation (V): 3
o
W
Deviation (D): 2
o
E (read based on T+V = 43
o
)
Convert Compass course (C) to True course (T)
Compass course (C) ± Deviation (D) = Magnetic (M) ± Variation (V) = True course (T)
(opposite logic to conversion from True to Compass)
Example:
Input
Solution
Compass course (C): 72
o
72
o
(C) + 2
o
E (D) - 3
o
W (V) = 71
o
True course (T)
Deviation (D): 2
o
E (read based on C)
Variation (V): 3
o
W

© www.bluewatermiles.com 11
Dead reckoning and Estimated position
Dead reckoning (DR) is a position derived just from the course steered and the distance the boat has travelled through
the water. A more accurate variant of this is where the effect of leeway has also been taken into consideration.
Estimated Position (EP) is DR with the tidal stream added on.
Leeway: angle between the direction of the boat’s heading and the direction in which she is actually moving through
the water as a result of being blown sideways (off course) by the wind. It does not change the heading of the boat
therefore should always be applied at the end.
Tidal stream: in tidal waters read set (direction) and rate (speed) off from tidal diamonds on top of a chart or from a
tidal atlas (see below). On the open ocean, the surface current is usually negligible, therefore we can skip the tidal
stream.
Fig. 4 - Example of a tidal stream on a nautical chart: 3h after HW Eastbourne, rate: 1.2kt at spring, 0.6kt at neap, set: 031
o
. Tidal
diamonds are shown on nautical charts at locations where tidal stream information has been measured.
Fig. 5 - Example of a tidal stream from tidal atlas: 6h before HW Portland, rate: 1.3kt at neap, 2.5kt at spring, set: 330
o
.

© www.bluewatermiles.com 12
Tide tables: specify the times of each HW and LW for each day of the year for standard ports (larger ports or reference
ports). You need to know the HW or LW before you enter the tidal stream table or atlas. Time is based on the standard
time of the country concerned (noted on the tide table). When a daylight-saving scheme is in operation, an hour has
to be added to the time shown in the tide table.
Fig. 6 - Example of a tidal table that gives the time and heights of high and low waters for the standard port.
It is not practical for publishers of tide tables to issue tides for every harbour for the entire year. Therefore the tide
tables include calculations for "standard ports" only and the other ports’ (secondary ports) tide times and heights can
be calculated using adjustments from these standard ports. We can then use this newly calculated information to fill
out the standard port’s tidal curve. We then have our curve for the day set up for the secondary port.
Dead Reckoning (DR) procedure
Gives answer: Where we are based on the course steered and distance run.
1. Calculate Water Track (T).
Course Steered (Compass course C) ± Deviation (D) ± Variation (V) ± Leeway (L) = Water Track (T)
2. Plot the Water Track (T) on the chart from the last position and apply the distance travelled by the boat. The
position drawn is the DR.
Because there is no tidal stream: Water Track (T) == Ground Track (T) (aka COG)
Leeway rule for DR/EP:
• Wind coming from Port – Add (Plus), the boat was blown off the course in a clockwise direction
• Wind coming from Starboard – Subtract (Minus), boat blown off the course in an anticlockwise direction
Example:
Input
Solution
Compass course (C): 64
o
Speed: 4.2kt;
Time: 0800 – 0900 (1h)
Distance run (log): 4.2NM (1kt == 1NM per hour)
Water Track (T) = 64
o
(C) - 1
o
W (D) + 2
o
E (V) + 5
o
(L) = 70
o
Deviation (D): 1
o
W (based on C)
Variation (V): 2
o
E
Leeway (L): 5
o
port tack
Fig. 7 – Dead reckoning (DR).

© www.bluewatermiles.com 13
Estimated Position (EP) procedure (tidal waters)
Gives the answer to where we are based on the course steered, distance run and the tidal stream at that time.
Follow the DR procedure and add the following when a tidal stream is present:
3. From the end of the Water Track (T) (DR 0900) plot the Tidal Stream (read Set and Rate from tidal atlas or chart).
4. A line drawn between the Last Position (0800) and the end of the Tidal Stream is the Ground Track (T). The crossing
point between the Tidal Stream and the Ground Track is the EP.
Example:
Input
Solution
Compass course (C): 64
o
Speed: 4.2kt
Time: 0800 – 0900 (1h)
Distance run (log): 4.2NM (1kt == 1NM per hour)
Water Track (T) = 64
o
(C) - 1
o
W (D) + 2
o
E (V) + 5
o
(L) = 70
o
Ground Track (T) = 90
o
(measured on the Ground Track vector)
Tidal stream: Set 160
o
, Rate 2kt
Deviation (D): 1
o
W (based on C)
Variation (V): 2
o
E
Leeway (L): 5
o
port tack
Fig. 8 - Estimated position.
Course to Steer (when there is no tidal stream)
Gives answer: What course the helmsman should steer to arrive at the intended waypoint.
1. Plot the required Ground Track (T) (aka Intended Track or COG) on the chart from the last position.
2. Calculate Course to Steer (Compass).
Water Track (T) ± Variation (V) ± Deviation (D) ± Leeway (L) = Course to Steer (C)
(opposite logic to DR)
If there is no tidal stream: Ground Track (T) == Water Track (T)
Leeway rule for Course to Steer (counteract the leeway):
• Wind coming from Starboard – Add (Plus), counteract boat blown off the course in clockwise direction
• Wind coming from Port – Subtract (Minus), counteract boat blown off the course in anticlockwise direction
Example:
Input
Solution
COG (T): 320
o
, no tidal stream
Speed: 4.2kt
Time: 0800 – 0900 (1h)
Distance to run (log): 4.2NM (1kt == 1NM per hour)
Course to Steer (C) = 320
o
(T) - 2
o
E (V) + 7
o
W (D) - 10
o
(L) = 315
o
Leeway (L): 10
o
port tack
Variation (V): 2
o
E
Deviation (D): 7
o
W (based on T-V = 318
o
)

© www.bluewatermiles.com 14
Fig. 9 - Course to steer in non-tidal waters.
Course to Steer (when there is a tidal stream)
Gives answer: What course the helmsman should steer to arrive at the intended waypoint.
1. Plot the required Ground Track (T) (aka Intended Track or COG) on the chart from the last position.
2. Plot the Tidal Stream from the starting point. Read Set and Rate from a tidal atlas or chart.
3. With dividers centered at the end of the Tidal Stream and a radius set equal to the anticipated speed, swing an arc
to cut the Ground Track (Intended Track).
4. The line between the end of the Tidal Stream and the Intended Track is the Water Track (T).
5. Calculate Course to Steer (Compass) – use the above formula.
Example:
Input
Solution
COG (T): 320
o
Speed: 4.2kt
Time: 0800 – 0900 (1h)
Distance to run (log): 4.2NM (1kt == 1NM per hour)
Water Track (T) = 310
o
(from plotting, points 1-4)
Course to Steer (C) = 310
o
(T) - 2
o
E (V) + 7
o
W (D) - 10
o
(L) = 305
o
Tidal stream: Set 186
o
, Rate 1.8kt
Leeway (L): 10
o
port tack
Variation (V): 2
o
E
Deviation (D): 7
o
W (based on T±V)
Fig. 10 - Course to steer in tidal waters

© www.bluewatermiles.com 15
Fixing Positions without GPS (Coastal)
3 point fix: compass bearings to three separate marks gives a fix. It is unlikely that the three position lines will meet at
one point, instead forming a triangle known as a cocked hat.
Fig. 11 - three-point fix.
Even two bearings can do but the more position lines the better.
Fig. 12 - two-point fix.
Running fix (aka Transferred position line): estimating position based on one mark only.
Fig. 13 - Running fix on a lighthouse.

© www.bluewatermiles.com 16
Transit: two charted objects in line with one another, gives a transit. Two transits give a fix.
Fig. 14 - Charted transit lines: leading lights.
Uncharted transit lines: church and wind turbine, north cardinal buoy and light vessel.
Bearing and depth contour: compass bearing to a landmark with depth contour, gives a fix.
Fig. 15 - Lighthouse provides a position line from a bearing and the 50 metres depth contour help
to fix the position (the tidal level needs to be taken into account!).
Clearing bearings: this involves taking a bearing on an object which if exceeded or reduced will place you in danger.
Fig. 16 - Two clearing bearings can be used to form a safe cone within which we can tack.

© www.bluewatermiles.com 17
Forward and back bearings: bearing to a fixed object can be made either astern or ahead. By keeping
the object on this bearing we stay on a fixed safe line on the chart.
Fig. 17 - Forward and back bearings.
Bearing and distance from vertical sextant angle: compass bearing to a landmark with range (distance) to it, gives a
fix. By measuring the vertical sextant angle between the top of a landmark of known height (e.g. lighthouse, peak of a
mountain) and water, the distance can be read from a table (e.g. Reeds Almanac) or calculated as below:
The elevation of charterd objects can be found on charts or nautical publications such as the "List of Lights".
Example:
Input
Solution
Light characteristics: FL 6s 104m 27NM
Vertical sextant angle: 2
o
30’
Take bearing to the lighthouse and measure the vertical sextant angle
to get the distance off.
Fig. 18 - Bearing and distance from vertical sextant angle.

© www.bluewatermiles.com 18
Bearing and distance from rising or dipping: compass bearings to a landmark with range (distance) to it, gives a fix.
This is especially useful for landfalls. If a landmark is observed to be just rising above (when coming towards it) or just
dipping below (when sailing away from it) the visible horizon, its distance (Geographical range) can be calculated:
Distance of Horizon =
Fig. 19 - Bearing and distance from rising or dipping.
The "Geographical Range" is just a function of the curvature of the earth and is determined solely from the heights
above sea level of the light itself and of the observer’s eye. The geographical range can also be read directly from the
Geographical Range table, so long as it is a nice clear day. Alternatively, use the Distance of Horizon table that you can
find in Reeds Almanac and simply sum the distance to the horizon for the observer and the object.
Example:
Input
Solution
Height of eye: 2m
Visibility: good
Landmark height: 40m
Geographical range =
2.9 NM distance of horizon for the height of eye 2m
+13.2 NM distance of horizon for landmark height 40m
16.1 NM
At night you can use the same calculations to raise or dip a light. However, the light’s intensity (its luminous range)
might be greater or smaller than its geographical range. The "Visible Range", the distance that you will likely see the
light is ALWAYS equal to the lesser of the Luminous Range or Geographic Range:
If Luminous range >= Geographical range, then use Geographical range
(on the approach, the light loom in the sky above the horizon would first be observed. At the moment that the light
itself shines clear over the horizon, the dipping/raising distance is reached)
If Luminous range < Geographical range, then use Luminous range
A light’s "Luminous Range" is an approximation of the maximum range at which an observer can see a light under
existing meteorological conditions. This luminous range ignores all other considerations that may affect the visibility of
the light such as but not limited to: background lighting, the elevation of the light, and the observer's height of eye. It
can be read from the Luminous Range table (see below) based on the landmark’s Nominal Range and the existing
meteorological visibility.
The "Nominal Range" is the maximum distance at which a given light may be seen in “clear weather.” (Clear weather is
defined as meteorological visibility of 10 nautical miles). It is equal to the Luminous Range (explained below) when in a
homogenous atmosphere a meteorological visibility of 10 NM exists. The Nominal Range of any given light is shown on
and can be read directly from nautical charts and is also given in the "List of Lights" publications. On a clear nigh it may
shine further and on a hazy night less far. Lights with a range of less than 10 NM will often merge into other lights on
the shore.
For sector lights, the general practice is for coloured sectors to indicate danger and white sectors safe passages.
Generally, if a light shows a white safe sector with red and green sectors on each side, the green sector is to starboard
and the red to port. However, this rule is not universal and should be checked for each light. Some lights are
directional, that is, they show brightly over a very narrow sector and sometimes faintly outside the sector.

© www.bluewatermiles.com 19
Example:
Input
Solution
Height of eye: 2m
Visibility: 20NM (approximate, hard to
estimate)
Light: Fl 5s 168ft 14M (height 51m)
(flashing white light with a period of 5
seconds 168ft / 51m high and 14 miles
nominal range, in meteorological visibility
of 10 nautical miles)
2.9 NM distance of horizon for height of eye 2m
+14.8 NM distance of horizon for height 51m
Geographical range = 17.7NM
Luminous range = 22 NM
(from the luminous range diagram: light with a nominal range of 14 NM - the
top of the table, 20 miles visibility - on the curved line, read luminous range on
the left)
Luminous range >= Geographical range therefore the light should raise or dip
from ~18NM. The loom of the light should be visible from 22NM.
Fig. 20 - Luminous range diagram.
Distance-off by doubling the relative bow bearing: it is a simple method of finding a distance-off a mark by measuring
the distance travelled while the relative bearing (right or left) of a fixed object doubles. The distance from the object
at the time of a second bearing is equal to the distance run between the bearings. The fix requires the first bearing to
be less than 45
o
from the bow.
You can use this technique when the mark is already passed by taking the second bearing at half of the first relative
bearing instead of double. This will give the distance-off at the time of the first bearing.
You can also use a similar method to predict the distance-off when the mark will be abeam before you reach it.
Instead of using the double bearing, certain combinations of relative bearings can be used: 20
o
/30
o
, 22
o
/34
o
, 25
o
/41
o
,
26.5
o
/45
o
, 27
o
/46
o
, 29
o
/51
o
, 32
o
/59
o
, 35
o
/67
o
, 37
o
/72
o
, 40
o
/79
o
, 43
o
/86
o
, 44
o
/88
o
, 45
o
/90
o
. In each of these bearing
combinations, the distance-off when the mark will be abeam is equal to the distance run between them.

© www.bluewatermiles.com 20
Example:
Input
Solution
Steering course (S): 70
o
Speed: 5kt
First bearing to a lighthouse (A): 60
o
(absolute).
Relative bearing from bow to the lighthouse:
70
o
(S) - 40
o
(A) = 30
o
Next, the boat is run until the relative bearing to the lighthouse
doubles: 70
o
(S) - 20
o
(A) = 60
o
(it has to bear 20
o
absolute)
Time difference between bearings: 30min
7/10 and 7/8 rule: can be used to predict distance-off when the sighted object is abeam.
In the 7/10 rule, if the first relative bearing is 22.5
o
and the second is 45
o
, the distance-off when the object is abeam is
0.7 the distance run between the first two bearings. In the 7/8 rule, the two bearings are 30
o
and 60
o
. When the object
is abeam, the distance-off is 0.875 the distance run.
Estimating distance-off shore: if you can count individual trees, you are about 1 NM offshore. If you can count
windows on waterfront houses, the distance off is about 2 NM. And if you can see the junction line between land and
water, you are about 3 NM away.
The Rule of 60: can be used to estimate a safe course around a hazard that lies at a distance dead ahead. The method
is accurate to within 5
o
and works only when short distances are involved. However, even if off by a couple of degrees,
it provides an extremely quick solution.
For example, sailing on a course of 185
o
, the boat is headed right at a reef 6 miles ahead. The safest passage around
the reef is 2 miles to the side from its centre. The safe course around the reef is 20
o
to either side of the present
course (either 165
o
or 205
o
):
Fig. 21 – Graphical representation of the Rule of 60.

© www.bluewatermiles.com 21
Radar ranges and bearing: you can make a fix to known charter objects (preferably lighthouses, other buildings, or
headlands) using radar range rings (VRM - Variable Range Marker) to at least two such charter objects. While radar
ranges are generally more accurate than radar bearings (ELB - Electronic Bearing Line), accurate only to within 3 to
5 degrees, bearing fixes can be made using the bearing much the same way that they are made with a compass. Range
and bearing fixes can be made with just one charter object by determining both your range and your bearing to a
charted object at the same time.
Pilotage in restricted visibility: by knowing the current height of tide we can pick a depth contour that keeps us safely
off dangers and leads out towards our destination (aka "blind navigation").
If the visibility is poor or there is no conspicuous object to keep a bearing on, take a course to intercept a safe depth
contour. Once the depth has been reached turn onto the general heading which the contour follows. This should bring
you within sight of the harbour entrance.
Fig. 22 - Navigating in restricted visibility using "Blind" navgiation.
Keeping a navigational log and plotting the yacht’s position on the chart is vital.
Apply the 6 minutes rule. For example, if the yacht is travelling along at 6kt, in 6 minutes the yacht would have done a
tenth of the current boat speed which is 0.6nm.
Example:
Tidal stream: set 090
o
, rage 1.5kt
Height of tide: 3m
Draught: 2.5m
Depth sounder callibrated for the end of the keel
Deviation (D): 1
o
W (0
o
to 90
o
)
Variation (V): 4
o
W
Destination: south cardinal buoy (see picture above)
Time [min.]
Trip [NM]
Course [o]
Depth [m]
SOG [kt]
Notes
0
0.0
030
o
T = 035
o
C
(skipped tidal
stream)
15.1
4.5
050
o
47’.1 N
001
o
10’.2 W
Keep until 5.5m depth is read:
5m depth + 3m height of tide -
2.5m draught
6
0.6
(4.5kt SOG + 1.5kt tide =
6NM in 60min
= 0.6NM in 6 min
= 0.3NM in 3 min etc.)
085
o
T = 090
o
C
5.5
4.5
5m contour reached, turning to
starboard
3
0.3
075
o
T = 080
o
C
5.6
4.5
Turning 10
o
to port
3
0.3
095
o
T = 100
o
C
5.4
4.5
Turning 20
o
to starboard
3
5.5
South cardinal sighted to port

© www.bluewatermiles.com 22
Example of Pilotage Plan

© www.bluewatermiles.com 23
Fixing Positions without GPS (Offshore)
Celestial navigation (aka astronavigation) is a method of position fixing out of sight of land. It uses "sights", or angular
measurements taken by sextant between a celestial body (e.g. the Sun, the Moon, a planet, or a star) and the visible
horizon. The sights can be taken when both the celestial object and the horizon are visible (during daylight or twilight).
A handy guide to measuring angles in the sky:
Fig. 23 - Simple methods to measure angles in the sky.
Performance
VMG (Velocity Made Good) indicates the speed of a boat towards (or from) the direction of the wind. It can be used to
find the optimal angle to the wind to reach the destination. At optimal speed and wind direction, VMG is maximized
(the higher the VMG the better). VMG is available in most marine navigation apps given GPS and wind instruments are
connected. VMG can be calculated using the below formula:
gives boat speed in knots towards/from the direction of the wind,
Example:
SOG
VMG [kt]
55
o
4.0
2.3
60
o
5.0
2.5
65
o
5.2
2.2
To reach the destination in the fastest
time sail on course 60
o
.

© www.bluewatermiles.com 24
Boat check-in remarks
Crew list
No.
Name
Capacity*
Watch
No.
Phone
Date of safety
briefing**
Notes
1
2
3
4
5
6
7
8
9
10
11
12
13
14
15
16
17
18
*Master (Captain) / Watch Leader (WL) / Crew
**Safety briefing includes: personal safety and safety equipment, emergency procedures (mob, fire, water,
abandoning ship), sails and lines handling, night sailing if applicable, crew welfare and teamwork

© www.bluewatermiles.com
Date: 16.09.2021 Day of Week: Thursday Ship’s TZ: UT From: Cowes Towards: Falmouth
Navigation
The Boat
Weather
Wat
ch
No.
Time
Comp.
Course
True
Course
Speed
Log
EP / Position Fix
Sails
Motor
Wind
Dir &
Force
Sea
State
Cloud
Cover
Vis
Baro
Air /
Sea
Temp
1
0100
1
0200
1
0300
1
0400
2
0500
2
0600
2
0700
2
0800
4.0
0832 Cowes,
depart for Falmouth
-
1600
2
1
3
2013
12
o
/16
o
3
0900
250
245
5.1
2
Pilotage out of Cowes
J,M
NE 12
2
1
3
2013
13
o
/16
o
3
1000
250
245
5.3
7,1
1050 Yarmouth abeam port
J,M
NE 15
2
1
3
2012
13
o
/16
o
3
1100
250
245
6.6
12,4
1120 Hurst Pt. strbd
J,M
I
NE 18
3
1
3
2012
14
o
/16
o
3
1200
250
245
6.6
19,0
50
0
44.2N 001
0
08.2W
J,M
I
NE 19
3
1
3
2012
13
o
/15
o
1
1300
240
234
6.6
25,6
J,M
I
NE 18
3
1
3
2012
14
o
/15
o
1
1400
240
234
5.2
32,2
50
0
44.2N 001
0
08.2W
J,M
I
NE 16
4
1
3
2011
16
o
/15
o
2
1500
240
234
5.0
37,4
J,M
I
NE 14
4
1
3
2011
16
o
/14
o
2
1600
240
234
5.0
42,4
50
0
44.2N 001
0
08.2W
J,M
NE 14
4
1
3
2011
16
o
/14
o
3
1700
240
234
5.0
47,4
(3 p. fix) 50
0
30.2N 002
0
09.6W
J,M
E 15
4
2
3
2011
15
o
/13
o
3
1800
265
270
5.0
52,4
50
0
25.7N 002
0
26.1W
Portland Lt. to strbd
J,M
E 15
4
2
3
2012
15
o
/13
o
3
1900
265
270
5.0
57,4
J,M
E 15
3
2
3
2012
15
o
/12
o
3
2000
265
270
5.0
62,4
50
0
22.1N 002
0
38.2W
J,M
E 16
3
2
3
2012
14
o
/11
o
1
2100
265
270
5.0
67,4
2005
50
0
21.7N 002
0
41.4W
J,M
E 16
3
2
3
2012
13
o
/11
o
1
2200
265
270
5.0
72,4
50
0
16.6N 002
0
52.8W
J,M
E 14
3
2
3
2012
12
o
/11
o
1
2300
265
270
5.0
77,4
J,M
E 14
3
2
3
2012
11
o
/11
o
1
2400
265
270
4.5
81,9
(3 p. fix) 50
0
08.2N 003
0
02.3W
J,M
E 12
3
2
3
2012
11
o
/11
o
Sailed
Sail
hours
Engine hours
Night
hours
Distance
[NM]
Deviation from deviation card. Leeway estimated.
Variation: 2
0
W
Notes:
1500 VHF Weather Forecast:
Wight NE4, moderate, Portland E4, moderate, showers
1820 Bildges check, deck walk – OK
1950 Nav. lights ON
Today
17
1
0
81.9
Transferred
22
4
5
92.1
Total
39
5
5
174

© www.bluewatermiles.com
Additional notes
0700 Safety Briefing
0845 ↑ J,M
0910 Practice MOB
Course to steer: 245
o
(T) + 2
0
W (V) - 1
0
E (D) + 5
0
(L, strdb tack) = 251
o
(C) ~ 250
o
(C)
1055 Consumables: Water 100% (tank 1), 100% (tank 2), 32/34 (bottles); Fuel: 100%; Battery: 12.6 Ah
1100 Put reef I on Main
1300 corrected course to 240
0
(C)
True course: 240
o
(C) + 1
0
E (D) - 2
0
W (V) - 5
0
(L, strdb tack) = 234
o
(T)
15:40 Shaked out reef I on Main
1610 Dophin spotted on port side
1710 Gybed, 265
o
(C)
True course: 265
o
(C) + 2
0
E (D) - 2
0
W (V) + 5
0
(L, port tack) = 270
o
(T)
1600 Noted GPS position and switched to traditional navigation for training purposes
Dinner at sunset
2005 (star sights) 50
0
21.7N 002
0
41.4W
2330 Consumables: Water 90% (tank 1), 100% (tank 2), 28/34 (bottles); Fuel: 100%; Battery: 12.5 Ah

© www.bluewatermiles.com
Date: ................ Day of Week: ................ Ship’s TZ: ....... From: ..................... Towards: .....................
Navigation
The Boat
Weather
Wat
ch
No.
Time
Comp.
Course
True
Course
Speed
Log
EP / Position Fix
Sails
Motor
Wind
Dir &
Force
Sea
State
Cloud
Cover
Vis
Baro
Air /
Sea
Temp
0100
0200
0300
0400
0500
0600
0700
0800
0900
1000
1100
1200
1300
1400
1500
1600
1700
1800
1900
2000
2100
2200
2300
2400
Sailed
Sail
hours
Engine hours
Night
hours
Distance
[NM]
Deviation from deviation card. Leeway estimated.
Variation: .........
Notes:
Today
Transferred
Total

© www.bluewatermiles.com
Additional notes
