
CIBC Annual Report 2022
Ambitions
made real
Annual Report 2022

CIBC’s purpose is to help make
your ambition a reality
Who we are
CIBC is a leading and well-diversified North American financial institution
committed to creating enduring value for all our stakeholders – our clients, team,
communities and shareholders. We are guided by our purpose – to help make
your ambition a reality, and we are activating our resources to create positive
change and contribute to a more secure, equitable and sustainable future.
Across our bank and our businesses – Personal and Business Banking,
Commercial Banking and Wealth Management, and Capital Markets –
our 50,000 employees bring our purpose to life every day for our 13 million
personal banking, business, public sector and institutional clients in Canada,
the U.S. and around the world.
Our strategy
In 2022, our modern relationship-oriented bank continued to focus on
delivering superior client experience and top-tier shareholder returns while
maintaining our financial strength, risk discipline and advancing our purpose-
driven culture. Going forward, the execution of our client-focused strategy will
enable us to continue driving long-term growth and to build on our momentum
as we focus on three strategic priorities:
1.
Further growing our market share of high-growth, high-touch client segments;
2. Elevating the CIBC banking experience for our clients through investments
in digitization and technology, and further increasing connectivity across
our businesses; and
3. Investing in our future dierentiator businesses that are positioned to win in
faster growing markets.
2022 highlights
$6.2B
Reported net income
14.0%
Return on equity
13M
Clients
$6.6B
Adjusted net income
(1)
14.7%
Adjusted return on equity
(1)
11.7%
Common Equity Tier 1 ratio
(2)
(1) A djusted measures are non-GAAP measures. For additional information, see the “Non-GAAP measures” section of the management’s discussion and analysis (MD&A).
(2) Calculat ed pursuant to Oce of the Superintendent of Financial Institutions (OSFI) Capital Adequacy Requirements (CAR) Guideline, which is based on Basel
Committee on Banking Supervision (BCBS) standards.

Tableofcontents
performanceataglance
ESGstrategy i
Ourcontributiontotheecosystem ii
Clientexperience iii
MessagefromthePresidentand
ChiefExecutiveOcer iv
MessagefromtheChairoftheBoard ix
EnhancedDisclosureTaskForce x
Management’sdiscussion
andanalysis
Consolidatedfinancialstatements
Notestotheconsolidated
financialstatements
Quarterlyreview
Ten-yearstatisticalreview
Shareholderinformation
2022 performance
at a glance
Business mix
(% reported net income)
36%
Canadian
Personal and
Business Banking
30%
Canadian
Commercial
Banking
and Wealth
Management
12%
U.S. Commercial
Banking
and Wealth
Management
31%
Capital Markets
-9%
Corporate
and Other
Reported earnings per share
(1)
($)
$6.68
6.96
4.11
22
2120
Adjusted earnings per share
(1)(2)
($)
$7.05
7.23
4.85
22
2120
Reported revenue
($ billions)
$21.8
20.0
18.7
22
2120
Dividend
(1)
($/share)
$3.27
2.92
2.91
22
2120
(1) On April 7 , 2022, CIBC shareholders approved a two-for-one share split (Share Split) of CIBC’s issued and
outstanding common shares. Each shareholder of record at the close of business on May 6, 2022 (Record
Date) received one additional share on May 13, 2022 (Payment Date) for every one share held on the
Record Date. All common share numbers and per common share amounts have been adjusted to reflect
the Share Split as if it was retroactively applied to all periods presented.
(2) Adjusted measures are non-GAAP measures. For additional information, see the “Non-GAAP measures”
section of the MD&A.

Financial highlights
For the year ended October 31 (Canadian $ in billions, except as noted) 2022 2021
Financial results
Revenue
Provision for credit losses
Expenses
Reported/Adjusted net income
(1)
Adjusted pre-provision, pre-tax earnings
(1)
Financial measures (%)
Reported
(2)
/Adjusted eciency ratio
(1)
Reported
(2)
/Adjusted return on common shareholders’ equity (ROE)
(1)
Net interest margin
(2)
Total shareholder return ()
Common share information
Reported/Adjusted diluted earnings per share
(1)(3)
Market capitalization
Dividends (%)
Dividend yield
Reported
(2)
/Adjusted dividend payout ratio
(1)
Net income by strategic business unit
Canadian Personal and Business Banking
Canadian Commercial Banking and Wealth Management
U.S. Commercial Banking and Wealth Management
Capital Markets
2022 financial scorecard
Target Reported results Adjusted results
(1)
Diluted earnings per
share (EPS) growth
(3)
%–%annually
()
down%from
-yearCAGR
()
%
-yearCAGR%
down%from
-yearCAGR%
-yearCAGR%
Return on equity
(ROE)
(2)
Atleast%
()
%
3-year average = 13.4%
5-year average = 14.2%
%
3-year average = 14.4%
5-year average = 15.2%
Operating leverage
(2)
Positive
()
()%adecreaseof
basispointsfrom
3-year average = (0.2)%
5-year average = 0.1%
()%adecreaseof
basispointsfrom
3-year average = (0.6)%
5-year average = 0.5%
CET1 ratio
Strongbuerto
regulatoryrequirement
%
Dividend
payout ratio
(2)
%–%
()
%
-yearaverage%
-yearaverage%
%
-yearaverage%
-yearaverage%
Total shareholder
return
OutperformtheS&PTSX
CompositeBanksIndexovera
rollingthree-andfive-yearperiod
3-year 5-year
CIBC
BanksIndex
%
%
%
%
(1) Adjusted measures are non-GAAP measures. For additional information, see the “Non-GAAP measures” section of the MD&A.
(2) For additional information on the composition of these specified financial measures, see the “Glossary” section of the MD&A.
(3)
On April 7, 2022, CIBC shareholders approved a two-for-one share split (Share Split) of CIBC’s issued and outstanding common shares. Each shareholder of record
at the close of business on May 6, 2022 (Record Date) received one additional share on May 13, 2022 (Payment Date) for every one share held on the Record Date.
All common share numbers and per common share amounts have been adjusted to reflect the Share Split as if it was retroactively applied to all periods presented.
(4) Based on adjusted measures. Adjusted measures are non-GAAP measures. For additional information, see the “Non-GAAP measures” section of the MD&A.
(5) T he 3-year compound annual growth rate (CAGR) is calculated from 2019 to 2022 and the 5-year CAGR is calculated from 2017 to 2022.

Our commitment to ESG
ESG strategy
Ambitions in action
We’re activating our resources to create positive
change for our team, our clients, our communities
and our planet, contributing to a more secure,
equitable and sustainable future where everyone’s
ambitions are made real.
We are putting our ESG commitments into action by:
Building integrity and trust
We’re leveraging technology to deliver
innovative solutions that enable our
clients to achieve their financial goals, and
empowering our team to further enhance
client experience.
• Prioritizing the good of our clients,
shareholders and society, we advanced
our work on Data Ethics Impact and
Risk Assessment to help guide the
ethical acquisition, management and
use of data, supported by a process and
Advisory Committee to evaluate risk,
bringing governance and oversight, and
underpinned by our culture and training.
• Demonstrating how we’re rapidly
transforming our bank to be more agile,
scalable and resilient, while designing
security into everything we do as part
of our overall Technology Strategy
with the multi-year agreement with
Microsoft Azure.
• Enhancing secure data sharing for
clients, ensuring a safe and seamless
experience for clients to share their
financial information with third-party
fintech applications facilitated by our
partnership with MX Technologies Inc.
Creating access to opportunities
We’re investing in strengthening and
building more equitable and resilient
communities. Our action plan is focused on
removing barriers to access, championing
change as an employer, and strengthening
the communities we serve.
• Partnering with Microsoft Canada
and co-funded by the CIBC Foundation,
our new Social Impact Alliance will
support NPower Canada and March
of Dimes Canada to focus on closing
the digital skills gap by providing
new education and employment
opportunities in the technology sector
and ensuring equal access for all
communities across the country.
• Fostering partnerships to oer diverse
products and services to remove barriers
and help reduce inequalities, advance
social and economic inclusion, we
continue to focus on ways to improve
the Indigenous Housing Loan Program
which is specifically designed to address
the housing shortage within Indigenous
communities in Canada.
•
Building on our banking program designed
for Black-owned businesses, we launched
our new Black Entrepreneur Program
to drive transformational opportunities
in Canadian communities with a
commitment of $15 million in business
loans over four years (2022–2025).
Accelerating climate action
Our goal is to support clients’ climate
ambitions, encourage consumer behaviour,
and further refine our operations. Our
action plan is focused on responsibly
managing our own carbon footprint and
providing advice, products and eective
solutions that enable our clients to take
meaningful steps towards achieving their
own sustainability goals.
• Set interim targets to significantly
reduce the carbon intensity of our
financed emissions on our oil and gas
and power generation portfolios by
2030, to further the bank’s net-zero
ambition associated with operational
and financing activities by 2050.
• Furthered our progress on Carbonplace,
an international joint eort to create
an innovative voluntary carbon credit
technology platform, by expanding
the network of banks from four to nine
founding members and moving towards
commercializing the platform.
CIBC 2022 ANNUAL REPORT i

Our commitment to ESG
Our contribution
to the ecosystem
Achieving our collective sustainability ambitions
requires system-wide change through collaboration and
partnership. In addition to directly supporting our clients,
we are investing in, and partnering within, the broader
ecosystem to mobilize capital, inform policy, enable
technology and develop the next generation of leaders.
Developing
market-based solutions
Mobilizing $300 billion in
sustainable finance by 2030
(1)
Commercializing
Carbonplace to scale
voluntary carbon markets
Investing
in climate
technology
Providing $100 million
in limited partnership
investments in climate
technology and energy
transition funds
Supporting our clients’
sustainability ambitions
Helping clients align to major
energy shifts through industry
leading advice and capital
markets solutions
Partnering
with academia
Partnering with academia
to support the energy
transition, scale Canada’s
sustainable finance market
Fostering
talent
Developing future
talent to build
expertise to service
the new economy and
power the industries
of tomorrow
Contributing to policy and
framework development
Informing and supporting public-private
approaches to develop infrastructure
needed to mobilize sustainable finance
and frameworks to measure financed
emissions
(1)
Sustainable financing largely relates to client activities that support, but are not limited to, renewable and emission-free energy, energy eciency, sustainable
infrastructure, green buildings, sustainability-linked financings and green financial products. The products oered by CIBC included in our mobilization
commitment to support these client activities include loans and loan syndications, debt and equity underwritings, M&A advisory and principal investments.
ii CIBC 2022 ANNUAL REPORT

Client experience
Our clients are at the centre of what we do and
our purpose is to help make their ambitions a reality.
Our commitment to ESG
In 2022, we continued to invest in transforming our client
experience, equipping our team to help clients achieve their
goals and make it easy to bank with us.
• We welcomed more than two million Costco Mastercard
clients to CIBC and focused on ensuring they were
successfully transitioned to their new card. We also
established a new contact centre to provide tailored service,
and we survey these clients regularly along with all clients
to measure their satisfaction.
• We made it easier for clients to bank with us digitally both
in Canada and the U.S. We added new functionality on our
CIBC US mobile app that makes it fast and easy to send
money from a CIBC chequing or savings account to family
and friends, wherever they bank. In Canada, we added the
ability to check unrecognized credit card transactions online,
a CIBC Virtual Assistant for mobile banking to provide on
the go support and answers, and we were the first of the
Big 5 banks to introduce the convenience of future-dated and
recurring Interac e-Transfer payments. Our ongoing focus on
improving our clients’ online experience led to a #1 ranking
in the J.D. Power Online Banking Satisfaction Study, #1 in the
Surviscor Mobile Banking Review, and a leadership award at
the Digital Banker’s Global Digital CX Banking Awards.
• We continued to focus on providing clients with advice and
simplifying financial planning so they can focus on reaching
their goals. Since launching CIBC GoalPlanner in 2020,
400,000 financial plans have been completed through our
digital goal-setting platform, leading to significantly higher
satisfaction (net promoter score) among clients who used the
platform with the help of their financial advisor. Additionally,
we’ve expanded advice capabilities to more clients by launching
a new Associate Financial Advisor role in our banking centres,
enhanced SmartAdvice tools and resources on our website and
created a family oce oering to support the unique wealth
management needs of Canadian high-net-worth families.
• We redesigned our complaint-handling processes and
platform to improve eciency and transparency. Once
implemented, we will have actionable insights that will help
us resolve common client pain points and remove barriers.
Here’s what some of our clients had to say about our bank:
Facing unexpected debt during
the pandemic was frustrating and
stressful. Luckily Kasey was there.
He wasn’t just an advisor. He was
a friend.”
CIBC client, Chris C.
CIBC didn’t see our age…they saw
our ambition. We knew we wanted
this business, but we didn’t have
the funding. The CIBC team really
explained everything about the Black
Entrepreneur Program. Our advisor
Chancie R. was a huge help for us in
understanding how the loan fit in with
our business needs.”
CIBC clients, Chanice D. and Victoria C.
The Bernese Barista
It helps when someone believes in
you. It makes you feel like you can
achieve your dreams. My advisor
Shayla never let me dream small.”
CIBC client, Alexa A.
Auntie Aldoo’s Kitchen
CIBC 2022 ANNUAL REPORT iii
2022 revenue
by business segment
$8.91B
Canadian Personal and
Business Banking
$5.25B
Canadian Commercial
Banking and Wealth
Management
$2.46B
U.S. Commercial Banking
and Wealth Management
$5.00B
Capital Markets
Message from the
President and
Chief Executive Ocer
iv CIBC 2022 ANNUAL REPORT
Victor G. Dodig
President and Chief Executive Ocer
Today, CIBC is a bank on the rise – with a strong
foundation in place and a clear strategy focused on
our clients, as well as a track record for delivering for all
our stakeholders – through the growth of our business
and our commitment to a more sustainable future.”

In 2022, our many accomplishments demonstrated that we have
truly become the relationship-oriented bank for a modern world
that we set out to build. We see this in our strong new client
acquisition and robust top-line growth, and in the excitement and
engagement across our team every day as we live our purpose –
to help make our clients’ ambitions a reality.
Today, CIBC is a bank on the rise – with a strong foundation
in place and a clear strategy focused on our clients, as well as
a track record for delivering for all our stakeholders – through
the growth of our business and our commitment to a more
sustainable future.
At the onset of the pandemic, we were there for our clients
and stakeholders with advice, support, and an unwavering
commitment to our communities in challenging times. Across
the economy in 2022, families and businesses refocused on their
long-term ambitions but are facing a more uncertain economic
environment. Interest rates have moved higher to address rising
inflation, and economic growth is forecast to slow in the key
markets in which we operate.
As we’ve always done, we’ll be there for our clients with the right
advice and solutions to keep their long-term ambitions on track.
Doing so is core to our client-focused culture, and is driving our
strong performance.
The momentum we have established across our bank positions
us well to deliver sustainable outperformance over the long term,
through the continued execution of our client-focused strategy:
• Focusing on high-growth, high-touch segments of the market,
where we have competitive advantages and clear momentum
to deliver for clients and drive growth;
• Elevating the client experience through continued investments
in digital, empowering our clients to do more and engage
with our bank through technology, as well as enhancing the
experience for our team; and
• Building future dierentiators, areas of our business where
we are widening strategic advantages to dierentiate our
bank in important growth markets moving forward.
2022 business performance
The execution of our strategy and the positive results of our
investments were clear in our 2022 performance.
Our bank reported earnings in 2022 of $6.2 billion or $6.68
per share, or on an adjusted basis
(1)
$6.6 billion or $7.05 per
share. These results were in line with last year, mainly as a result
of more normal credit provisions, coming o a year of credit
provision releases in 2021.
Revenue of $21.8 billion was up 9%, and adjusted pre-provision,
pre-tax earnings
(1)
of $9.4 billion were up 7% from last year.
These results were driven by robust volume growth across all
businesses, a direct result of the continued execution of our
client-focused strategy and the investments we’re making in
growth, which will benefit our business in 2023 and beyond.
Building Canada’s leading retail bank
We have repositioned our Canadian Personal and Business
Banking business for growth, and delivered strong results in
2022. Through a focus on our advisory capabilities and our
leading digital oerings, we achieved our strongest net client
growth since 2017, grew our market share across deposits and
loans, and continued to earn recognition for our digital platforms
as we were ranked first by J.D. Power in online banking among
our Canadian peers.
Our emphasis on meeting the more complex financial needs of
auent Canadians – a high-touch, high-growth market for our
bank – has contributed to our growth. CIBC’s Imperial Service
oer is a structural advantage for us in this market, providing a
dedicated advisor for clients with more complex financial needs.
We’ve enhanced this oer through innovative, data-centric
digital tools including CIBC GoalPlanner – a digital platform that
our clients and our team can use to interact in establishing and
tracking a client’s personalized plan.
Victor Dodig touring a client’s shipyard in Halifax, Nova Scotia.
Our bank plays a critical role as an enabler
for the sustainability ambitions of our
clients. We have long been committed
to this role, and it is embedded in our
strategic growth plans and our approach
to doing business.
(1) This measure is a non-GAAP measure. For additional information, see the “Non-GAAP measures” section of the MD&A.
CIBC 2022 ANNUAL REPORT v

Message from the President and Chief Executive Ocer
Our acquisition of the
Costco credit card portfolio
in Canada provided more
scale in our Cards portfolio,
and presents a significant
long-term relationship
opportunity as we introduce
the more than two million
new clients who joined our
bank through the acquisition
to the value of CIBC’s
advice-based oering.
Victor Dodig speaking at CIBC’s 2022 Investor Day at CIBC SQUARE in Toronto.
vi CIBC 2022 ANNUAL REPORT
Our acquisition of the Costco credit card portfolio in Canada
provided more scale in our Cards portfolio, and presents a
significant long-term relationship opportunity as we introduce
the more than two million new clients who joined our bank
through the acquisition to the value of CIBC’s advice-based
oering. Early results from our conversations with these clients
have been very positive.
We continued to innovate and develop future dierentiators
for our business clients with the announcement of our partnership
with U.K.-based fintech Pollinate to launch Tyl by CIBC – a
cloud-based, digital-first platform for small- and medium-sized
businesses that enables safe and secure payments acceptance
and the administration of loyalty programs.
Overall, our retail business demonstrated robust growth through
a continued focus on deepening relationships with clients and
enabled by investments in technology. We carry significant
momentum into 2023.
Banking the private economy
Our unique structure of bringing our commercial banking and
wealth management businesses together in both Canada and the
U.S. positions us to be the financial advice leader in the private
economy across North America.
In Canada, we’ve built a relationship-focused commercial
bank with above-market, risk-controlled growth, and continued
to see strong demand for both loans and deposits last year.
Our Private Wealth business has a positive growth trajectory
as we’ve invested in new technology to augment our advice
oering. As just one proof point of our progress, The Globe and
Mail named over 30 CIBC Wood Gundy advisors to Canada’s
Top Wealth Advisors in 2022.
In our Asset Management business, we further incorporated an
ESG framework into all actively managed investment strategies,
and continue to rank favourably in our mutual fund net sales
compared to our peers.
In the U.S., we’ve taken a strategic and disciplined approach
with a relationship-driven mindset to build our commercial and
private wealth franchise – and it’s working. We’ve seen robust
growth year-over-year.
Across borders, we’re uniquely positioned to support individual
investors and private economy clients through an integrated
approach, investments in the right platforms and increased
connectivity across our teams. Additionally, we’re future-focused
on the new economy and are dierentiated in this area through
our growing Innovation Banking business, which continued to
expand in 2022.
Our collaborative and unique approach to our commercial and
wealth management business gives us a competitive edge in this
market that we will continue to build well into the future.

Growing our dierentiated capital
markets platform
We have built a capital markets platform with a diversified
business mix and a focus on connectivity with clients across our
bank, which produces recurring revenues to reduce the volatility
of traditional capital markets earnings. This has led to strong
relative performance over the last several years, and stands as
a unique platform among our peers.
In addition to deep relationships with clients across Canada, in
line with our strategic priorities we have doubled the revenue
from our U.S. capital markets platform over the past five
years. We will continue to capitalize on our organic growth
opportunities in the U.S. in the years to come, leveraging the
strong connectivity across our teams to meet more client needs.
Through our focus on high-growth segments of the market where
we can leverage our industry leading advice and expertise to
drive growth, we are ranked among the top 10 banks in North
America in financing for the renewable energy sector. This result
speaks to the growth in our North American capital markets
capabilities, and is a dierentiator for us in a segment of the
market that will continue to be a significant growth opportunity
in the years ahead.
The introduction and rapid growth of Canadian Depositary
Receipts, a groundbreaking innovation in the way Canadian
investors buy and hold shares of global companies, is one
example of working together across our bank to meet the
needs of our clients leveraging our capital markets platform.
Our Direct Financial Services business – a collection of digital
businesses including our Simplii Financial, Investor’s Edge, and
Alternate Solutions Group – is a dierentiator for our bank. In
2022, Simplii was ranked number one in client experience by
Ipsos, a statement on the value of our oer and the growth
potential we have in this business moving forward. We oer a
unique value proposition and we’re investing in the continued
growth of this business in the coming years.
Executive team
Victor G. Dodig
President and
Chief Executive Ocer
Shawn Beber
Senior Executive Vice-
President and Group Head,
U.S. Region; President and
CEO, CIBC Bank USA
Harry Culham
Senior Executive Vice-
President and Group Head,
Capital Markets and Direct
Financial Services
Laura Dottori-Attanasio
Senior Executive Vice-
President and Group Head,
Personal and Business
Banking, Canada
Frank Guse
Senior Executive
Vice-President and
Chief Risk Ocer
Jon Hountalas
Senior Executive Vice-
President and Group Head,
Commercial Banking and
Wealth Management,
Canada
Christina Kramer
Senior Executive Vice-
President and Group Head,
Technology, Infrastructure
and Innovation
Kikelomo Lawal
Executive Vice-President
and Chief Legal Ocer
Hratch Panossian
Senior Executive
Vice-President and
Chief Financial Ocer
Sandy Sharman
Senior Executive Vice-
President and Group Head,
People, Culture and Brand
CIBC 2022 ANNUAL REPORT vii

Message from the President and Chief Executive Ocer
Canadian Cancer Society CIBC Run for the Cure event, 2022.
Enabling a more sustainable future
Our bank plays a critical role as an enabler for the sustainability
ambitions of our clients. We have long been committed to this
role, and it is embedded in our strategic growth plans and our
approach to doing business. Our ESG strategy is focused on
accelerating climate action, building integrity and trust, and
creating access to opportunities. We made progress in all these
areas in 2022.
As part of our ambition to achieve net-zero greenhouse gas
emissions from our operational and financing activities by 2050,
we established interim targets for the reduction in emissions
intensity from our oil and gas and power generation portfolios
by 2030. Our bank is emerging as a leader in helping clients
advance their strategic objectives related to sustainability.
We work closely with traditional energy companies to invest in
producing energy responsibly, and with emerging sectors who
can help to power the future. Both are essential to advancing our
sustainability ambitions.
We are committed to an inclusive economy, and an inclusive
society. Early this year, we launched the CIBC Foundation, which
is focused on creating social and economic opportunities for
all. In its first year, the CIBC Foundation announced initiatives
such as our new partnership with Microsoft to invest in
career opportunities in technology for communities currently
underrepresented in the field. This provides an opportunity for
individuals to accelerate their career ambitions, and supports
economic growth for us all by strengthening our talent pool in
sectors of the future.
We also introduced products and programs for underserved
communities in banking – including a new banking program
launched last year designed specifically for Black-owned
businesses. Early response has been strong and we’re looking
forward to furthering our progress here in the year ahead. We
also continue to be leaders in gender balance – we were recently
named to The Globe and Mail’s Women Lead Here benchmark
for executive gender diversity.
This year marked the return of the Canadian Cancer Society
CIBC Run for the Cure as an in-person event, raising $13 million
for a cause that is close to the hearts of so many across our team.
Investing in our team
Our connected culture is a dierentiator for our bank, and our
team is the foundation for the momentum we’ve established
across our business. I want to thank our remarkable team who
live our purpose every day.
We believe that investing in our team is also an investment
in our growth potential. In 2022, we enhanced our health and
benefits program, including by increasing income replacement
benefits during child care leave, mental health services, gender
armation care, fertility treatments and access to registered
dieticians. In addition, we furthered our focus on wellbeing
by actively discussing topics including mental health, physical
health, and work-life balance with leaders and across our
team. These conversations are vital to advancing a culture
that enables our team members to be at their best for our
clients and our stakeholders every day. In addition, we launched
YourPulse@CIBC, a new global health and wellbeing platform
which enables employees to set wellness goals and engage
in individual and group challenges to encourage positive
wellbeing behaviours.
We also increased our base salary for a number of employees in
2022, and committed to further increasing our minimum entry
wage in Canada and the U.S. to $25 per hour by 2025.
In 2022, we completed our move into the first tower of CIBC
SQUARE, which is now home to over 13,000 team members in
Toronto, collaborating to meet the needs of our clients.
As a result of these and other investments, our employee
engagement scores rank us among high-performing organizations
across all industries – an advantage that shows in the dedication
and commitment of our entire team every day.
Closing
CIBC is a relationship-oriented bank for a modern world.
We enter 2023 with the confidence that our bank is well
positioned for another year of success, with the strength to
weather any challenges and to capitalize on growth opportunities
across the spectrum. We have clear momentum, and a client-
focused strategy that leverages our advantages in the market to
deliver more for our clients and create value for our stakeholders.
Victor G. Dodig
President and Chief Executive Ocer
viii
CIBC 2022 ANNUAL REPORT

Message from the
Chair of the Board
2022 marked a year of continued
momentum across CIBC. As geopolitical
and economic factors created greater
uncertainty, CIBC’s purpose-led culture and
client-focused strategy guided the eorts
of the entire team and created value for all
of our stakeholders.”
CIBC’s strong momentum was highlighted at an Investor Day
in June of this year, and the Board is in full support of the
strategy, priorities and investments outlined for the path forward.
Your Board actively monitors the execution of the bank’s strategic
investments and the relative performance of the business.
We continued to oversee the bank’s talent strategy to ensure
a strong and diverse talent pipeline. CIBC appointed a number
of senior leaders into new roles to further build their experience
and capabilities in key business and functional roles.
Your Board is committed to making continued progress
on environmental, social and governance matters, further
embedding ESG into our strategy and operations. Positive
developments this year include setting 2030 interim financed
emissions targets for greenhouse gases for several portfolios.
Importantly, executive compensation, as well as compensation
for the majority of team members, continues to be tied to ESG
performance, including climate targets. In addition, the Board
remains well informed on the evolving ESG landscape through
our regular director development program.
Fostering an inclusive team and advocating for an inclusive
economy are priorities for CIBC. Your 2022 Board, comprised of
directors with diverse experience, backgrounds and geographical
representation, remained gender-balanced for a second year, and
includes directors who identify as people of colour and a member
of the LGBTQ+ community.
Two new directors joined your Board this year. Ammar Aljoundi,
President and CEO of Agnico Eagle Mines Limited, brings deep
experience in business strategy, capital markets and banking.
Bill Morneau, formerly Canada’s Minister of Finance, brings
strategic insight and breadth of leadership across the public and
private sectors, as well as strong international expertise. I’d like
to warmly welcome Ammar and Bill to CIBC’s Board of Directors.
Patrick D. Daniel retired from your Board this year. On behalf of
CIBC’s shareholders and fellow board members, I’d like to thank
Pat for his important contributions over the last 13 years.
We remain optimistic about the future, and confident that the
momentum established in 2022 will continue to move CIBC
forward. I would like to thank our President and CEO, Victor
Dodig and our management team for their continued leadership,
and recognize the 50,000 team members who live CIBC’s
purpose every day.
Katharine B. Stevenson
Chair of the Board
CIBC 2022 ANNUAL REPORT ix

Enhanced Disclosure Task Force
The Enhanced Disclosure Task Force (EDTF), established by the Financial Stability Board, released its report “Enhancing the Risk Disclosures of
Banks” in 2012, which included thirty-two disclosure recommendations. The index below provides the listing of these disclosures, along with their
locations. EDTF disclosures are located in our management’s discussion and analysis, consolidated financial statements, and supplementary
packages, which may be found on our website (www.cibc.com). No information on CIBC’s website, including the supplementary packages, should
be considered incorporated herein by reference.
Topics Recommendations Disclosures
Management’s
discussion
and analysis
Consolidated
financial
statements
Pillar 3 Report and
Supplementary
regulatory
capital disclosure
Page references
General 1 Index of risk information – current page
2 Risk terminology and measures 104 71–73
3 Top and emerging risks 55
4 Key future regulatory ratio requirements 40, 43, 78, 79 170–171 9, 16
Risk
governance,
risk
management
and business
model
5 Risk management structure 48, 49
6 Risk culture and appetite 47, 50, 52
7 Risks arising from business activities 53, 58
8 Bank-wide stress testing 35–36, 54, 62, 67,
74, 76
Capital
adequacy
and risk-
weighted
assets
9 Minimum capital requirements 35–36 170–171
10 Components of capital and
reconciliation to the consolidated
regulatory balance sheet
40 8–11
11 Regulatory capital flow statement
41 12
12 Capital management and planning 43 170–171
13 Business activities and risk-weighted
assets
42, 58 4
14 Risk-weighted assets and capital
requirements
38, 42
4
15 Credit risk by major portfolios 60–65 27–36
16 Risk-weighted assets flow statement 42 4, 5
17 Back-testing of models 54, 62, 72 69, 70
Liquidity 18 Liquid assets 77
Funding 19 Encumbered assets
77
20 Contractual maturity of assets, liabilities
and off-balance sheet instruments
81
21 Funding strategy and sources 80
Market risk 22 Reconciliation of trading and
non-trading portfolios to the
consolidated balance sheet
71
23
Significant trading and non-trading
market risk factors
71–75
24 Model assumptions, limitations and
validation procedures
71–75
25 Stress testing and scenario analysis 35, 74
Credit risk 26 Analysis of credit risk exposures 63–69 143–150, 189 6–7, 65–68
27 Impaired loan and forbearance
techniques
60, 68, 88 123
28 Reconciliation of impaired loans and the
allowance for credit losses
68 144
29 Counterparty credit risk arising from
derivatives
60, 64 159–160 68, 35
(1)
30 Credit risk mitigation 60 159–160 20, 27–36, 39–40,
46–50, 53, 68
Other risks 31 Other risks 82–86
32 Discussion of publicly known risk
events
82 182
(1) Included in supplementary financial information package.
x CIBC 2022 ANNUAL REPORT

Management’s discussion and analysis
Management’s discussion and analysis
Management’s discussion and analysis (MD&A) is provided to enable readers to assess CIBC’s financial condition and results of operations as at and
for the year ended October 31, 2022, compared with prior years. The MD&A should be read in conjunction with the audited consolidated financial
statements. Unless otherwise indicated, all financial information in this MD&A has been prepared in accordance with International Financial Reporting
Standards (IFRS or GAAP) and all amounts are expressed in Canadian dollars. Certain disclosures in the MD&A have been shaded as they form an
integral part of the consolidated financial statements. The MD&A is current as of November 30, 2022. Additional information relating to CIBC, including
the Annual Information Form, is available on SEDAR at www.sedar.com and on the United States (U.S.) Securities and Exchange Commission’s (SEC)
website at www.sec.gov. No information on CIBC’s website (www.cibc.com) should be considered incorporated herein by reference. A glossary of
terms used in the MD&A and the audited consolidated financial statements is provided on pages 101 to 107 of this Annual Report.
2 Overview
2 Our strategy
2 Performance against
objectives
4 Financial highlights
5 Economic and market
environment
5 Year in review – 2022
5 Outlook for calendar year
2023
6 Significant events
7 Financial performance
overview
7 2022 Financial results review
7 Net interest income and
margin
8 Non-interest income
8 Trading revenue (TEB)
9 Provision for credit
losses
9 Non-interest expenses
10 Taxes
10 Foreign exchange
11 Fourth quarter review
11 Quarterly trend analysis
12 Review of 2021 financial
performance
14 Non-GAAP measures
21 Strategic business units
overview
22 Canadian Personal and
Business Banking
24 Canadian Commercial Banking
and Wealth Management
27 U.S.
Commercial Banking
and Wealth Management
30 Capital Markets
33 Corporate and Other
34 Financial condition
34 Review of condensed
consolidated balance sheet
35 Capital management
45 Off-balance sheet
arrangements
47 Management
of risk
87 Accounting and control
matters
87 Critical
accounting policies
and estimates
91 Accounting developments
92 Other regulatory developments
93 Related-party transactions
94 Policy on the Scope of
Services of the
Shareholders’
Auditor
94 Controls and procedures
95 Supplementary annual
financial information
101 Glossary
A NOTE ABOUT FORWARD-LOOKING STATEMENTS: From time to time, we make written or oral forward-looking statements within the meaning of certain securities
laws, including in this Annual Report, in other filings with Canadian securities regulators or the SEC and in other communications. All such statements are made pursuant
to the “safe harbour” provisions of, and are intended to be forward-looking statements under applicable Canadian and U.S. securities legislation, including the U.S. Private
Securities Litigation Reform Act of 1995. These statements include, but are not limited to, statements made in the “Message from the President and Chief Executive
Officer”, “Overview – Performance against objectives”, “Economic and market environment – Outlook for calendar year 2023”, “Significant events”, “Financial performance
overview – Taxes”, “Strategic business units overview – Canadian Personal and Business Banking”, “Strategic business units overview – Canadian Commercial Banking
and Wealth Management”, “Strategic business units overview – U.S. Commercial Banking and Wealth Management”, “Strategic business units overview – Capital
Markets”, “Financial condition – Capital management”, “Financial condition – Off-balance sheet arrangements”, “Management of risk – Risk overview”, “Management of
risk – Top and emerging risks”, “Management of risk – Credit risk”, “Management of risk – Market risk”, “Management of risk – Liquidity risk”, “Accounting and control
matters – Critical accounting policies and estimates”, “Accounting and control matters – Accounting developments”, “Accounting and control matters – Other regulatory
developments” and “Accounting and control matters – Controls and procedures” sections of this report and other statements about our operations, business lines,
financial condition, risk management, priorities, targets and commitments (including with respect to net-zero emissions), ongoing objectives, strategies, the regulatory
environment in which we operate and outlook for calendar year 2023 and subsequent periods. Forward-looking statements are typically identified by the words “believe”,
“expect”, “anticipate”, “intend”, “estimate”, “forecast”, “target”, “objective” and other similar expressions or future or conditional verbs such as “will”, “should”, “would” and
“could”. By their nature, these statements require us to make assumptions, including the economic assumptions set out in the “Economic and market environment –
Outlook for calendar year 2023” section of this report, and are subject to inherent risks and uncertainties that may be general or specific. Given the continuing impact of
high inflation, rising interest rates and the war in Ukraine on the global economy, financial markets, and our business, results of operations, reputation and financial
condition, there is inherently more uncertainty associated with our assumptions as compared to prior periods. A variety of factors, many of which are beyond our control,
affect our operations, performance and results, and could cause actual results to differ materially from the expectations expressed in any of our forward-looking
statements. These factors include: inflationary pressures; global supply-chain disruptions; geopolitical risk, including from the war in Ukraine, the occurrence, continuance
or intensification of public health emergencies, such as the COVID-19 pandemic, and any related government policies and actions; credit, market, liquidity, strategic,
insurance, operational, reputation, conduct and legal, regulatory and environmental risk; currency value and interest rate fluctuations, including as a result of market and
oil price volatility; the effectiveness and adequacy of our risk management and valuation models and processes; legislative or regulatory developments in the jurisdictions
where we operate, including the Organisation for Economic Co-operation and Development Common Reporting Standard, and regulatory reforms in the United Kingdom
and Europe, the Basel Committee on Banking Supervision’s global standards for capital and liquidity reform, and those relating to bank recapitalization legislation and the
payments system in Canada; amendments to, and interpretations of, risk-based capital guidelines and reporting instructions, and interest rate and liquidity regulatory
guidance; the resolution of legal and regulatory proceedings and related matters; the effect of changes to accounting standards, rules and interpretations; changes in our
estimates of reserves and allowances; changes in tax laws; changes to our credit ratings; political conditions and developments, including changes relating to economic
or trade matters; the possible effect on our business of international conflicts, such as the war in Ukraine, and terrorism; natural disasters, disruptions to public
infrastructure and other catastrophic events; reliance on third parties to provide components of our business infrastructure; potential disruptions to our information
technology systems and services; increasing cyber security risks which may include theft or disclosure of assets, unauthorized access to sensitive information, or
operational disruption; social media risk; losses incurred as a result of internal or external fraud; anti-money laundering; the accuracy and completeness of information
provided to us concerning clients and counterparties; the failure of third parties to comply with their obligations to us and our affiliates or associates; intensifying
competition from established competitors and new entrants in the financial services industry including through internet and mobile banking; technological change; global
capital market activity; changes in monetary and economic policy; general business and economic conditions worldwide, as well as in Canada, the U.S. and other
countries where we have operations, including increasing Canadian household debt levels and global credit risks; climate change and other environmental and social
risks; our success in developing and introducing new products and services, expanding existing distribution channels, developing new distribution channels and realizing
increased revenue from these channels; changes in client spending and saving habits; our ability to attract and retain key employees and executives; our ability to
successfully execute our strategies and complete and integrate acquisitions and joint ventures; the risk that expected benefits of an acquisition, merger or divestiture will
not be realized within the expected time frame or at all; and our ability to anticipate and manage the risks associated with these factors. This list is not exhaustive of the
factors that may affect any of our forward-looking statements. These and other factors should be considered carefully and readers should not place undue reliance on our
forward-looking statements. Any forward-looking statements contained in this report represent the views of management only as of the date hereof and are presented for
the purpose of assisting our shareholders and financial analysts in understanding our financial position, objectives and priorities and anticipated financial performance as
at and for the periods ended on the dates presented, and may not be appropriate for other purposes. We do not undertake to update any forward-looking statement that is
contained in this report or in other communications except as required by law.
CIBC 2022 ANNUAL REPORT 1

Management’s discussion and analysis
Overview
CIBC is a leading and well-diversified North American financial institution committed to creating enduring value for all our stakeholders – our clients,
team, communities and shareholders. We are guided by our purpose – to help make your ambition a reality, and we are activating our resources to
create positive change and contribute to a more secure, equitable and sustainable future.
Across our bank and our businesses – Personal and Business Banking, Commercial Banking and Wealth Management, and Capital Markets –
our 50,000 employees bring our purpose to life
every day for our 13 million personal banking, business, public sector and institutional clients in
Canada, the U.S. and around the world.
Our strategy
In 2022, our modern, relationship-oriented bank continued to focus on delivering superior client experience and top-tier shareholder returns while
maintaining our financial strength, risk discipline and advancing our purpose-driven culture. Going forward, the execution of our client-focused
strategy will enable us to continue driving long-term growth, and to build on our momentum as we focus on three strategic priorities:
• Further growing our market share of high-growth, high-touch client segments;
• Elevating the CIBC banking experience for all our clients through investments in digitization and technology, and further increasing
connectivity across our businesses; and
• Investing in our future differentiator businesses that are positioned to win in faster growing markets.
Performance against objectives
CIBC reports a scorecard of financial measures that we use to evaluate and report on our progress to external stakeholders. These measures can
be categorized into four key areas – earnings growth, operating leverage, profitability, and balance sheet strength. We have set through the cycle
targets for each of these measures, which we currently define as three to five years, assuming a normal business environment and credit cycle. Our
ability to achieve these objectives may be adversely affected by extraordinary developments and disruptions.
Throughout 2022, economic challenges driven by geopolitical and persistent supply-chain issues had an impact on our ability to achieve
certain performance objectives.
Earnings growth
To assess our earnings growth, we monitor our earnings per share
(EPS
(1)
). Our target of 5% to 10% growth reflects a simple average of
annual adjusted
(2)
diluted EPS
(1)
. In 2022, against a backdrop of a
challenging economic environment, our year-over-year reported and
adjusted
(2)
diluted EPS
(1)
decreased by 4% and 2%, respectively. Our
3-year compound annual growth rates (CAGR)
(3)
for reported and
adjusted
(2)
diluted EPS
(1)
were 6.1% and 5.8%, respectively, and our
5-year CAGR
(3)
for reported and adjusted
(2)
diluted EPS
(1)
were 3.5% and
4.9%, respectively.
Going forward, we have increased our target to deliver adjusted
(2)
diluted
EPS
(1)
CAGR of 7% to 10% through the cycle.
Reported diluted EPS
(1)
($)
2018 19
5.82
6.96
6.68
5.60
21 22
4.11
Adjusted diluted EPS
(1)(2)
($)
20 2118 19
6.11
5.96
7.23
7.05
22
4.85
Operating leverage
Operating leverage, defined as the difference between the year-over-
year percentage change in revenue and year-over-year percentage
change in non-interest expenses, is a measure of the relative growth
rates of revenue and expenses. In 2022, both our reported and
adjusted
(2)
operating leverage was (1.9)%, compared with 5.3% and
0.7%, respectively in 2021. Our 3-year simple average reported and
adjusted
(2)
operating leverage was (0.2)% and (0.6)%, respectively, and
our 5-year simple average reported and adjusted
(2)
operating leverage
was 0.1% and 0.5%, respectively.
Going forward, we will continue to target positive adjusted
(2)
operating
leverage through the cycle.
Reported operating
leverage
(%)
21201918 22
2.4
(1.9)
5.3
(1.5)
(4.0)
Adjusted operating
leverage
(2)
(%)
21201918 22
3.2
(1.9)
(0.6)
0.2
0.7
(1) On April 7, 2022, CIBC shareholders approved a two-for-one share split (Share Split) of CIBC’s issued and outstanding common shares. Each shareholder of record at the
close of business on May 6, 2022 (Record Date) received one additional share on May 13, 2022 (Payment Date) for every one share held on the Record Date. All common
share numbers and per common share amounts have been adjusted to reflect the Share Split as if it was retroactively applied to all periods presented.
(2) Adjusted measures are non-GAAP measures. For additional information, see the “Non-GAAP measures” section.
(3) The 3-year compound annual growth rate (CAGR) is calculated from 2019 to 2022 and the 5-year CAGR is calculated from 2017 to 2022.
2 CIBC 2022 ANNUAL REPORT

Management’s discussion and analysis
Profitability
We have three metrics to measure profitability, including two shareholder
value targets:
1.
Return on common shareholders’ equity (ROE)
ROE, defined as the ratio of net income to average
(2)
common shareholders’
equity, is a key measure of profitability. In 2022, our reported and
adjusted
(1)
ROE were at 14.0% and 14.7%, respectively, compared with
16.1% and 16.7%, respectively, in 2021 and below our 2022 target of at
least 15%. On a 3-year average basis, our reported and adjusted
(1)
ROE
were 13.4% and 14.4%, respectively. On a 5-year average basis, our
reported and adjusted
(1)
ROE were 14.2% and 15.2%, respectively.
Going forward, we have increased our adjusted
(1)
ROE target from at
least 15% to at least 16% through the cycle by 2025.
Reported return on
common
shareholders’ equity
(%)
18
16.6
14.
14.0
22
20
10.0
19
5
16.1
21
Adjusted return on
common
shareholders’ equity
(1)
(%)
2119 2018
17.4
14.7
22
15.4
11.7
16.7
2. Dividend payout ratio
Dividend payout ratio is defined as the ratio of common share dividends
paid as a percentage of net income after preferred share dividends,
premium on preferred share redemptions, and distributions on other equity
instruments. Key criteria for considering dividend increases are our current
level of payout relative to our target and our view on the sustainability of our
current earnings level. In 2022, our reported and adjusted
(1)
dividend
payout ratios were 48.8% and 46.3%, respectively, compared with 41.8%
and 40.3%, respectively, in 2021. On a 3-year average basis, our reported
and adjusted
(1)
dividend payout ratios were 53.8% and 48.9%, respectively.
On a 5-year average basis, our reported and adjusted
(1)
dividend payout
ratios were 51.3% and 47.4%, respectively.
Going forward, we will continue to target an adjusted
(1)
dividend payout
ratio of 40% to 50% through the cycle.
Reported dividend
payout ratio
(3)
(%)
201918
70.7
22
45.5
41.8
49.9
48.8
21
Adjusted dividend
payout ratio
(1)(3)
(%)
21201918
60.0
22
43.4
40.3
46.9
46.3
3. Total shareholder return (TSR)
TSR is the ultimate measure of shareholder value, and the output of
delivering against the financial targets within our control. We have an
objective to deliver a TSR that exceeds the industry average, which we
have defined as the Standard & Poor’s (S&P)/Toronto Stock Exchange
(TSX) Composite Banks Index, over a rolling five-year period. For the
three years ended October 31, 2022, our TSR was 28.5%, in line with the
S&P/TSX Composite Banks Index of 29.0%. For the five years ended
October 31, 2022, our TSR was 40.2% (2021: 91.9%), which was in line
with the S&P/TSX Composite Banks Index return over the same period of
40.6%.
Rolling three-year TSR
(%)
Oct-22
75
.9%
Jul-22Apr-22Jan-22Oct-21
CIBC 28.5%
S&P/TSX Composite Index 28.9%
S&P/TSX Composite Banks Index 28
0
25
50
Rolling five-year TSR
(%)
Oct-22
125
.6%
Jul-22Apr-22Jan-22Oct-21
CIBC 40.2%
S&P/TSX Composite Index 41.1%
S&P/TSX Composite Banks Index 40
0
25
50
75
100
Balance sheet strength
Maintaining a strong balance sheet is foundational to our long-term success. Our goal is to maintain strong
capital and liquidity positions. We look to constantly balance our objectives of holding a prudent amount of
excess capital for unexpected events and environmental uncertainties, investing in our core businesses,
growing through acquisitions and returning capital to our shareholders.
1.
Common Equity Tier 1 (CET1) ratio
We actively manage our capital to maintain a strong and efficient capital base while supporting our business
growth and returning capital to
our shareholders. For the year ended October 31, 2022, our CET1
(4)
ratio was
11.7%, compared with 12.4% in 2021, well above the current regulatory requirement set by OSFI.
Going forward, we will continue to maintain a strong buffer to regulatory requirements.
CET1 ratio
(3)
(%)
2
1.4
2.
Liquidity coverage ratio (LCR)
Our ability to meet our financial obligations is measured through the LCR ratio. It measures unencumbered
high-quality liquid assets (HQLA) that can be converted into cash to meet liquidity needs in a 30-calendar-
day liquidity stress scenario. The LCR standard requires that, absent a situation of financial stress, the value
of the ratio be no lower than 100%.
For the quarter ended October 31, 2022, our three-month daily average LCR
(4)
was 129% compared to 127%
for the same period last year.
18 19 20 221
1
11.6
12.1
12.4
11.7
Liquidity coverage ratio
(%)
22
128
21
125
145
127
129
201918
(1) Adjusted measures are non-GAAP measures. For additional information, see the “Non-GAAP measures” section.
(2) Average balances are calculated as a weighted average of daily closing balances.
(3) In response to the COVID-19 pandemic, effective March 2020, the Office of the Superintendent of Financial Institutions (OSFI) directed that all federally regulated financial
institutions (FRFIs) halt share buybacks and dividend increases until further notice. The temporary measure was lifted effective November 4, 2021.
(4) CET1 is calculated pursuant to OSFI’s Capital Adequacy Requirements (CAR) Guideline and LCR is calculated pursuant to OSFI’s Liquidity Adequacy Requirements (LAR)
Guideline, which are both based on Basel Committee on Banking Supervision (BCBS) standards.
CIBC 2022 ANNUAL REPORT 3

Management’s discussion and analysis
Financial highlights
As at or for the year ended October 31 2022 2021 2020 2019 2018
Financial results ($ millions)
Net interest income $ 12,641 $ 11,459 $ 11,044 $ 10,551 $ 10,065
Non-interest income 9,192 8,556 7,697 8,060 7,769
Total revenue 21,833 20,015 18,741 18,611 17,834
Provision for credit losses 1,057 158 2,489 1,286 870
Non-interest expenses 12,803 11,535 11,362 10,856 10,258
Income before income taxes 7,973 8,322 4,890 6,469 6,706
Income taxes 1,730 1,876 1,098 1,348 1,422
Net income $ 6,243 $ 6,446 $ 3,792 $ 5,121 $ 5,284
Net income attributable to non-controlling interests 23 17 2 25 17
Preferred shareholders and other equity instrument holders 171 158 122 111 89
Common shareholders 6,049 6,271 3,668 4,985 5,178
Net income attributable to equity shareholders $ 6,220 $ 6,429 $ 3,790 $ 5,096 $ 5,267
Financial measures
Reported efficiency ratio
(1)
58.6 % 57.6 % 60.6 % 58.3 % 57.5 %
Reported operating leverage
(1)
(1.9)% 5.3 % (4.0)% (1.5)% 2.4 %
Loan loss ratio
(2)
0.14 % 0.16 % 0.26 % 0.29 % 0.26 %
Reported return on common shareholders’ equity
(1)
14.0 % 16.1 % 10.0 % 14.5 % 16.6 %
Net interest margin
(1)
1.40 % 1.42 % 1.50 % 1.65 % 1.68 %
Net interest margin on average interest-earning assets
(1)(3)
1.58 % 1.59 % 1.69 % 1.84 % 1.88 %
Return on average assets
(1)(3)
0.69 % 0.80 % 0.52 % 0.80 % 0.88 %
Return on average interest-earning assets
(1)(3)
0.78 % 0.89 % 0.58 % 0.89 % 0.99 %
Reported effective tax rate 21.7 % 22.5 % 22.5 % 20.8 % 21.2 %
Common share information
Per share ($)
(4)
– basic earnings $ 6.70 $ 6.98 $ 4.12 $ 5.61 $ 5.84
– reported diluted earning 6.68 6.96 4.11 5.60 5.82
– dividends 3.270 2.920 2.910 2.800 2.660
– book value
(5)
49.95 45.83 42.03 39.94 36.92
Closing share price ($)
(4)
61.87 75.09 49.69 56.16 56.84
Shares outstanding (thousands)
(4)
– weighted-average basic 903,312 897,906 890,870 888,648 886,163
– weighted-average dilute 905,684 900,365 892,042 890,915 889,254
– end of period 906,040 901,656 894,171 890,683 885,653
Market capitalization ($ millions) $ 56,057 $ 67,701 $ 44,431 $ 50,016 $ 50,341
Value measures
Total shareholder return (13.56)% 58.03 % (5.90)% 4.19 % 4.70 %
Dividend yield (based on closing share price) 5.3 % 3.9 % 5.9 % 5.0 % 4.7 %
Reported dividend payout ratio
(1)
48.8 % 41.8 % 70.7 % 49.9 % 45.5 %
Market value to book value ratio 1.24 1.64 1.18 1.41 1.54
Selected financial measures – adjusted
(6)
Adjusted efficiency ratio
(7)
56.4 % 55.4 % 55.8 % 55.5 % 55.6 %
Adjusted operating leverage
(7)
(1.9)% 0.7 % (0.6)% 0.2 % 3.2 %
Adjusted return on common shareholders’ equity 14.7 % 16.7 % 11.7 % 15.4 % 17.4 %
Adjusted effective tax rate 21.9 % 22.7 % 21.8 % 20.6 % 20.0 %
Adjusted diluted earnings per share ($)
(4)
$ 7.05 $ 7.23 $ 4.85 $ 5.96 $ 6.11
Adjusted dividend payout ratio 46.3 % 40.3 % 60.0 % 46.9 % 43.4 %
On- and off-balance sheet information ($ millions)
Cash, deposits with banks and securities $ 239,740 $ 218,398 $ 211,564 $ 138,669 $ 119,355
Loans and acceptances, net of allowance for credit losses 528,657 462,879 416,388 398,108 381,661
Total assets 943,597 837,683 769,551 651,604 597,099
Deposits 697,572 621,158 570,740 485,712 461,015
Common shareholders’ equity
(1)
45,258 41,323 37,579 35,569 32,693
Average assets
(3)
900,213 809,621 735,492 639,716 598,441
Average interest-earning assets
(1)(3)
799,224 721,686 654,142 572,677 536,059
Average common shareholders’ equity
(1)(3)
43,354 38,881 36,792 34,467 31,184
Assets under administration (AUA)
(1)(8)(9)
2,854,828 ,963,221 2,364,005
(8)
2,423,240
(8)
2,303,962
Assets under management (AUM)
(1)(9)
291,513 316,834 261,037
(8)
249,596
(8)
225,379
Balance sheet quality (All-in basis) and liquidity measures
(10)
Risk-weighted assets (RWA) ($ millions)
Total RWA $ 315,634 $ 272,814 $ 254,871 $ 239,863 n/a
CET1 capital RWA n/a n/a n/a n/a $ 216,144
Tier 1 capital RWA n/a n/a n/a n/a 216,303
Total capital RWA n/a n/a n/a n/a 216,462
Capital ratios
CET1 ratio
(11)
11.7 % 12.4 % 12.1 % 11.6 % 11.4 %
Tier 1 capital ratio
(11)
13.3 % 14.1 % 13.6 % 12.9 % 12.9 %
Total capital ratio
(11)
15.3 % 16.2 % 16.1 % 15.0 % 14.9 %
Leverage ratio 4.4 % 4.7 % 4.7 % 4.3 % 4.3 %
LCR
(12)
129 % 127 % 145 % 125 % 128 %
Net stable funding ratio (NSFR) 118 % 118 % n/a n/a n/a
Other information
Full-time equivalent employees 50,427 45,282 43,853 45,157 44,220
s
d
2
(1) For additional
information
on the composition, see the “Glossary”
section.
(2) The ratio is calculated as the provision for credit losses on impaired loans to average loans and acceptances, net of allowance for credit losses.
(3) Average balances are calculated as a weighted average of daily closing balances.
(4) On April 7, 2022, CIBC shareholders approved a two-for-one share split (Share Split) of CIBC’s issued and outstanding common shares. Each shareholder of record at the close
of business on May 6, 2022 (Record Date) received one additional share on May 13, 2022 (Payment Date) for every one share held on the Record Date. All common share
numbers and per common share amounts have been adjusted to reflect the Share Split as if it was retroactively applied to all periods presented.
(5) Common shareholders’ equity divided by the number of common shares issued and outstanding at end of period.
(6) Adjusted measures are non-GAAP measures. Adjusted measures are calculated in the same manner as reported measures, except that financial information included in the
calculation of adjusted measures is adjusted to exclude the impact of items of note. For additional information and a reconciliation of reported results to adjusted results, see the
“Non-GAAP measures” section.
(7) Calculated on a taxable equivalent basis (TEB).
(8) Includes the full contract amount of AUA or custody under a 50/50 joint venture between CIBC and The Bank of New York Mellon of $2,258.1 billion as at October 31, 2022 (2021:
$2,341.1 billion).
(9) AUM amounts are included in the amounts reported under AUA.
(10) RWA and our capital ratios are calculated pursuant to OSFI’s CAR Guideline, the leverage ratio is calculated pursuant to OSFI’s Leverage Requirements Guideline, and LCR and
NSFR are calculated pursuant to OSFI’s LAR Guideline, all of which are based on BCBS standards. For additional information, see the “Capital management” and “Liquidity risk”
sections.
(11) Ratios reflect the expected credit loss (ECL) transitional arrangement announced by OSFI on March 27, 2020 in response to the onset of the COVID-19 pandemic.
(12) Average for the three months ended October 31 for each respective year.
n/a Not applicable.
CIBC 2022 ANNUAL REPORT 4

Management’s discussion and analysis
Economic and market environment
Year in review – 2022
Canada’s economy registered healthy growth through the first half of 2022, but then joined the U.S. in showing signs of a deceleration in the second
half of 2022 in the face of higher interest rates aimed at reducing inflation. Canada’s growth benefitted from strength in consumer spending as
public health constraints were further eased, funded by income gains from a strong jobs market and prior savings, while nominal exports increased
as commodity prices peaked in the first half of the year. Rising interest rates in the latter half of the year caused mortgage demand to decelerate
from the very high growth rates in place early in the year as higher interest rates slowed transactions volumes and eased house prices, while wider
corporate bond spreads negatively impacted margins. Non-mortgage household credit demand picked up with greater discretionary services
spending. Business loan demand remained healthy in both Canada and the U.S., reflecting inflation’s impact on nominal measures of economic
activity and wider spreads in the corporate bond market. Financial markets saw healthy merger and acquisition (M&A) volumes but a softer
backdrop for CIBC wealth businesses and equity issuance, particularly in the latter half of the year, as market conditions weakened in the face of
the economic shocks from the war in Ukraine, monetary tightening, and prospects for slower growth ahead. Deposit growth in Canada decelerated
close to historical norms after being elevated earlier in the pandemic, with a shift towards term deposits as interest rates climbed.
Outlook for calendar year 2023
Global economic growth looks to be weak in 2023 in response to monetary policy tightening, as central banks attempt to ease demand and thereby
bring inflation back to target levels. The eurozone and the United Kingdom (U.K.) are likely to see recessions as higher interest rates hit a region
already vulnerable due to the spillover impacts from the war in Ukraine. China’s economy could see some improvement after a year beset with
lockdowns, but weakness in its property sector and softer export markets will see another year of below-average growth. The global slowdown will
result in most commodity prices at lower average levels in 2023 than in 2022, although geopolitical risks to supply remain a risk for renewed upward
pressure. Supply chains could see some improvements from the easing in demand pressures and a further lessening in COVID-19 severity as
vaccinations and prior infections reduce the severity of new cases.
In Canada, the Bank of Canada is expected to increase overnight rates to 4.25% and maintain them at elevated levels through calendar 2023,
thereby slowing demand to allow inflation to end next year near its 2% target. Weaker economic growth, improvements in supply chains, and softer
average prices for food and energy will be key to getting inflation back to that target. Real gross domestic product (GDP) growth is expected to
decelerate to 0.6% from an expected growth rate of roughly 3.5% in 2022, with a softening in housing and consumer spending in response to higher
interest rates and a gradual climb in the unemployment rate to nearly 6% by the end of calendar 2023, up from an average of 5.3% in 2022. Long-
term interest rates in both the U.S. and Canada could end 2023 at lower levels as the market starts to price-in a modest easing in central bank
policy rates in 2024, and gains confidence that inflation will be under control.
In the U.S., the effort to contain inflation is likely to see the Federal Reserve take overnight rates just under 5% by early 2023, leaving them at
that level through the remainder of the year. The resulting drag on housing and interest sensitive consumption is expected to hold real GDP growth
to 0.7% in 2023, down from roughly 2% in 2022. That should see the unemployment rate climb from an average of 3.7% in 2022 to 4.2% by the end
of 2023, allowing wage inflation to decelerate.
A softer pace for economic growth is likely to have broad implications across many of our strategic business units (SBUs). Rising
unemployment and higher interest rates are likely to see a moderate decrease in business and household credit quality from very strong levels
achieved in 2022. Deposit growth will be contained, as quantitative tightening will require bonds currently held by the central bank to be financed in
the public markets, with higher rates resulting in greater growth in term deposits relative to short-term deposits. While the rising interest rate
environment is starting to level off, we expect a modestly positive impact on the net interest margins for all our SBUs, but the high interest rates may
have implications for credit quality in 2023 as economic growth slows in response to monetary tightening.
For Canadian Personal and Business Banking, mortgage growth is expected to further decelerate on softer home sales volumes and average
house prices tied to the increase in interest rates. Although year-over-year non-mortgage consumer credit demand will be supported by additional
volume gains in spending on services, lower inflation will feed into slower growth in dollar terms. Business lending is expected to register healthy
growth, but is also likely to decelerate from the strong pace seen in 2022.
Volatility in asset markets has prompted investors to seek greater diversification in their portfolios, which could dampen the growth prospects
of our Canadian and U.S. wealth management businesses in the near term.
Our Capital Markets business is expected to benefit from continued strength in merger and acquisition activity as corporate consolidations
continue, while corporate bond issuance could pick up as longer term rates ease over the course of 2023. Loan demand growth in our Canadian
and U.S. commercial banking businesses is expected to decelerate with softer economic growth and a slowing in multi-unit residential construction.
The economic outlook described above reflects numerous assumptions regarding the economic impact of recent and expected increases in interest
rates, the easing of supply chain and inflationary pressures, the COVID-19 pandemic as well as the global economic risks emanating from the war in
Ukraine. The measures taken by central banks to combat inflation could have a larger than expected impact on economic growth. Expectations for
the pandemic reflect currently available information and are subject to change as new information on epidemiology and government health
measures becomes available. The war in Ukraine could escalate into a broader conflict or result in a deeper cut in food and energy output that
would add to pressures on inflation and global growth. As a result, actual experience may differ materially from expectations.
Our financial condition and our regulatory capital and liquidity positions continue to be strong, however, the downside risk to the economic outlook
described above may result in us taking a more conservative approach to capital management. See the “Capital management” and “Liquidity risk”
sections for further details. The impact of the increase in interest rates, the pandemic and the war in Ukraine on our risk environment are discussed
in the “Top and emerging risks” section. Changes in the level of economic uncertainty continue to impact key accounting estimates and
assumptions, particularly the estimation of ECLs. See “Accounting and control matters” and Note 5 to our consolidated financial statements for
further details.
CIBC 2022 ANNUAL REPORT 5

Management’s discussion and analysis
Significant events
Acquisition of Canadian Costco credit card portfolio
On March 4, 2022, we completed the acquisition of the Canadian Costco credit card portfolio, which had an outstanding balance of $2.9 billion, for
cash consideration of $3.1 billion. We have also entered into a long-term agreement under which we have become the exclusive issuer of Costco-
branded Mastercard credit cards in Canada. The combined transaction was accounted for as an asset acquisition and included in our Canadian
Personal and Business Banking SBU. For additional information, see Note 3 to our consolidated financial statements.
Sale of certain banking assets in the Caribbean
On October 12, 2021, FirstCaribbean International Bank Limited (CIBC FirstCaribbean) announced that it had entered into agreements to sell its
banking assets in St. Vincent, Grenada, Dominica, St. Kitts and Aruba. The sale of banking assets in Aruba was completed on February 25, 2022
upon the satisfaction of the closing conditions. The proposed sales of banking assets in St. Vincent and St. Kitts received regulatory approval in the
third quarter of 2022 and are expected to close by the third quarter of 2023, subject to the satisfaction of closing conditions. The parties continue to
pursue the regulatory approvals required to complete the transaction in Grenada, which may require amendments to the proposed transaction. The
proposed transaction in Dominica will not be proceeding and operations in Dominica will cease on January 31, 2023. The impacts upon the closing
of these transactions and closures are not expected to be material.
6 CIBC 2022 ANNUAL REPORT

Management’s discussion and analysis
Financial performance overview
This section provides a review of our consolidated financial results for 2022. A review of our SBU results follows on pages 21 to 32. Refer to page 12
for a review of our financial performance for 2021.
2022 Financial results review
Reported net income for the year was $6,243 million, compared with $6,446 million in 2021.
Adjusted net income
(1)
for the year was $6,578 million, compared with $6,687 million in 2021.
Reported diluted EPS
(2)
for the year was $6.68, compared with $6.96 in 2021.
Adjusted diluted EPS
(1)(2)
for the year was $7.05, compared with $7.23 in 2021.
2022
Net income was affected by the following items of note:
•
$181 million ($133 million after-tax) in acquisition and integration-related costs as well as purchase accounting adjustments and provision for
credit losses for performing loans
(3)
associated with the acquisition of the Canadian Costco credit card portfolio (Canadian Personal and
Business Banking);
• $136 million ($100 million after-tax) increase in legal provisions (Corporate and Other);
• $98 million ($75 million after-tax) amortization of acquisition-related intangible assets ($14 million after-tax in Canadian Personal and Business
Banking, $50 million after-tax in U.S.
Commercial Banking and Wealth Management and $11 million after-tax in Corporate and Other); and
• $37 million ($27 million after-tax) charge related to the consolidation of our real estate portfolio (Corporate and Other).
The above items of note increased revenue by $16 million, increased provision for credit losses by $94 million, increased non-interest expenses by
$374 million and decreased
income taxes by $117 million. In aggregate, these items of note decreased net income by $335 million.
2021
Net income was affected by the following items of note:
• $125 million ($92 million after-tax) increase in legal provisions (Corporate and Other);
• $109 million ($80 million after-tax) charge related to the consolidation of our real estate portfolio (Corporate and Other);
• $79 million ($60 million after-tax) amortization of acquisition-related intangible assets ($50 million after-tax in U.S. Commercial Banking and
Wealth
Management and $10 million after-tax in Corporate and Other); and
• $12 million ($9 million after-tax) in acquisition and integration-related costs
(3)
associated with the acquisition of the Canadian Costco credit
card portfolio (Canadian Personal and Business Banking).
The above items of note increased non-interest expenses by $325 million and decreased income taxes by $84 million. In aggregate, these items of
note decreased net income by $241 million.
(1) Adjusted measures are non-GAAP measures. For additional information, see the “Non-GAAP measures” section.
(2) On April 7, 2022, CIBC shareholders approved a two-for-one share split (Share Split) of CIBC’s issued and outstanding common shares. Each shareholder of record at the
close of business on May 6, 2022 (Record Date) received one additional share on May 13, 2022 (Payment Date) for every one share held on the Record Date. All common
share numbers and per common share amounts have been adjusted to reflect the Share Split as if it was retroactively applied to all periods presented.
(3) Acquisition and integration costs are comprised of incremental costs incurred as part of planning for and executing the integration of the Canadian Costco credit card
portfolio, including enabling franchising opportunities, the upgrade and conversion of systems and processes, project delivery, communication costs and client welcome
bonuses. Purchase accounting adjustments include the accretion of the acquisition date fair value discount on the acquired Canadian Costco credit card receivables.
Provision for credit losses for performing loans associated with the acquisition of the Canadian Costco credit card portfolio, included the stage 1 ECL allowance
established immediately after the acquisition date and the impact of the migration of stage 1 accounts to stage 2 during the second quarter of 2022.
Net interest income and margin
$ millions, for the year ended October 31 2022 2021
Average interest-earning assets $ 799,224 $ 721,686
Net interest income
(1)
12,641 11,459
Net interest margin on average interest-earning assets 1.58 % 1.59 %
CIBC 2022 ANNUAL REPORT 7
(1) Trading activities is based on the risk definition of trading for regulatory capital and trading market risk management purposes. Positions in a trading book are considered
trading provided the book and positions continue to meet OSFI-defined trading book criteria set out in OSFI’s CAR Guideline. Trading activities and related risk
management strategies can periodically shift trading income between net interest income and non-interest income. Therefore, we view total trading income as the most
appropriate measure of trading performance.
Net interest income was up $1,182 million or 10% from 2021, primarily due to volume growth across our businesses, partially offset by lower trading
income.
Net interest margin on average interest-earning assets was comparable with 2021, primarily due to lower asset margins offset by higher
deposit margins.
Additional information on net interest income and margin is provided in the “Supplementary annual financial information” section and in the
“Strategic business units overview” section.

Management’s discussion and analysis
Non-interest income
(1)
$ millions, for the year ended October 31 2022 2021
Underwriting and advisory fees $ 557 $ 713
Deposit and payment fees 880 797
Credit fees 1,286 1,152
Card fees 437 460
Investment management and custodial fees
(2)(3)
1,760 1,621
Mutual fund fees
(3)
1,776 1,772
Insurance fees, net of claims 351 358
Commissions on securities transactions 378 426
Gains (losses) from financial instruments measured/designated at fair value through profit or loss (FVTPL), net
(4)
1,172 607
Gains (losses) from debt securities measured at fair value through other comprehensive income (FVOCI) and
amortized cost, net 35 90
Foreign exchange other than trading 242 276
Income from equity-accounted associates and joint ventures
(2)
47 55
Other 271 229
$ 9,192 $ 8,556
(1) Trading activities is based on the risk definition of trading for regulatory capital and trading market risk management purposes. Positions in a trading book are considered
trading provided the book and positions continue to meet OSFI-defined trading book criteria set out in OSFI’s CAR Guideline. Trading activities and related risk
management strategies can periodically shift trading income between net interest income and non-interest income. Therefore, we view total trading income as the most
appropriate measure of trading performance.
(2) Custodial fees directly recognized by CIBC are included in Investment management and custodial fees. Our proportionate share of the custodial fees from the joint
ventures which CIBC has with The Bank of New York Mellon are included within Income from equity-accounted associates and joint ventures.
(3) Investment management fees and mutual fund fees are driven by various factors, including the amount of AUM. Investment management fees in our asset management
and private wealth management businesses are generally driven by the amount of AUM, while investment management fees in our retail brokerage business are driven by
a combination of the amount of AUA and, to a lesser extent, other factors not directly related to the amount of AUA (e.g., flat fees on a per account basis).
(4) Includes $44 million of gains (2021: $87 million of losses) relating to non-trading financial instruments measured/designated at FVTPL.
Non-interest income was up $636 million or 7% from 2021.
Underwriting and advisory fees were down $156 million or 22%, primarily due to lower equity and debt issuance revenue.
Deposit and payment fees were up $83 million or 10%, primarily due to higher fees in Canadian Personal and Business Banking.
Credit fees were up $134 million or 12%, primarily due to growth in commercial borrowing.
Investment management and custodial fees were up $139 million or 9%, primarily due to higher average AUA and AUM in our wealth management
businesses.
Gains (losses) from financial instruments measured/designated at FVTPL, net were up $565 million or 93%, primarily due to higher trading revenue.
Gains (losses) from debt securities measured at FVOCI and amortized cost, net were down $55 million or 61%, primarily due to lower net realized
gains from dispositions of FVOCI debt
securities.
Trading revenue (TEB)
(1)(2)
$ millions, for the year ended October 31 2022 2021
Trading revenue consists of:
Net interest income
(1)
$ 875 $ 1,020
Non-interest income
(3)
1,128 694
$ 2,003 $ 1,714
Trading revenue by product line:
Interest rates $ 335 $ 328
Foreign exchange 899 651
Equities
(1)
611 548
Commodities 144 158
Other 14 29
$ 2,003 $ 1,714
(1) Includes a TEB adjustment of $211 million (2021: $204 million) reported within Capital Markets. See “Strategic business units overview” section and Note 30 to our
consolidated financial statements for further details.
(2) Trading activities is based on the risk definition of trading for regulatory capital and trading market risk management purposes. Positions in a trading book are considered
trading provided the book and positions continue to meet OSFI-defined trading book criteria set out in OSFI’s CAR Guideline.
(3) Reported as part of the Gains (losses) from financial instruments measured/designated at FVTPL in the consolidated statement of income, which consist of a gain of $1,128 million
(2021: $694 million) related to trading financial instruments measured/designated at FVTPL and a gain of $44 million (2021: loss of $87 million) relating to non-trading financial
instruments measured/designated at FVTPL.
Trading revenue was up $289 million or 17% from 2021, primarily due to higher foreign exchange and equity trading revenue.
Trading revenue comprises net interest income and non-interest income. Net interest income arises from interest and dividends relating to financial
assets and liabilities associated with trading activities, other than derivatives, net of interest expense and interest income associated with funding these
assets and liabilities. Non-interest income includes realized and unrealized gains and losses on securities mandatorily measure
d at FVTPL and income
relating to changes in fair value of derivative financial instruments. Trading revenue excludes underwriting fees and commissions on securities
transactions, which are shown separately in the consolidated statement of income. Trading activities and related risk management strategies can
periodically shift income between net interest income and non-interest income. Therefore, we view total trading revenue as the most appropriate
measure of trading performance.
8 CIBC 2022 ANNUAL REPORT

Management’s discussion and analysis
Provision for credit losses
$ millions, for the year ended October 31 2022 2021
Provision for (reversal of) credit losses – impaired
Canadian Personal and Business Banking $ 534 $ 484
Canadian Commercial Banking and Wealth Management 22 6
U.S. Commercial Banking and Wealth Management 113 104
Capital Markets (31) 32
Corporate and Other 59 76
697 702
Provision for (reversal of) credit losses – performing
Canadian Personal and Business Banking 342 (134)
Canadian Commercial Banking and Wealth Management 1 (45)
U.S. Commercial Banking and Wealth Management 105 (179)
Capital Markets (31) (132)
Corporate and Other (57) (54)
360 (544)
$ 1,057 $ 158
Provision for credit losses was up $899 million or 569% from 2021, as provisions for performing loans in the current year reflected an unfavourable
change in our economic outlook, while the prior year benefitted from a favourable change in our economic outlook driven by the recovery from the
COVID-19 pandemic.
For further details regarding provision for credit losses in our SBUs, refer to the “Strategic business units overview” section.
Non-interest expenses
$ millions, for the year ended October 31 2022 2021
Employee compensation and benefits
Salaries
(1)
$ 3,770 $ 3,213
Performance-based compensation 2,460 2,329
Benefits 927 908
7,157 6,450
Occupancy costs
(2)
853 916
Computer, software and office equipment 2,297 2,030
Communications 352 318
Advertising and business development 334 237
Professional fees 313 277
Business and capital taxes 123 111
Other 1,374 1,196
$ 12,803 $ 11,535
(1) Includes termination benefits.
(2) Includes charges of $37 million (2021: $109 million), related to the consolidation of our real estate portfolio, shown as items of note.
Non-interest expenses were up $1,268 million or 11% from 2021.
Employee compensation and benefits were up $707 million or 11%, primarily due to higher employee-related and performance-based compensation.
Computer, software and office equipment were up $267 million or 13%, primarily due to higher spending on strategic initiatives.
Advertising and business development were up $97 million or 41%, primarily due to higher spending on strategic initiatives and higher travel and
business development spending driven by the easing of COVID-19 travel restrictions.
Other expenses were up $178 million or 15%, as the current year included costs associated with the acquisition of the Canadian Costco credit card
portfolio and an increase in legal provisions, both shown as items of note.
CIBC 2022 ANNUAL REPORT 9

Management’s discussion and analysis
Taxes
$ millions, for the year ended October 31 2022 2021
Income taxes $ 1,730 $ 1,876
Indirect taxes
(1)
Goods and Services Tax (GST), Harmonized Sales Tax (HST) and sales taxes 471 403
Payroll taxes 368 306
Capital taxes 84 77
Property and business taxes 73 70
Total indirect taxes 996 856
Total taxes $ 2,726 $ 2,732
Reported effective tax rate 21.7 % 22.5 %
Total taxes as a percentage of net income before deduction of total taxes 30.4 % 29.8 %
(1) Certain amounts are based on a paid or payable basis and do not factor in capitalization and subsequent amortization.
Total income and indirect taxes were down $6 million from 2021.
Income tax expense was $1,730 million, down $146 million from 2021. This was due to both lower income and also an increase in the relative
proportion of income subject to lower rates of income tax.
Indirect taxes were up $140 million from 2021, due to increases in both sales taxes and payroll taxes. Sales taxes increased by $68 million
from 2021, primarily due to increased non-employee related non-interest expenses. Payroll taxes increased by $62 million from 2021 primarily due
to increases in statutory pension, health care and unemployment insurance contributions driven by higher employee-related compensation. Indirect
taxes are included in non-interest expenses.
In prior years, the Canada Revenue Agency (CRA) issued reassessments disallowing the deduction of Enron settlement payments and related
legal expenses (the Enron expenses). In January 2019, CIBC entered into a settlement agreement with the CRA with respect to the portion of the
Enron expenses deductible in Canada. The portion of the Enron expenses deductible in the U.S. has not yet been agreed to by the Internal Revenue
Service. It is possible that adjustments may be required to the amount of tax benefits recognized in the U.S.
The CRA has reassessed CIBC approximately $1,602 million of additional income tax related to the denial of the tax deductibility of certain
2011 to 2017 Canadian corporate dividends, on the basis that certain dividends received were part of a “dividend rental arrangement”, and similar
matters. This includes approximately $182 million of additional income tax for the 2017 taxation year that was reassessed by the CRA in May 2022.
The dividends that were subject to the reassessments are similar to those prospectively addressed by the rules in the 2015 and 2018 Canadian
federal budgets. It is possible that subsequent years may be reassessed for similar matters. In August 2021, CIBC filed a Notice of Appeal with the
Tax Court of Canada and the matter is now in litigation. CIBC is confident that its tax filing positions were appropriate and intends to defend itself
vigorously. Accordingly, no amounts have been accrued in the consolidated financial statements.
In November 2021, the Tax Court of Canada ruled against CIBC on its 2007 foreign exchange capital loss reassessment (Decision). CIBC
disagrees with the Decision and filed its Appeal in November 2021. The Appeal is scheduled to be heard in December 2022. CIBC remains
confident that its tax filing position was appropriate. Accordingly, no amounts have been accrued in the consolidated financial statements. The
exposure of additional tax and interest related to this and similar matters is approximately $300 million in addition to the potential inability to utilize
approximately $600 million in unrecognized capital tax loss carryforwards.
Following the announcement of budget proposals in April 2022, the Canadian Federal government released draft legislation in August 2022,
and subsequently introduced other draft legislation which went through first and second readings in Parliament in November 2022. These proposals
included the introduction of a one-time 15% Canada Recovery Dividend tax (CRD) on banks and life insurer groups, based on the average of 2020
and 2021 taxable income in excess of $1.0 billion. Once substantively enacted, the CRD would become payable over a five-year period in equal
increments. The draft legislation also includes a prospective 1.5% increase in the tax rate applied to taxable income in excess of $100 million
earned by banks and life insurers. We will account for these measures in future periods once they become substantively enacted, which is generally
interpreted to occur at the point of a third reading in a Canadian Parliament held by a minority government. Based on the draft legislation, a charge
to income tax expense of approximately $550 million would be recognized for the full amount of the CRD obligation upon its substantive enactment.
Foreign exchange
The estimated impact of U.S. dollar translation on key lines of our consolidated statement of income, as a result of changes in average exchange
rates, is as follows:
$ millions, for the year ended October 31
2022
vs.
2021
2021
vs.
2020
Estimated increase (decrease) in:
Total revenue $ 143 $ (307)
Provision for credit losses 6 13
Non-interest expenses 65 (141)
Income taxes 10 (26)
Net income 62 (153)
Impact on EPS
(1)
:
Basic $ 0.07 $ (0.17)
Diluted 0.07 (0.17)
Average USD appreciation (depreciation) relative to CAD 2.9 % (6.6)%
(1) On April 7, 2022, CIBC shareholders approved a two-for-one share split (Share Split) of CIBC’s issued and outstanding common shares. Each shareholder of record at the
close of business on May 6, 2022 (Record Date) received one additional share on May 13, 2022 (Payment Date) for every one share held on the Record Date. All common
share numbers and per common share amounts have been adjusted to reflect the Share Split as if it was retroactively applied to all periods presented.
10 CIBC 2022 ANNUAL REPORT

Management’s discussion and analysis
Fourth quarter review
$ millions, except per share amounts, for the three months ended 2022 2021
Oct. 31 Jul. 31 Apr. 30 Jan. 31 Oct. 31 Jul. 31 Apr. 30 Jan. 31
Revenue
Canadian Personal and Business Banking $ 2,262 $ 2,321 $ 2,143 $ 2,183 $ 2,128 $ 2,056 $ 1,941 $ 2,025
Canadian Commercial Banking and Wealth Management 1,316 1,338 1,303 1,297 1,240 1,207 1,135 1,088
U.S. Commercial Banking and Wealth Management 653 604 591 609 562 539 532 561
Capital Markets
(1)
1,182 1,199 1,316 1,304 1,012 1,140 1,194 1,174
Corporate and Other
(1)
(25) 109 23 105 122 114 130 115
Total revenue $ 5,388 $ 5,571 $ 5,376 $ 5,498 $ 5,064 $ 5,056 $ 4,932 $ 4,963
Net interest income $ 3,185 $ 3,236 $ 3,088 $ 3,132 $ 2,980 $ 2,893 $ 2,747 $ 2,839
Non-interest income 2,203 2,335 2,288 2,366 2,084 2,163 2,185 2,124
Total revenue 5,388 5,571 5,376 5,498 5,064 5,056 4,932 4,963
Provision for (reversal of) credit losses 436 243 303 75 78 (99) 32 147
Non-interest expenses 3,483 3,183 3,114 3,023 3,135 2,918 2,756 2,726
Income before income taxes 1,469 2,145 1,959 2,400 1,851 2,237 2,144 2,090
Income taxes 284 479 436 531 411 507 493 465
Net income $ 1,185 $ 1,666 $ 1,523 $ 1,869 $ 1,440 $ 1,730 $ 1,651 $ 1,625
Net income attributable to:
Non-controlling interests $7 $6 $5 $5 $4 $5 $4 $4
Equity shareholders 1,178 1,660 1,518 1,864 1,436 1,725 1,647 1,621
EPS – basic
(2)
$ 1.26 $ 1.79 $ 1.63 $ 2.02 $ 1.54 $ 1.88 $ 1.78 $ 1.78
– diluted
(2)
1.26 1.78 1.62 2.01 1.54 1.88 1.78 1.78
(1) Capital Markets revenue and income taxes are reported on a TEB with an equivalent offset in the revenue and income taxes of Corporate and Other.
(2) On April 7, 2022, CIBC shareholders approved a two-for-one share split (Share Split) of CIBC’s issued and outstanding common shares. Each shareholder of record at the
close of business on May 6, 2022 (Record Date) received one additional share on May 13, 2022 (Payment Date) for every one share held on the Record Date. All common
share numbers and per common share amounts have been adjusted to reflect the Share Split as if it was retroactively applied to all periods presented.
Compared with Q4/21
Net income for the quarter was $1,185 million, down $255 million or 18% from the fourth quarter of 2021.
Net interest income was up $205 million, primarily due to volume growth across our businesses, partially offset by lower trading income.
Non-interest income was up $119 million or 6%, primarily due to higher trading income, partially offset by lower treasury and market-related fee
revenue.
Provision for credit losses was up $358 million or 459% from the same quarter last year. The current quarter included a provision for credit losses
on performing loans of $217 million, while the same quarter last year included a provision reversal of $34 million. Provision for credit losses on impaired
loans was up $107 million, mainly attributable to Canadian Personal and Business Banking, and U.S. Commercial Banking and Wealth Management.
Non-interest expenses were up $348 million or 11%, primarily due to higher employee-related compensation, higher spending on strategic
initiatives, including the Canadian Costco credit card portfolio, and an increase in legal provisions, shown as an item of note.
Income tax expense was down $127 million or 31%, primarily due to lower income.
Compared with Q3/22
Net income for the quarter was down $481 million or 29% from the prior quarter.
Net interest income was down $51 million or 2%, primarily due to lower product spreads and lower trading income, partially offset by volume
growth across
our businesses.
Non-interest income was down $132 million or 6%, primarily due to lower treasury and market-related fee revenue.
Provision for credit losses was up $193 million or 79% from the prior quarter. Provision for credit losses on performing loans was up
$130 million,
primarily due to an unfavourable change in our economic outlook. Provision for credit losses on impaired loans was up $63 million, as a
result of increases across all of our SBUs.
Non-interest expenses were up $300 million or 9%, primarily due to employee-related and performance-based compensation, an increase in
legal provisions
and the charge related to the consolidation of our real estate portfolio, both shown as items of note.
Income tax expense was down $195 million or 41%, primarily due to lower income.
Quarterly trend analysis
Our quarterly results are modestly affected by seasonal factors. The second quarter has fewer days as compared with the other quarters, generally
leading to lower earnings. The summer months (July – third quarter and August – fourth quarter) typically experience lower levels of market activity,
which affects our brokerage, investment management, and Capital Markets activities.
Revenue
Revenue in our lending and deposit-taking businesses is generally driven by volume growth, fees related to client transaction activity and the
interest rate environment. Our wealth management businesses are driven by net sales activity impacting AUA and AUM, the level of client
investment activity and market conditions. Capital Markets revenue is also influenced, to a large extent, by market conditions affecting client trading
and underwriting activity.
Canadian Personal and Business Banking has benefitted from loan and deposit growth throughout the period, as well as increased client
transaction activity as the economy recovered from the early stages of the COVID-19 pandemic. Earlier periods were negatively impacted by the
low interest rate environment, which has started to improve with interest rate increases in recent quarters.
Canadian Commercial Banking and Wealth Management revenue has benefitted from commercial banking volume growth as well as from
strong markets. In
Commercial Banking, loan and deposit revenue growth was driven by strong client demand and more recently from an increase
in interest rates. In Wealth Management, AUA and AUM growth has been challenged over the past few quarters as a result of volatile markets
caused by global concerns surrounding inflation, supply chain issues and geopolitical uncertainty.
U.S. Commercial Banking and Wealth Management has benefitted from organic client acquisitions that are driving increased loans, deposits,
AUM and fee income. Loan growth has also accelerated due to the economic recovery in 2021 and into the first half of 2022, although recently
CIBC 2022 ANNUAL REPORT 11

Management’s discussion and analysis
decelerated due to softer economic growth, rising interest rates and inflation. Wealth Management AUA and AUM growth has been hindered over the
past few quarters by market depreciation, partially offset by strong sales momentum.
Capital Markets had increased revenue from underwriting and advisory activities in the second and third quarters of 2021, and lower trading
revenue in the fourth quarter of 2021. The first and second quarters of 2022 had higher trading revenue.
Corporate and Other included the impact of an increase in funding costs in the first and second quarters of 2021 from the excess liquidity that
built up during the early stages of the pandemic, as well as an increase in funding costs starting in the second quarter of 2022 from an increase in
credit spreads. In 2021, the interest rate environment and narrower margins negatively impacted revenue, while the gradual increase in interest
rates in 2022 have resulted in higher margins in International banking.
Provision for credit losses
Provision for credit losses is dependent upon the credit cycle in general, on the credit performance of the loan portfolios, and changes in our
economic outlook. While the uncertainty relating to the COVID-19 pandemic has reduced significantly, we still operate in an uncertain
macroeconomic environment due to concerns related to rising interest rates, high levels of inflation and supply chain disruptions related to
geopolitical events, slower economic growth and the continued measures imposed in some countries to combat the spread of COVID-19. There is
considerable judgment involved in the estimation of credit losses in the current environment.
All four quarters of 2021 and the first quarter of 2022 reflect a moderate improvement in economic conditions as well as our economic outlook.
With a faster than expected pace of interest rate increases, along with rising inflation, continued supply chain disruption and the increase in global
geopolitical concerns, our provision for credit losses on performing loans increased in the second, third and fourth quarters of 2022.
In Canadian Personal and Business Banking, lower insolvencies and write-offs in credit cards relative to pre-pandemic levels impacted the
first, third and fourth quarters of 2021, and the first and second quarters of 2022. The decrease in insolvencies was in line with the national
Canadian trend. The low level of write-offs in the first quarter of 2021 were a result of the assistance offered to clients from our payment deferral
programs and government support, as well as lower client spending. In contrast, the second quarter of 2021 included higher write-offs in credit
cards, mainly attributable to a relatively small segment of client balances that were previously in the payment deferral programs that continued to
underperform and eventually were written off after exiting the programs. Lower write-offs in the third and fourth quarters of 2021 and the first and
second quarters of 2022 benefitted from the household savings that built up during the pandemic. Commencing in the second quarter of 2022, our
loan losses included write-offs from the seasoning of the acquired Canadian Costco credit card portfolio.
In Canadian Commercial Banking and Wealth Management, impaired loan losses continue to remain at a relatively low level.
In U.S. Commercial Banking and Wealth Management, the first quarter of 2021, and the first, second and fourth quarters of 2022 included
higher provisions on impaired loans.
In Capital Markets, the first quarter of 2021 included higher provisions on impaired loans in the utilities sector.
In Corporate and Other, the third quarter of 2021 included higher provisions on impaired loans in CIBC FirstCaribbean.
Non-interest expenses
Non-interest expenses have fluctuated over the period largely due to changes in employee compensation expenses, investments in strategic
initiatives and movement in foreign exchange rates. The third and fourth quarters of 2021, and the second and fourth quarters of 2022 included
increases in legal provisions in Corporate and Other, all shown as items of note. The fourth quarter of 2021 and the fourth quarter of 2022 included
charges related to the consolidation of our real estate portfolio as a result of our move to our new global headquarters.
Income taxes
Income taxes vary with changes in income subject to tax, and the jurisdictions in which the income is earned. Taxes can also be affected by the
impact of significant items and the level of tax-exempt income.
Review of 2021 financial performance
$ millions, for the year ended October 31
Canadian
Personal and
Business
Banking
Canadian
Commercial Banking
and Wealth
Management
U.S.
Commercial Banking
and Wealth
Management
Capital
Markets
(1)
Corporate
and Other
(1)
CIBC
Total
2021 Net interest income $ 5,954 $ 1,291 $ 1,449 $ 2,701 $ 64 $ 11,459
Non-interest income 2,196 3,379 745 1,819 417 8,556
Total revenue 8,150 4,670 2,194 4,520 481 20,015
Provision for (reversal of) credit losses 350 (39) (75) (100) 22 158
Non-interest expenses 4,414 2,443 1,121 2,117 1,440 11,535
Income (loss) before income taxes 3,386 2,266 1,148 2,503 (981) 8,322
Income taxes 892 601 222 646 (485) 1,876
Net income (loss) $ 2,494 $ 1,665 $ 926 $ 1,857 $ (496) $ 6,446
Net income (loss) attributable to:
Non-controlling interests $ – $ – $ – $ – $ 17 $ 17
Equity shareholders 2,494 1,665 926 1,857 (513) 6,429
2020 Net interest income $ 5,849 $ 1,248 $ 1,422 $ 2,354 $ 171 $ 11,044
Non-interest income 2,073 2,873 621 1,699 431 7,697
Total revenue 7,922 4,121 2,043 4,053 602 18,741
Provision for credit losses 1,189 303 487 311 199 2,489
Non-interest expenses 4,308 2,179 1,126 1,929 1,820 11,362
Income (loss) before income taxes 2,425 1,639 430 1,813 (1,417) 4,890
Income taxes 640 437 55 505 (539) 1,098
Net income (loss) $ 1,785 $ 1,202 $ 375 $ 1,308 $ (878) $ 3,792
Net income (loss) attributable to:
Non-controlling interests $ – $ – $ – $ – $ 2 $ 2
Equity shareholders 1,785 1,202 375 1,308 (880) 3,790
(1) Capital Markets revenue and income taxes are reported on a TEB with an equivalent offset in the revenue and income taxes of Corporate and Other.
12 CIBC 2022 ANNUAL REPORT

Management’s discussion and analysis
The following discussion provides a comparison of our results of operations for the years ended October 31, 2021 and 2020.
Overview
Net income for 2021 was $6,446 million, compared with $3,792 million in 2020. The increase in net income of $2,654 million was due to lower
provision for credit losses and higher revenue, partially offset by higher non-interest expenses.
Consolidated CIBC
Net interest income
Net interest income was up $415 million or 4% from 2020, primarily due to volume growth across our businesses and higher trading revenue,
partially offset by lower product spreads as a result of changes in the interest rate environment and the impact of foreign exchange translation.
Non-interest income
Non-interest income was up $859 million or 11% from 2020, primarily due to higher equity and debt issuance revenue and advisory activity, higher
fee-based revenue driven by higher average AUA and AUM reflecting market appreciation and net sales in our wealth management businesses,
and growth in fees related to commercial borrowing.
Provision for credit losses
Provision for credit losses was down $2,331 million or 94% from 2020, as 2021 reflected an improvement in economic conditions as well as our
economic outlook, while 2020 was adversely impacted by the onset of the COVID-19 pandemic.
Non-interest expenses
Non-interest expenses were up $173 million or 2% from 2020, primarily due to higher performance-based compensation.
Income taxes
Income tax expense was up $778 million or 71% from 2020, primarily due to higher income.
Revenue by segment
Canadian Personal and Business Banking
Revenue was up $228 million or 3% from 2020, primarily due to volume growth and higher fee income, partially offset by lower product spreads
largely as a result of changes in the interest rate environment.
Canadian Commercial Banking and Wealth Management
Revenue was up $549 million or 13% from 2020. Commercial banking revenue was up $164 million or 10%, primarily due to higher fees and volume
growth, partially offset by lower product spreads. Wealth management revenue was up $385 million or 16%, primarily due to higher fee-based
revenue driven by higher average AUA and AUM reflecting market appreciation and net sales, and higher commission revenue from increased
client activity.
U.S. Commercial Banking and Wealth Management
Revenue was up $151 million or 7% from 2020. Commercial banking revenue was up $23 million or 2%, primarily due to volume growth and higher
fees, partially offset by lower product spreads. Wealth management revenue was up $128 million or 28%, primarily due to higher fee-based revenue
driven by higher average AUA and AUM reflecting market appreciation and net sales, higher product spreads, partially driven by loans made under
the U.S. Paycheck Protection Program (PPP), and volume growth.
Capital Markets
Revenue was up $467 million or 12% from 2020. Global markets revenue was up $77 million or 4%, primarily due to higher revenue from our equity
derivatives trading business, partially offset by lower fixed income and foreign exchange trading revenue. Corporate and investment banking
revenue was up $272 million or 20%, primarily due to higher equity and debt underwriting activity, higher advisory revenue and higher corporate
banking revenue. Direct financial services revenue was up $118 million or 17%, primarily due to higher volumes and growth in our direct brokerage
trading, and innovative foreign exchange and payments business.
Corporate and Other
Revenue was down $121 million or 20% from 2020. International banking revenue was down $47 million, primarily due to the impact of foreign
exchange translation, and lower U.S. dollar revenue in CIBC FirstCaribbean driven by lower product spreads, partially offset by higher ECL charges
on debt securities in 2020, volume growth and higher fees. Other revenue was down $74 million, primarily due to lower revenue from our strategic
investments, interest income in 2020 related to the settlement of certain income tax matters, a higher TEB adjustment and lower treasury revenue.
CIBC 2022 ANNUAL REPORT 13

Management’s discussion and analysis
Non-GAAP measures
We use a number of financial measures to assess the performance of our business lines as described below. Some measures are calculated in
accordance with GAAP (IFRS), while other measures do not have a standardized meaning under GAAP, and accordingly, these measures may not
be comparable to similar measures used by other companies. Investors may find these non-GAAP measures, which include non-GAAP financial
measures and non-GAAP ratios as defined in National Instrument 52-112 “Non-GAAP and Other Financial Measures Disclosure”, useful in
understanding how management views underlying business performance.
Adjusted measures
Management assesses results on a reported and adjusted basis and considers both as useful measures of performance. Adjusted measures, which
include adjusted total revenue, adjusted provision for credit losses, adjusted non-interest expenses, adjusted income before income taxes, adjusted
income taxes and adjusted net income, in addition to the adjusted measures noted below, remove items of note from reported results to calculate
our adjusted results. Items of note include the amortization of intangible assets, and certain items of significance that arise from time to time which
management believes are not reflective of underlying business performance. We believe that adjusted measures provide the reader with a better
understanding of how management assesses underlying business performance and facilitates a more informed analysis of trends. While we believe
that adjusted measures may facilitate comparisons between our results and those of some of our Canadian peer banks, which make similar
adjustments in their public disclosure, it should be noted that there is no standardized meaning for adjusted measures under GAAP.
We also adjust our results to gross up tax-exempt revenue on certain securities to a TEB, being the amount of fully taxable revenue, which,
were it to have incurred tax at the statutory income tax rate, would yield the same after-tax revenue. See the “Strategic business units overview”
section and Note 30 to our consolidated financial statements for further details.
Adjusted diluted EPS
We adjust our reported diluted EPS to remove the impact of items of note, net of income taxes, to calculate the adjusted EPS.
Adjusted efficiency ratio
We adjust our reported revenue and non-interest expenses to remove the impact of items of note and gross up tax-exempt revenue to bring it to a
TEB, to calculate the adjusted efficiency ratio.
Adjusted operating leverage
We adjust our reported revenue and non-interest expenses to remove the impact of items of note and gross up tax-exempt revenue to bring it to a
TEB, to calculate the adjusted operating leverage.
Adjusted dividend payout ratio
We adjust our reported net income attributable to common shareholders to remove the impact of items of note, net of income taxes, to calculate the
adjusted dividend payout ratio.
Adjusted return on common shareholders’ equity
We adjust our reported net income attributable to common shareholders to remove the impact of items of note, net of income taxes, to calculate the
adjusted return on common shareholders’ equity.
Adjusted effective tax rate
We adjust our reported income before income taxes and reported income taxes to remove the impact of items of note, to calculate the adjusted
effective tax rate.
Pre-provision, pre-tax earnings
Pre-provision, pre-tax earnings is calculated as revenue net of non-interest expenses, and provides the reader with an assessment of our ability to
generate earnings to cover credit losses through the credit cycle, as well as an additional basis for comparing underlying business performance
between periods by excluding the impact of provision for credit losses, which involves the application of judgments and estimates related to matters
that are uncertain and can vary significantly between periods. We adjust our pre-provision, pre-tax earnings to remove the impact of items of note to
calculate the adjusted pre-provision, pre-tax earnings. As discussed above, we believe that adjusted measures provide the reader with a better
understanding of how management assesses underlying business performance and facilitates a more informed analysis of trends.
Allocated common equity
Common equity is allocated to the SBUs based on the estimated amount of regulatory capital required to support their businesses (as determined
for the consolidated bank pursuant to OSFI’s regulatory capital requirements and internal targets). Unallocated common equity is reported in
Corporate and Other. Allocating capital on this basis provides a consistent framework to evaluate the returns of each SBU commensurate with the
risk assumed. In 2022, we increased the common equity allocated to our SBUs to 11% of CET1 capital requirements for each SBU, reflecting an
increase from 10% in 2021. For additional information, see the “Risks arising from business activities” section.
Segmented return on equity
We use return on equity on a segmented basis as one of the measures for performance evaluation and resource allocation decisions. While return
on equity for total CIBC provides a measure of return on common equity, return on equity on a segmented basis provides a similar metric based on
allocated common equity to our SBUs. As a result, segmented return on equity is a non-GAAP ratio. Segmented return on equity is calculated as net
income attributable to common shareholders for each SBU expressed as a percentage of average allocated common equity, which is the average
of monthly allocated common equity during the period. In 2022, we increased the common equity allocated to our SBUs, as noted above.
14 CIBC 2022 ANNUAL REPORT

Management’s discussion and analysis
The following table provides a reconciliation of GAAP (reported) results to non-GAAP (adjusted) results on a segmented basis.
$ millions, for the year ended October 31, 2022
Canadian
Personal
and Business
Banking
Canadian
Commercial
Banking
and Wealth
Management
U.S.
Commercial
Banking
and Wealth
Management
Capital
Markets
Corporate
and Other
CIBC
Total
U.S.
Commercial
Banking
and Wealth
Management
US$ millions) (
Operating results – reported
Total revenue $ 8,909 $ 5,254 $ 2,457 $ 5,001 $ 212 $ 21,833 $ 1,902
Provision for (reversal of) credit losses 876 23 218 (62) 2 1,057 169
Non-interest expenses 4,975 2,656 1,328 2,437 1,407 12,803 1,028
Income (loss) before income taxes 3,058 2,575 911 2,626 (1,197) 7,973 705
Income taxes 809 680 151 718 (628) 1,730 117
Net income (loss) 2,249 1,895 760 1,908 (569) 6,243 588
Net income attributable to non-controlling interests – – – – 23 23 –
Net income (loss) attributable to equity shareholders 2,249 1,895 760 1,908 (592) 6,220 588
Diluted EPS ($)
(1)
$ 6.68
Impact of items of note
(2)
Revenue
Acquisition and integration-related costs as well as
purchase accounting adjustments and provision for
credit losses for performing loans
(3)
$(16) $– $– $– $ – $(16) $–
Impact of items of note on revenue (16) – – – – (16) –
Provision for (reversal of) credit losses
Acquisition and integration-related costs as well as
purchase accounting adjustments and provision for
credit losses for performing loans
(3)
(94) – – – – (94) –
Impact of items of note on provision for (reversal of)
credit losses
(94) – – – – (94) –
Non-interest expenses
Amortization of acquisition-related intangible assets (18) – (68) – (12) (98) (53)
Acquisition and integration-related costs as well as
purchase accounting adjustments and provision for
credit losses for performing loans
(3)
(103) – – – – (103) –
Charge related to the consolidation of our real estate
portfolio
– – – – (37) (37) –
Increase in legal provisions – – – – (136) (136) –
Impact of items of note on non-interest expenses (121) – (68) – (185) (374) (53)
Total pre-tax impact of items of note on net income 199 – 68 – 185 452 53
Income taxes
Amortization of acquisition-related intangible assets 4 – 18 – 1 23 14
Acquisition and integration-related costs as well as
purchase accounting adjustments and provision for
credit losses for performing loans
(3)
48 – – – – 48 –
Charge related to the consolidation of our real estate
portfolio
– – – – 10 10 –
Increase in legal provisions – – – – 36 36 –
Impact of items of note on income taxes 52 – 18 – 47 117 14
Total after-tax impact of items of note on net income $ 147 $ – $ 50 $ – $ 138 $ 335 $ 39
Impact of items of note on diluted EPS ($)
(1)
$ 0.37
Operating results – adjusted
(4)
Total revenue – adjusted
(5)
$ 8,893 $ 5,254 $ 2,457 $ 5,001 $ 212 $ 21,817 $ 1,902
Provision for (reversal of) credit losses – adjusted 782 23 218 (62) 2 963 169
Non-interest expenses – adjusted 4,854 2,656 1,260 2,437 1,222 12,429 975
Income (loss) before income taxes – adjusted 3,257 2,575 979 2,626 (1,012) 8,425 758
Income taxes – adjusted 861 680 169 718 (581) 1,847 131
Net income (loss) – adjusted 2,396 1,895 810 1,908 (431) 6,578 627
Net income attributable to non-controlling interests –
adjusted
– – – – 23 23 –
Net income (loss) attributable to equity shareholders –
adjusted
2,396 1,895 810 1,908 (454) 6,555 627
Adjusted diluted EPS ($)
(1)
$ 7.05
(1) On April 7, 2022, CIBC shareholders approved a two-for-one share split (Share Split) of CIBC’s issued and outstanding common shares. Each shareholder of record at the
close of business on May 6, 2022 (Record Date) received one additional share on May 13, 2022 (Payment Date) for every one share held on the Record Date. All common
share numbers and per common share amounts have been adjusted to reflect the Share Split as if it was retroactively applied to all periods presented.
(2) Items of note are removed from reported results to calculate adjusted results.
(3) Acquisition and integration costs, shown as an item of note starting in the fourth quarter of 2021, are comprised of incremental costs incurred as part of planning for and
executing the integration of the Canadian Costco credit card portfolio, including enabling franchising opportunities, the upgrade and conversion of systems and processes,
project delivery, communication costs and client welcome bonuses. Purchase accounting adjustments shown as an item of note starting in the second quarter of 2022,
include the accretion of the acquisition date fair value discount on the acquired Canadian Costco credit card receivables. Provision for credit losses for performing loans
associated with the acquisition of the Canadian Costco credit card portfolio, included the stage 1 ECL allowance established immediately after the acquisition date and the
impact of the migration of stage 1 accounts to stage 2 during the second quarter of 2022. Integration costs, shown as an item of note from the second quarter of 2017 to the
fourth quarter of 2019, are comprised of direct and incremental costs incurred as part of planning for and executing the integration of the businesses of The PrivateBank
(subsequently rebranded as CIBC Bank USA) and Geneva Advisors with CIBC, including enabling cross-sell opportunities and expansion of services in the U.S. market, the
upgrade and conversion of systems and processes, project management, integration-related travel, severance, consulting fees and marketing costs related to rebranding
activities. Transaction costs, shown as an item of note from the second quarter of 2017 to the fourth quarter of 2019, included legal and other advisory fees, as well as interest
adjustments relating to the obligation payable to dissenting shareholders. Purchase accounting adjustments, shown as an item of note from the fourth quarter of 2017 to the
fourth quarter of 2019, include the accretion of the acquisition date fair value discount on the acquired loans of The PrivateBank, and changes in the fair value of contingent
consideration relating to the Geneva Advisors and Wellington Financial acquisitions.
(4) Adjusted to exclude the impact of items of note. Adjusted measures are non-GAAP measures.
(5) CIBC total results excludes a taxable equivalent basis (TEB) adjustment of $211 million (2021: $204 million). Our adjusted efficiency ratio and adjusted operating leverage
are calculated on a TEB.
CIBC 2022 ANNUAL REPORT 15
Management’s discussion and analysis
The following table provides a reconciliation of GAAP (reported) results to non-GAAP (adjusted) results on a segmented basis.
$ millions, for the year ended October 31, 2021
Canadian
Personal
and Business
Banking
Canadian
Commercial
Banking
and Wealth
Management
U.S.
Commercial
Banking
and Wealth
Management
Capital
Markets
Corporate
and Other
CIBC
Total
U.S.
Commercial
Banking
and Wealth
Management
(US$ millions)
Operating results – reported
Total revenue $ 8,150 $ 4,670 $ 2,194 $ 4,520 $ 481 $ 20,015 $ 1,748
Provision for (reversal of) credit losses 350 (39) (75) (100) 22 158 (61)
Non-interest expenses 4,414 2,443 1,121 2,117 1,440 11,535 893
Income (loss) before income taxes 3,386 2,266 1,148 2,503 (981) 8,322 916
Income taxes 892 601 222 646 (485) 1,876 177
Net income (loss) 2,494 1,665 926 1,857 (496) 6,446 739
Net income attributable to non-controlling interests – – – – 17 17 –
Net income (loss) attributable to equity shareholders 2,494 1,665 926 1,857 (513) 6,429 739
Diluted EPS ($)
(1)
$ 6.96
Impact of items of note
(2)
Non-interest expenses
Amortization of acquisition-related intangible assets $ – $ – $ (68) $ – $ (11) $ (79) $ (54)
Acquisition and integration-related costs
(3)
(12) – – – – (12) –
Charge related to the consolidation of our real
estate portfolio – – – – (109) (109) –
Increase in legal provisions – – – – (125) (125) –
Impact of items of note on non-interest expenses (12) – (68) – (245) (325) (54)
Total pre-tax impact of items of note on net income 12 – 68 – 245 325 54
Income taxes
Amortization of acquisition-related intangible assets – – 18 – 1 19 14
Acquisition and integration-related costs
(3)
3 – – – – 3 –
Charge related to the consolidation of our real
estate portfolio – – – – 29 29 –
Increase in legal provisions – – – – 33 33 –
Impact of items of note on income taxes 3 – 18 – 63 84 14
Total after-tax impact of items of note on net income $ 9 $ – $ 50 $ – $ 182 $ 241 $ 40
Impact of items of note on diluted EPS ($)
(1)
$ 0.27
Operating results – adjusted
(4)
Total revenue – adjusted
(5)
$ 8,150 $ 4,670 $ 2,194 $ 4,520 $ 481 $ 20,015 $ 1,748
Provision for (reversal of) credit losses – adjusted 350 (39) (75) (100) 22 158 (61)
Non-interest expenses – adjusted 4,402 2,443 1,053 2,117 1,195 11,210 839
Income (loss) before income taxes – adjusted 3,398 2,266 1,216 2,503 (736) 8,647 970
Income taxes – adjusted 895 601 240 646 (422) 1,960 191
Net income (loss) – adjusted 2,503 1,665 976 1,857 (314) 6,687 779
Net income attributable to non-controlling interests –
adjusted – – – – 17 17 –
Net income (loss) attributable to equity shareholders –
adjusted 2,503 1,665 976 1,857 (331) 6,670 779
Adjusted diluted EPS ($)
(1)
$ 7.23
See previous page for footnote references.
16 CIBC 2022 ANNUAL REPORT

Management’s discussion and analysis
The following table provides a reconciliation of GAAP (reported) results to non-GAAP (adjusted) results on a segmented basis.
$ millions, for the year ended October 31, 2020
Canadian
Personal
and Business
Banking
Canadian
Commercial
Banking
and Wealth
Management
U.S.
Commercial
Banking
and Wealth
Management
Capital
Markets
Corporate
and Other
CIBC
Total
U.S.
Commercial
Banking
and Wealth
Management
(US$ millions)
Operating results – reported
Total revenue $ 7,922 $ 4,121 $ 2,043 $ 4,053 $ 602 $ 18,741 $ 1,520
Provision for (reversal of) credit losses 1,189 303 487 311 199 2,489 358
Non-interest expenses 4,308 2,179 1,126 1,929 1,820 11,362 838
Income (loss) before income taxes 2,425 1,639 430 1,813 (1,417) 4,890 324
Income taxes 640 437 55 505 (539) 1,098 42
Net income (loss) 1,785 1,202 375 1,308 (878) 3,792 282
Net income attributable to non-controlling interests – – – – 2 2 –
Net income (loss) attributable to equity shareholders 1,785 1,202 375 1,308 (880) 3,790 282
Diluted EPS ($)
(1)
$ 4.11
Impact of items of note
(2)
Non-interest expenses
Amortization of acquisition-related intangible assets $ (8) $ (1) $ (83) $ – $ (13) $ (105) $ (62)
Charge related to the consolidation of our real
estate portfolio – – – – (114) (114) –
Increase in legal provisions – – – – (70) (70) –
Gain as a result of plan amendments related to
pension and other post-employment plans – – – – 79 79 –
Restructuring charges, primarily relating to
employee severance and related costs – – – – (339) (339) –
Goodwill impairment charge related to our
controlling interest in CIBC FirstCaribbean – – – – (248) (248) –
Impact of items of note on non-interest expenses (8) (1) (83) – (705) (797) (62)
Total pre-tax impact of items of note on net income 8 1 83 – 705 797 62
Income taxes
Amortization of acquisition-related intangible assets 2 – 22 – 1 25 17
Charge related to the consolidation of our real
estate portfolio – – – – 30 30 –
Increase in legal provisions – – – – 19 19 –
Gain as a result of plan amendments related to
pension and other post-employment plans – – – – (21) (21) –
Restructuring charges, primarily relating to
employee severance and related costs – – – – 89 89 –
Impact of items of note on income taxes 2 – 22 – 118 142 17
Total after-tax impact of items of note on net income $ 6 $ 1 $ 61 $ – $ 587 $ 655 $ 45
Impact of items of note on diluted EPS ($)
(1)
$ 0.74
Operating results – adjusted
(4)
Total revenue – adjusted
(5)
$ 7,922 $ 4,121 $ 2,043 $ 4,053 $ 602 $ 18,741 $ 1,520
Provision for (reversal of) credit losses – adjusted 1,189 303 487 311 199 2,489 358
Non-interest expenses – adjusted 4,300 2,178 1,043 1,929 1,115 10,565 776
Income (loss) before income taxes – adjusted 2,433 1,640 513 1,813 (712) 5,687 386
Income taxes – adjusted 642 437 77 505 (421) 1,240 59
Net income (loss) – adjusted 1,791 1,203 436 1,308 (291) 4,447 327
Net income attributable to non-controlling interests –
adjusted – – – – 2 2 –
Net income (loss) attributable to equity shareholders –
adjusted 1,791 1,203 436 1,308 (293) 4,445 327
Adjusted diluted EPS ($)
(1)
$ 4.85
See previous pages for footnote references.
CIBC 2022 ANNUAL REPORT 17

Management’s discussion and analysis
The following table provides a reconciliation of GAAP (reported) results to non-GAAP (adjusted) results on a segmented basis.
$ millions, for the year ended October 31, 2019
Canadian
Personal
and Business
Banking
Canadian
Commercial
Banking
and Wealth
Management
U.S.
Commercial
Banking
and Wealth
Management
Capital
Markets
Corporate
and Other
CIBC
Total
U.S.
Commercial
Banking
and Wealth
Management
(US$ millions)
Operating results – reported
Total revenue $ 8,240 $ 4,027 $ 1,911 $ 3,475 $ 958 $ 18,611 $ 1,438
Provision for (reversal of) credit losses 889 163 73 160 1 1,286 55
Non-interest expenses 4,459 2,106 1,114 1,802 1,375 10,856 838
Income (loss) before income taxes 2,892 1,758 724 1,513 (418) 6,469 545
Income taxes 766 471 76 396 (361) 1,348 58
Net income (loss) 2,126 1,287 648 1,117 (57) 5,121 487
Net income attributable to non-controlling interests – – – – 25 25 –
Net income (loss) attributable to equity shareholders 2,126 1,287 648 1,117 (82) 5,096 487
Diluted EPS ($)
(1)
$ 5.60
Impact of items of note
(2)
Revenue
Settlement of certain income tax matters $ – $ – $ – $ – $ (67) $ (67) $ –
Purchase accounting adjustments
(3)
– – (34) – – (34) (26)
Impact of items of note on revenue – – (34) – (67) (101) (26)
Non-interest expenses
Amortization of acquisition-related intangible assets (9) (1) (88) – (11) (109) (66)
Transaction and integration-related costs as well as
purchase accounting adjustments
(3)
– – – – 11 11 –
Increase in legal provisions – – – – (28) (28) –
Goodwill impairment charge related to our controlling
interest in CIBC FirstCaribbean – – – – (135) (135) –
Charge for payment made to Air Canada, including
related sales tax and transaction costs (227) – – – – (227)
–
Impact of items of note on non-interest expenses (236) (1) (88) – (163) (488) (66)
Total pre-tax impact of items of note on net income 236 1 54 – 96 387 40
Income taxes
Amortization of acquisition-related intangible assets 2 – 23 – 2 27 17
Transaction and integration-related costs as well as
purchase accounting adjustments
(3)
– – (9) – (3) (12) (7)
Increase in legal provisions – – – – 7 7 –
Settlement of certain income tax matters – – – – (18) (18) –
Charge for payment made to Air Canada, including
related sales tax and transaction costs 60 – – – – 60 –
Impact of items of note on income taxes 62 – 14 – (12) 64 10
Total after-tax impact of items of note on net income $ 174 $ 1 $ 40 $ – $ 108 $ 323 $ 30
Impact of items of note on diluted EPS ($)
(1)
$ 0.36
Operating results – adjusted
(4)
Total revenue – adjusted
(5)
$ 8,240 $ 4,027 $ 1,877 $ 3,475 $ 891 $ 18,510 $ 1,412
Provision for (reversal of) credit losses – adjusted 889 163 73 160 1 1,286 55
Non-interest expenses – adjusted 4,223 2,105 1,026 1,802 1,212 10,368 772
Income (loss) before income taxes – adjusted 3,128 1,759 778 1,513 (322) 6,856 585
Income taxes – adjusted 828 471 90 396 (373) 1,412 68
Net income – adjusted 2,300 1,288 688 1,117 51 5,444 517
Net income attributable to non-controlling interests –
adjusted – – – – 25 25 –
Net income attributable to equity shareholders –
adjusted
2,300 1,288 688 1,117 26 5,419 517
Adjusted diluted EPS ($)
(1)
$ 5.96
See previous pages for footnote references.
18 CIBC 2022 ANNUAL REPORT

Management’s discussion and analysis
The following table provides a reconciliation of GAAP (reported) results to non-GAAP (adjusted) results on a segmented basis.
$ millions, for the year ended October 31, 2018
Canadian
Personal
and Business
Banking
Canadian
Commercial
Banking
and Wealth
Management
U.S.
Commercial
Banking
and Wealth
Management
Capital
Markets
Corporate
and Other
CIBC
Total
U.S.
Commercial
Banking
and Wealth
Management
(US$ millions)
Operating results – reported
Total revenue $ 8,595 $ 3,836 $ 1,760 $ 2,935 $ 708 $ 17,834 $ 1,366
Provision for (reversal of) credit losses 741 5 79 (30) 75 870 61
Non-interest expenses 4,395 2,067 1,023 1,492 1,281 10,258 794
Income (loss) before income taxes 3,459 1,764 658 1,473 (648) 6,706 511
Income taxes 919 478 97 387 (459) 1,422 75
Net income (loss) 2,540 1,286 561 1,086 (189) 5,284 436
Net income attributable to non-controlling interests – – – – 17 17 –
Net income (loss) attributable to equity shareholders 2,540 1,286 561 1,086 (206) 5,267 436
Diluted EPS ($)
(1)
$ 5.82
Impact of items of note
(2)
Revenue
Purchase accounting adjustments
(3)
$ – $ – $ (55) $ – $ (8) $ (63) $ (43)
Incremental losses on debt securities and loans in
CIBC FirstCaribbean resulting from the Barbados
government debt restructuring – – – – 61 61 –
Impact of items of note on revenue – – (55) – 53 (2) (43)
Provision for (reversal of) credit losses
Incremental losses on debt securities and loans in
CIBC FirstCaribbean resulting from the Barbados
government debt restructuring – – – – (28) (28) –
Impact of items of note on provision for (reversal of)
credit losses – – – – (28) (28) –
Non-interest expenses
Amortization of acquisition-related intangible assets (12) (1) (91) – (11) (115) (71)
Transaction and integration-related costs as well as
purchase accounting adjustments
(3)
– – – – (79) (79) –
Impact of items of note on non-interest expenses (12) (1) (91) – (90) (194) (71)
Total pre-tax impact of items of note on net income 12 1 36 – 171 220 28
Income taxes
Amortization of acquisition-related intangible assets 3 – 26 – 1 30 21
Transaction and integration-related costs as well as
purchase accounting adjustments
(3)
– – (17) – 2 (15) (13)
Increase in legal provisions – – – – – – –
Incremental losses on debt securities and loans in
CIBC FirstCaribbean resulting from the Barbados
government debt restructuring – – – – 19 19 –
Charge from net tax adjustments resulting from U.S.
tax reforms – – – – (88) (88) –
Impact of items of note on income taxes 3 – 9 – (66) (54) 8
Total after-tax impact of items of note on net income 9 1 27 – 237 274 20
After-tax impact of items of note on non-controlling
interests – – – – 5 5 –
After-tax impact of items of note on net income
attributable to equity shareholders $ 9 $ 1 $ 27 $ – $ 232 $ 269 $ 20
Impact of items of note on diluted EPS ($)
(1)
$ 0.29
Operating results – adjusted
(4)
Total revenue – adjusted
(5)
$ 8,595 $ 3,836 $ 1,705 $ 2,935 $ 761 $ 17,832 $ 1,323
Provision for (reversal of) credit losses – adjusted 741 5 79 (30) 47 842 61
Non-interest expenses – adjusted 4,383 2,066 932 1,492 1,191 10,064 723
Income (loss) before income taxes – adjusted 3,471 1,765 694 1,473 (477) 6,926 539
Income taxes – adjusted 922 478 106 387 (525) 1,368 83
Net income – adjusted 2,549 1,287 588 1,086 48 5,558 456
Net income attributable to non-controlling interests –
adjusted – – – – 22 22 –
Net income attributable to equity shareholders –
adjusted 2,549 1,287 588 1,086 26 5,536 456
Adjusted diluted EPS ($)
(1)
$ 6.11
See previous pages for footnote references.
CIBC 2022 ANNUAL REPORT 19

Management’s discussion and analysis
The following table provides a reconciliation of GAAP (reported) net income to non-GAAP (adjusted) pre-provision, pre-tax earnings on a
segmented basis.
$ millions, for the year ended October 31
Canadian
Personal
and Business
Banking
Canadian
Commercial
Banking
and Wealth
Management
U.S.
Commercial
Banking
and Wealth
Management
Capital
Markets
Corporate
and Other
CIBC
Total
U.S.
Commercial
Banking
and Wealth
Management
(US$ millions)
2022 Net income (loss) $ 2,249 $ 1,895 $ 760 $ 1,908 $ (569) $ 6,243 $ 588
Add: provision for (reversal of) credit losses 876 23 218 (62) 2 1,057 169
Add: income taxes 809 680 151 718 (628) 1,730 117
Pre-provision (reversal), pre-tax
earnings (losses)
(1)
3,934 2,598 1,129 2,564 (1,195) 9,030 874
Pre-tax impact of items of note
(2)(3)
105 – 68 – 185 358 53
Adjusted pre-provision (reversal), pre-tax
earnings (losses)
(4)
$ 4,039 $ 2,598 $ 1,197 $ 2,564 $ (1,010) $
9,388 $ 927
2021 Net income (loss) $ 2,494 $ 1,665 $ 926 $ 1,857 $ (496) $ 6,446 $ 739
Add: provision for (reversal of) credit losses 350 (39) (75) (100) 22 158 (61)
Add: income taxes 892 601 222 646 (485) 1,876 177
Pre-provision (reversal), pre-tax
earnings (losses)
(1)
3,736 2,227 1,073 2,403 (959) 8,480 855
Pre-tax impact of items of note
(2)
12 – 68 – 245 325 54
Adjusted pre-provision (reversal), pre-tax
earnings (losses)
(4)
$ 3,748 $ 2,227 $ 1,141 $ 2,403 $ (714) $ 8,805 $ 909
2020 Net income (loss) $ 1,785 $ 1,202 $ 375 $ 1,308 $ (878) $ 3,792 $ 282
Add: provision for (reversal of) credit losses 1,189 303 487 311 199 2,489 358
Add: income taxes 640 437 55 505 (539) 1,098 42
Pre-provision (reversal), pre-tax
earnings (losses)
(1)
3,614 1,942 917 2,124 (1,218) 7,379 682
Pre-tax impact of items of note
(2)
8 1 83 – 705 797 62
Adjusted pre-provision (reversal), pre-tax
earnings (losses)
(4)
$ 3,622 $ 1,943 $ 1,000 $ 2,124 $ (513) $ 8,176 $ 744
2019 Net income (loss) $ 2,126 $ 1,287 $ 648 $ 1,117 $ (57) $ 5,121 $ 487
Add: provision for (reversal of) credit losses 889 163 73 160 1 1,286 55
Add: income taxes 766 471 76 396 (361) 1,348 58
Pre-provision (reversal), pre-tax
earnings (losses)
(1)
3,781 1,921 797 1,673 (417) 7,755 600
Pre-tax impact of items of note
(2)
236 1 54 – 96 387 40
Adjusted pre-provision (reversal), pre-tax
earnings (losses)
(4)
$ 4,017 $ 1,922 $ 851 $ 1,673 $ (321) $ 8,142 $ 640
2018 Net income (loss) $ 2,540 $ 1,286 $ 561 $ 1,086 $ (189) $ 5,284 $ 436
Add: provision for (reversal of) credit losses 741 5 79 (30) 75 870 61
Add: income taxes 919 478 97 387 (459) 1,422 75
Pre-provision (reversal), pre-tax
earnings (losses)
(1)
4,200 1,769 737 1,443 (573) 7,576 572
Pre-tax impact of items of note
(2)
12 1 36 – 171 220 28
Adjusted pre-provision (reversal), pre-tax
earnings (losses)
(4)
$ 4,212 $ 1,770 $ 773 $ 1,443 $ (402) $ 7,796 $ 600
(1) Non-GAAP measure.
(2) Items of note are removed from reported results to calculate adjusted results.
(3) Excludes the impact of the provision for credit losses for performing loans from the acquisition of the Canadian Costco credit card portfolio, as the amount is included in
the add back of provision for (reversal of) credit losses.
(4) Adjusted to exclude the impact of items of note. Adjusted measures are non-GAAP measures.
20 CIBC 2022 ANNUAL REPORT

Management’s discussion and analysis
Strategic business units overview
CIBC has four SBUs – Canadian Personal and Business Banking, Canadian Commercial Banking and Wealth Management, U.S. Commercial
Banking and Wealth Management, and Capital Markets. These SBUs are supported by the following functional groups – Technology, Infrastructure
and Innovation, Risk Management, People, Culture and Brand, Finance and Enterprise Strategy, as well as other support groups, which all are
included within Corporate and Other. The expenses of these functional and support groups are generally allocated to the business lines within the
SBUs. The majority of the functional and support costs of CIBC Bank USA are recognized directly in the U.S. Commercial Banking and Wealth
Management SBU. Corporate and Other also includes the results of CIBC FirstCaribbean and other strategic investments, as well as other income
statement and balance sheet items not directly attributable to the business lines.
Business unit allocations
Revenue, expenses, and other balance sheet resources related to certain activities are generally allocated to the lines of business within the SBUs.
Treasury activities impact the financial results of the SBUs. Each line of business within our SBUs is charged or credited with a market-based
cost of funds on assets and liabilities, respectively, which impacts the revenue performance of the SBUs. This market-based cost of funds takes into
account the cost of maintaining sufficient regulatory capital to support business requirements, including the cost of preferred shares. Once the
interest and liquidity risks inherent in our client-driven assets and liabilities are transfer priced into Treasury, they are managed within CIBC’s risk
framework and limits. Capital is attributed to the SBUs based on the estimated amount of regulatory capital required to support their businesses,
which is intended to consistently measure and align the costs with the underlying benefits and risks associated with SBU activities. Earnings on
unattributed capital remain in Corporate and Other. We review our transfer pricing methodologies on an ongoing basis to ensure they reflect
changing market environments and industry practices.
We use a Product Owner/Customer Segment/Distributor Channel allocation management model to measure and report the results of
operations of various lines of business within our SBUs. The model uses certain estimates and methodologies to process internal transfers between
the impacted lines of business for sales, renewals and trailer commissions as well as certain attributable costs. Periodically, the sales, renewals and
trailer commission rates paid to customer segments for certain products/services are revised and applied prospectively.
The non-interest expenses of the functional and support groups are generally allocated to the business lines within the SBUs based on
appropriate criteria and methodologies. The basis of allocation is reviewed periodically to reflect changes in support to business lines. Other costs
not directly attributable to business lines remain in Corporate and Other.
We recognize provision for credit losses on both impaired (stage 3) and performing (stages 1 and 2) loans in the respective SBUs.
Revenue, taxable equivalent basis
Certain SBUs evaluate revenue on a TEB. In order to arrive at the TEB amount, the SBUs gross up tax-exempt revenue on certain securities to a
TEB, being the amount of fully taxable revenue, which, were it to have incurred tax at the statutory income tax rate, would yield the same after-tax
revenue. Simultaneously, an equivalent amount is booked as an income tax expense resulting in no impact on the net income of the SBUs. This
measure enables comparability of revenue arising from both taxable and tax-exempt sources. The total TEB adjustments of the SBUs are offset in
revenue and income tax expense in Corporate and Other.
CIBC 2022 ANNUAL REPORT 21

Management’s discussion and analysis
Canadian Personal and Business Banking
Canadian Personal and Business Banking provides personal and business clients across Canada with financial advice, services and solutions
through banking centres, as well as mobile and online channels to help make their ambitions a reality.
Our business strategy
We are focused on helping our clients achieve their ambitions, and delivering sustainable, market-leading performance. To achieve this, our
strategy continues to comprise three key priorities:
• Introducing more opportunities for our clients to deal with us digitally by investing in digital and real-time remote capabilities;
• Providing our team with the tools to deliver an excellent experience for our clients consistent with a one-team approach; and
• Delivering personalized advice to our clients in a way that is meaningful and relevant to each of them.
2022 progress
In 2022, we demonstrated positive momentum, with our strongest net client growth since 2017, as we welcomed new clients to our bank. Looking at
our client experience, we improved to 2nd place in the J.D. Power Client Satisfaction survey, up from 5th last year. In addition, we continued to
narrow our primary clients’ net promoter score gap to the leader in the Ipsos Customer Satisfaction Index study. With excellent revenue
diversification, we remained focused on generating high-value growth despite headwinds. We drove unprecedented growth in our everyday bank
account openings and leading market share growth in lending. We also continued to support our clients’ homeownership ambitions by enhancing
the mortgage origination and renewal process, and helping them navigate rising interest rates. We will maintain focus on our three strategic priorities
and build on our 2022 momentum and success.
Introducing more opportunities for our clients to deal with us digitally
• Ranked #1 in Online Banking Satisfaction by J.D. Power and recognized by Digital Banker for Outstanding Digital Client Experience in Mobile
Banking as well as for using in-house research and client feedback to improve digital journeys.
• Introduced CIBC Smart Start, our enhanced youth and student banking offer which provides market-leading value. Clients can open a new
account digitally and enjoy no-fee banking, including free direct investing through CIBC Investor’s Edge, until the age of 25.
• Announced a strategic investment to bring a new merchant services platform called Tyl by CIBC to Canada.
• Delivered a market-leading Interac e-Transfer feature, enabling clients to set recurring or future-dated e-Transfer payments.
• Announced a new collaboration with Willful, a digital solution for estate planning, making financial planning easier and affordable for clients.
• Introduced more digital options for clients to renew their mortgage online, including an enhanced online pre-qualification tool.
• Improved the digital onboarding experience allowing clients to start banking within minutes by adding a digital debit card to their mobile wallet
and automatically linking new cards to their profiles.
Providing our team with the tools to deliver an excellent experience for our clients
• Ranked #1 on Investment Executive 2022 Report Card on Banks, for the seventh consecutive year.
• Announced an agreement with nCino, to digitize the end-to-end account open and lending experience for both business clients and team
members.
• Introduced accessible credit, debit and Smart prepaid card sleeves for clients who are blind, have low vision or specific conditions such as
glaucoma, including the card name, number and expiry
date in braille or larger print.
• Launched Smart Interest on the CIBC eAdvantage Savings Account for clients who save $200 or more each month.
• Welcomed more than two million Costco Mastercard clients and focused on ensuring they were successfully
transitioned to their new card.
• Demonstrated our commitment to inclusion by hosting our first virtual Global Accessibility Awareness Day, sponsoring the MaRS CIBC
Inclusive
Design Challenge, and removing barriers to services and products for underserved clients including seniors and persons with
disabilities.
Delivering personalized advice to our clients in a way that is meaningful and relevant to each of them
• Named in The Globe and Mail’s 2022 Best B2B Brands for our client engagement throughout the pandemic.
• Launched the CIBC Black Entrepreneur Program, which includes a $15 million commitment
for business loans of up to $250,000 to accelerate
the start-up and growth of their businesses.
• Improved the mortgage experience by engaging clients ahead of prime rate increases to help them manage rising interest rates.
• Supported displaced Ukrainians with our newcomer banking offer, helped them find Ukrainian-speaking advisors, and provided welcome kits.
• Helped clients learn how to integrate climate action into their everyday lives through our new CIBC Climate Centre on cibc.com, which
provides a number of insights on saving energy and how to have a positive impact on the environment.
2022 financial review
Revenue
($ billions)
21 22
8.9
8.2
Net income
($ millions)
2,494
2,249
21 22
Operating leverage
(%)
0.4
(3.4)
21
22
Average loans and
acceptances
(1)(2)
($ billions)
302.1
270.3
21 22
Average deposits
(2)
($ billions)
204.0
187.9
21 22
(1) Loan amounts are stated before any related allowances.
(2) Average balances are calculated as a weighted average of daily closing balances.
22 CIBC 2022 ANNUAL REPORT

Management’s discussion and analysis
Our focus for 2023
In Canadian Personal and Business Banking our objective is to deliver sustainable, market-leading performance with a focus on helping our clients
achieve their ambitions. Our strategy remains centred on three key priorities:
• Deliver personalized advice to our clients in a way that is meaningful to them;
• Introduce more opportunities for our clients to deal with us digitally; and
• Provide our team with the tools to deliver an excellent experience for our clients.
Results
(1)
$ millions, for the year ended October 31 2022 2021
Revenue $ 8,909 $ 8,150
Provision for (reversal of) credit losses
Impaired 534 484
Performing 342 (134)
Provision for credit losses 876 350
Non-interest expenses 4,975 4,414
Income before income taxes 3,058 3,386
Income taxes 809 892
Net income $ 2,249 $ 2,494
Net income attributable to:
Equity shareholders $ 2,249 $ 2,494
Total revenue
Net interest income $ 6,657 $ 5,954
Non-interest income
(2)
2,252 2,196
$ 8,909 $ 8,150
Net interest margin on average
interest-earning assets
(3)(4)
2.21 % 2.21 %
Efficiency ratio 55.8 % 54.2 %
Operating leverage (3.4)% 0.4 %
Return on equity
(5)
28.2 % 38.1 %
Average allocated common equity
(5)
$ 7,987 $ 6,554
Average assets ($ billions)
(3)
$ 305.1 $ 272.6
Average loans and acceptances ($ billions)
(3)
$ 302.1 $ 270.3
Average deposits ($ billions)
(3)
$ 204.0 $ 187.9
Full-time equivalent employees 13,840 12,629
(1) For additional segmented information, see Note 30 to the consolidated financial statements.
(2) Includes intersegment revenue, which represents internal sales commissions and revenue allocations under the Product Owner/Customer Segment/Distributor Channel
allocation management model.
(3) Average balances are calculated as a weighted average of daily closing balances.
(4) For additional information on the composition, see the “Glossary” section.
(5) For additional information, see the “Non-GAAP measures” section.
Financial overview
Net income was down $245 million or 10% from 2021, primarily due to higher non-interest expenses and a higher provision for credit losses, partially
offset by higher revenue.
Revenue
Revenue was up $759 million or 9% from 2021, primarily due to volume growth and higher fee income.
Net interest income was up $703 million or 12% from 2021, primarily due to deposit and loan growth, including from the acquisition of the Canadian
Costco credit card portfolio. Non-interest income was up $56 million or 3% from 2021, primarily due to higher fee income.
Net interest margin on average interest-earning assets was comparable with 2021, mainly due to higher deposit margins and the impact of the
Canadian Costco credit card portfolio, partially offset by lower loan margins.
Provision for credit losses
Provision for credit losses was up $526 million or 150% from 2021. The current year included a provision for credit losses on performing loans
mainly due to an unfavourable change in our economic outlook and the acquisition of the Canadian Costco credit card portfolio, while the prior year
included a provision reversal due to a favourable change in our economic outlook driven by the recovery from the COVID-19 pandemic. Provision
for credit losses on impaired loans was up due to higher provisions reflective of higher impaired balances, with write-offs being comparable to the
prior year.
Non-interest expenses
Non-interest expenses were up $561 million or 13% from 2021, primarily due to higher spending on strategic initiatives, including the Canadian
Costco credit card portfolio, and higher employee-related compensation.
Income taxes
Income taxes were down $83 million or 9% from 2021, primarily due to lower income.
Average assets
Average assets were up $32.5 billion or 12% from 2021, primarily due to growth in residential mortgages, as well as the acquisition of the Canadian
Costco credit card portfolio.
CIBC 2022 ANNUAL REPORT 23

Management’s discussion and analysis
Canadian Commercial Banking and Wealth Management
Canadian Commercial Banking and Wealth Management provides high-touch, relationship-oriented banking and wealth management services to
middle-market companies, entrepreneurs, high-net-worth individuals and families across Canada, as well as asset management services to
institutional investors.
Our business strategy
We are focused on building and enhancing client relationships, being Canada’s leader in financial advice and generating long-term consistent
growth. To deliver on this, our three key strategic priorities continue to be:
• Delivering risk-controlled growth in our Commercial Bank;
• Accelerating the growth of Private Wealth; and
• Evolving our Asset Management business.
2022 progress
In 2022, we had positive momentum on our client-focused journey and delivered strong growth across our SBU. As the economic environment
continued to evolve, our purpose-driven culture, combined with the bank’s solid capital position and disciplined risk and expense management
approach, helped us to deliver consistent financial performance. In Commercial Banking, we had strong demand for both loans and deposits, and
we continue to streamline and simplify the digital experience for our clients. In Private Wealth, we made progress on our growth trajectory with a key
focus on advisor support programs and new technology. In Asset Management, we further incorporated a comprehensive ESG framework into all
actively managed investment strategies. And finally, we had strong referral momentum across our internal teams resulting in deeper client
relationships and reinforcing our commitment to helping our clients achieve their ambitions.
Delivering risk-controlled growth in our Commercial Bank
• Improved client and employee experience by modernizing our systems and streamlining processes.
• Continued to enhance programs tailored to high-growth industries through our National Industries Program team including centralized
marketing and tools to support enriched client conversations.
• Further expanded CIBC Innovation Banking across North America, providing strategic advice, cash management and funding to technology
and life science companies at each stage of their business cycle.
• Launched dedicated Commercial Banking Inclusion and Diversity and ESG committees, including training modules on addressing gender bias
and the importance of an inclusive workplace and inclusive client interactions.
Accelerating the growth of Private Wealth
• Investment Executive Brokerage Report Card ranked CIBC second overall among the Big 6 banks in 2022.
• Launched exclusive private banking offers for entrepreneurs, executives, and their children to onboard new relationships, and deepen existing
ones.
• Deepened client relationships through increased financial planning and the onboarding of new Wealth Planning Professionals to further
support our integrated wealth offer and help clients achieve their ambitions, resulting in a 40% increase versus last year with over 4,500 plans
delivered, contributing an additional $4 billion in AUA.
• Created a new program to increase partner referrals across the bank to help clients fulfill their broader wealth needs.
• Achieved 57% higher net flows versus last year in CIBC Wood Gundy related to an ongoing client-focused approach and commitments to
financial planning.
• Launched refreshed competitive recruiting programs to build capacity and gain market share, including an Associate Development Program to
enhance career and succession planning.
• Created frontline capacity through streamlined credit processes and centralizing administrative functions.
• Launched digital signature with our CIBC Wood Gundy and CIBC Private Investment Counsel for account openings and maintenance
activities.
• The Globe and Mail named 30 CIBC Wood Gundy advisors to Canada’s Top Wealth Advisors list with three advisors ranked in the top 10.
Evolving our Asset Management business
• Ranked #3 among Big 6 banks in long-term mutual fund sales as a percent of AUM.
• Launched CIBC Asset Management (CAM) Chartered Financial Analyst (CFA) Indigenous Scholarship for individuals in our communities that
identify as Indigenous who are working towards completing their CFA designation.
• Announced a three-year partnership with the new Ivey School of Business Women in Asset Management Program designed to overcome the
under representation of individuals who self-identify as women in asset management, including an introduction to career opportunities, and
CIBC Asset Management internships.
• Incorporated a climate policy in CAM’s Responsible Investing Policy.
• Launched inaugural CAM Annual ESG & Stewardship Report which includes tracking climate-specific company engagements.
• Continued to create new efficiencies and enhance the client experience, including launching the first phase of our investment platform
simplification to further streamline account structures, improve onboarding and client reporting and provide enhanced portfolio management
capabilities for advisors.
• Launched several alternative investment products for Private Wealth clients and launched two PIMCO bond funds for Private Wealth and
Personal and Business Banking clients.
24 CIBC 2022 ANNUAL REPORT

Management’s discussion and analysis
2022 financial review
Revenue
($ billions)
5.3
4.7
21 22
Net income
($ millions)
1,895
1,665
21 22
Operating leverage
(%)
3.8
1.2
21 22
Average loans
(1)(2)
($ billions)
87.6
72.8
21 22
Average deposits
(2)
($ billions)
94.0
83.6
21 22
Average commercial
banking loans
(1)(2)(3)
($ billions)
85.0
70.7
21 22
Average commercial
banking deposits
(2)
($ billions)
85.0
75.3
21 22
Assets under
administration and
management
(4)
($ billions)
356.6
324.5
230.3
208.8
21 22
AUM
Canadian retail mutual
funds and exchange-
traded funds
($ billions)
135.0
119.9
21 22
(1) Loan amounts are stated before any related allowances.
(2) Average balances are calculated as a weighted average of daily closing balances.
(3) Comprises loans and acceptances and notional amount of letters of credit.
(4) AUM amounts are included in the amounts reported under AUA.
Our focus for 2023
In Commercial Banking and Wealth Management, our ambition is to become the leader in financial advice to both personal and business clients. We
remain focused on three strategic priorities:
• Delivering risk-controlled growth in our Commercial Bank, while fostering strong referrals across CIBC;
• Accelerating the growth of Private Wealth to deepen client relationships; and
• Evolving our Asset Management business to increase connectivity within our own bank channels and to launch new technologies to support
clients and advisors.
CIBC 2022 ANNUAL REPORT 25

Management’s discussion and analysis
Results
(1)
$ millions, for the year ended October 31 2022 2021
Revenue
Commercial banking $ 2,278 $ 1,827
Wealth management 2,976 2,843
Total revenue 5,254 4,670
Provision for (reversal of) credit losses
Impaired 22 6
Performing 1 (45)
Provision for (reversal of) credit losses 23 (39)
Non-interest expenses 2,656 2,443
Income before income taxes 2,575 2,266
Income taxes 680 601
Net income $ 1,895 $ 1,665
Net income attributable to:
Equity shareholders $ 1,895 $ 1,665
Total revenue
Net interest income $ 1,672 $ 1,291
Non-interest income
(2)
3,582 3,379
$ 5,254 $ 4,670
Net interest margin on average interest-earning assets
(3)(4)
3.37 %
3.25 %
Efficiency ratio 50.5 %
52.3 %
Operating leverage 3.8 %
1.2 %
Return on equity
(5)
22.9 %
24.5 %
Average allocated common equity
(5)
$
8,275
$
6,794
Average assets ($ billions)
(3)
$
84.7
$
70.1
Average loans ($ billions)
(3)
$
87.6
$
72.8
Average deposits ($ billions)
(3)
$
94.0
$
83.6
AUA ($ billions) $
324.5
$
356.6
AUM ($ billions) $
208.8
$
230.3
Full-time equivalent employees
5,711
5,241
(1) For additional segmented information, see Note 30 to the consolidated financial statements.
(2) Includes intersegment revenue, which represents internal sales commissions and revenue allocations under the Product Owner/Customer Segment/Distributor Channel
allocation management model.
(3) Average balances are calculated as a weighted average of daily closing balances.
(4) For additional information on the composition, see the “Glossary” section.
(5) For additional information, see the “Non-GAAP measures” section.
Financial overview
Net income was up $230 million or 14% from 2021, primarily due to higher revenue, partially offset by higher non-interest expenses and a provision
for credit losses in the current year compared with a provision reversal in the prior year.
Revenue
Revenue was up $584 million or 13% from 2021.
Commercial banking revenue was up $451 million or 25%, primarily due to higher net interest income from loan and deposit growth, higher deposit
spreads that benefitted from the rising interest rate environment, and higher fees.
Wealth management revenue was up $133 million or 5%, primarily due to higher fee-based revenue driven by higher average AUA and AUM
reflecting market appreciation and the impact of net sales, and higher net interest income, mainly from deposits, partially offset by lower commission
revenue from decreased client activity.
Net interest margin on average interest-earning assets was up 12 basis points primarily due to higher deposit margins, partially offset by lower loan
margins.
Provision for (reversal of) credit losses
Provision for credit losses was up $62 million or 159% from 2021. The current year included a small provision for credit losses on performing loans,
while the prior year included a provision reversal due to a favourable change in our economic outlook driven by the recovery from the COVID-19
pandemic. Provision for credit losses on impaired loans was up mainly attributable to the education, health and social services sector.
Non-interest expenses
Non-interest expenses were up $213 million or 9% from 2021, primarily due to higher spending on strategic initiatives, and higher performance-
based and employee-related compensation.
Income taxes
Income taxes were up $79 million or 13% from 2021, primarily due to higher income.
Average assets
Average assets were up $14.6 billion or 21% from 2021, primarily due to growth in commercial loans.
Assets under administration
AUA on a spot basis were down $32.1 billion or 9% from 2021, primarily due to market depreciation. AUM amounts are included in the amounts
reported under AUA.
26 CIBC 2022 ANNUAL REPORT

Management’s discussion and analysis
U.S. Commercial Banking and Wealth Management
U.S. Commercial Banking and Wealth Management provides high-touch, relationship-oriented banking and wealth management services across the
U.S., focused on middle-market and mid-corporate companies, entrepreneurs, high-net-worth individuals and families, as well as personal and
small business banking services in four U.S. Midwestern markets.
Our business strategy
Our goal is to grow our purpose-built U.S. commercial and wealth management franchise focused on the private economy and high-growth client
segments through a focus on organic growth and seamless connectivity to our Capital Markets and Canadian Commercial Banking and Wealth
Management franchises. Our key strategic priorities continue to be:
• Building and deepening client relationships;
• Strengthening and diversifying our deposit base;
• Improving efficiency through data and technology; and
• Advancing the growth and transformation of
our business.
2022 progress
In 2022, our continued focus on deep-rooted relationship banking continues to attract new clients and at the same time provides us with opportunities
to do more with existing clients. As a result, we drove strong loan, deposit and AUM/AUA net flows. Investments in our business to support growth
allow us to continue to expand the products and services we offer, improve processes and technology and meet client needs.
Building and deepening client relationships
• Drove solid loan and deposit growth, including continued expansion of our private banking business with existing commercial and wealth
clients.
• Generated strong growth in AUM and AUA net flows, which helped to offset the impact of volatile investment markets during the year.
• Leveraged our strong partnership with our Capital Markets franchise to provide a wider range of products and services to U.S. commercial
and wealth clients.
• Ranked as a Top Ten Registered Investment Advisor by Barron’s for the third consecutive year.
Strengthening and diversifying our deposit base
• Maintained a diversified funding strategy through our commercial, private banking and retail clients.
• Continued growth in private banking.
• Expanded deposit gathering, including leveraging
the rising rate environment to attract new clients to our CIBC Agility online savings platform.
Improving efficiency through data and technology
• Advanced the implementation of customer relationship management and data strategy initiatives to further the connectivity between teams,
provide a consolidated view of our businesses and support a strong risk management infrastructure.
• Continued to refine client-facing processes making it easier for clients to bank with us, including launching the Zelle
®
person-to-person
payment platform.
• Began implementation of a consolidated wealth management system to improve client service.
Advancing the growth and transformation of our business
• Expanded Commercial Banking industry specialties with the launch of Equipment Financing, and added Junior Debt lending and advisory
services.
• Further enhanced our risk and change management infrastructure to support our growth.
2022 financial review
Revenue
(US$ billions)
1.9
1.7
21 22
Net income
($ millions)
926
760
21
22
Net income
(US$ millions)
739
588
21 22
Operating leverage
(% in U.S. dollars)
8.5
(6.3)
21
22
CIBC 2022 ANNUAL REPORT 27

Management’s discussion and analysis
Average loans
(1)(2)
(US$ billions)
37.4
33.0
21 22
Average deposits
(2)
(US$ billions)
35.3
33.0
21 22
Average commercial
banking loans
(1)(2)
(US$ billions)
33.0
27.9
21
22
Assets under administration
and management
(3)
(US$ billions)
100.6
77.9
68.4
AUM
88.8
21 22
(1) Loan amounts are stated before any related allowances.
(2) Average balances are calculated as a weighted average of daily closing balances.
(3) AUM amounts are included in the amounts reported under AUA.
Our focus for 2023
To build on our momentum across U.S. Commercial Banking and Wealth Management, we will continue to focus on helping our clients achieve their
ambitions by:
• Growing Commercial Banking by delivering expertise and unique solutions leveraging the strength of our franchise to provide lending and
deposit services;
• Expanding Private Wealth and Private Banking with the high-net-worth and ultra-high-net-worth segments, and in fast-growing markets; and
• Investing in people, technology and infrastructure to scale our platform, strengthen our risk management capabilities, enhance data-driven
decision making and create greater efficiencies.
Results in Canadian dollars
(1)
$ millions, for the year ended October 31 2022 2021
Revenue
Commercial banking $ 1,613 $ 1,444
Wealth management
(2)
844 750
Total revenue
(3)
2,457 2,194
Provision for (reversal of) credit losses
Impaired 113 104
Performing 105 (179)
Provision for (reversal
of) credit losses 218 (75)
Non-interest expenses 1,328 1,121
Income before income taxes 911 1,148
Income taxes 151 222
Net income $ 760 $ 926
Net income attributable to:
Equity shareholders $ 760 $ 926
Total revenue
(3)
Net interest income $ 1,655 $ 1,449
Non-interest income 802 745
$ 2,457 $ 2,194
Average allocated common equity
(5)
$ 10,422 $ 8,975
Average assets ($ billions)
(4)
$ 54.0 $ 46.7
Average loans ($ billions)
(4)
$ 48.3 $ 41.4
Average deposits ($ billions)
(4)
$ 45.6 $ 41.4
AUA ($ billions)
(6)
$ 121.0 $ 124.5
AUM ($ billions)
(6)
$ 93.2 $ 96.4
Full-time equivalent employees 2,472 2,170
(1) For additional segmented information, see Note 30 to the consolidated financial statements.
(2) Includes revenue related to the U.S. Paycheck Protection Program.
(3) Included $8 million of income relating to the accretion of the acquisition date fair value discount on the acquired loans of The PrivateBank (2021: $15 million).
(4) Average balances are calculated as a weighted average of daily closing balances.
(5) For additional information, see the “Non-GAAP measures” section.
(6) Includes certain Canadian Commercial Banking and Wealth Management assets that U.S. Commercial Banking and Wealth Management provides sub-advisory services for.
28 CIBC 2022 ANNUAL REPORT

Management’s discussion and analysis
Results in U.S. dollars
(1)
US$ millions, for the year ended October 31 2022 2021
Revenue
Commercial banking $ 1,249 $ 1,151
Wealth management
(2)
653 597
Total revenue
(3)
1,902 1,748
Provision for (reversal of) credit losses
Impaired 87 82
Performing 82 (143)
Provision for (reversal of) credit losses 169 (61)
Non-interest expenses 1,028
893
Income before income taxes 705 916
Income taxes 117 177
Net income $ 588 $ 739
Net income attributable to:
Equity shareholders $ 588 $ 739
Total revenue
(3)
Net interest income
$ 1,281
$ 1,154
Non-interest income
621 594
$ 1,902
$ 1,748
Net interest margin on average interest-earning assets
(4)(5)
3.42 %
3.50 %
Efficiency ratio 54.0 %
51.1 %
Operating leverage (6.3)%
8.5 %
Return on equity
(4)
7.3 %
10.3 %
Average allocated common equity
(6)
$
8,066
$
7,149
Average assets ($ billions)
(4)
$
41.7
$
37.2
Average loans ($ billions)
(4)
$
37.4
$
33.0
Average deposits ($ billions)
(4)
$
35.3
$
33.0
AUA ($ billions)
(7)
$
88.8
$
100.6
AUM ($ billions)
(7)
$
68.4
$
77.9
(1) For additional segmented information, see Note 30 to the consolidated financial statements.
(2) Includes revenue related to the U.S. Paycheck Protection Program.
(3) Included US$6 million of income relating to the accretion of the acquisition date fair value discount on the acquired loans of The PrivateBank (2021: US$12 million).
(4) Average balances are calculated as a weighted average of daily closing balances.
(5) For additional information on the composition, see the “Glossary” section.
(6) For additional information, see the “Non-GAAP measures” section.
(7) Includes certain Canadian Commercial Banking and Wealth Management assets that U.S. Commercial Banking and Wealth Management provides sub-advisory
services for.
Financial overview
Net income was down $166 million or 18% (US$151 million or 20%) from 2021, primarily due to a provision for credit losses in the current year
compared with a provision reversal in the prior year and higher non-interest expenses, partially offset by higher revenue.
Revenue
Revenue was up US$154 million or 9% from 2021.
Commercial banking revenue was up US$98 million or 9%, primarily due to higher net interest income from loan growth and higher fees from loan
syndication, partially offset by lower loan margins.
Wealth management revenue was up US$56 million or 9%, primarily due to higher net interest income from deposit growth, higher deposit margins,
and higher fee-based revenue driven by higher average AUA and AUM balances and net sales.
Net interest margin on average interest-earning assets was down 8 basis points, primarily due to lower loan margins, and lower loan repayment fees
due to the PPP, partially offset by higher deposit margins.
Provision for (reversal of) credit losses
The current year included a provision for credit losses of US$169 million, while the prior year included a provision reversal of US$61 million. The
current year included a provision for credit losses on performing loans due to unfavourable portfolio migration and model parameter updates, while
the prior year included a provision reversal due to a favourable change in our economic outlook driven by the recovery from the COVID-19
pandemic. Provision for credit losses on impaired loans was up due to higher provisions in the capital goods manufacturing sector, partially offset
by lower provisions in the real estate and construction sector.
Non-interest expenses
Non-interest expenses were up US$135 million or 15% from 2021, primarily due to higher employee-related and performance-based compensation,
and higher spending of US$94 million on strategic initiatives in support of growth in our commercial banking platform and infrastructure build in our
U.S. franchise.
Income taxes
Income taxes were down US$60 million or 34% from 2021, primarily due to lower income.
Average assets
Average assets were up US$4.5 billion or 12% from 2021, primarily due to growth in loans.
Assets under administration
AUA were down US$11.8 billion or 12% from 2021, primarily due to market depreciation, partially offset by net sales. AUM amounts are included in
the amounts reported under AUA.
CIBC 2022 ANNUAL REPORT 29

Management’s discussion and analysis
Capital Markets
Capital Markets provides integrated global markets products and services, investment banking advisory and execution, corporate banking solutions
and top-ranked research to our clients around the world. It includes Direct Financial Services which focuses on expanding CIBC’s digital
capabilities to provide a cohesive set of direct banking, direct investing and innovative multi-currency payment solutions for CIBC’s clients.
Our business strategy
Our goal is to deliver leading capital markets solutions to our North American and international clients by providing best-in-class insight, advice and
execution. To enable CIBC’s strategy and priorities, we collaborate with our partners across our bank to deepen and enhance client relationships.
Our three key strategic priorities continue to be:
• Delivering the leading capital markets platform in Canada to our core clients;
• Building a North American
client platform with global capabilities; and
• Focusing on connectivity to accelerate the growth of Direct Financial Services and deepen relationships across our bank.
2022 progress
In 2022, we continued to make progress on our strategic priorities with an emphasis on deepening client relationships, growing in the U.S. and
enhancing connectivity across the bank. Collectively, these efforts have built a well-diversified Capital Markets business that delivers consistent
performance and growth. Our growth in 2022 was enabled by our strong focus on our clients and favourable market conditions in Global Markets. In
addition, we further expanded our Direct Financial Services business to generate more recurring revenue and attract new clients seeking a
convenient, digitally-enabled banking and investing model.
Delivering the leading capital markets platform in Canada to our core clients
• Continued delivering industry-leading advice and capital markets solutions by expanding our Energy, Infrastructure and Transition group to
complement our existing platform and enable the transition to a lower carbon future.
• Strengthened our platform by continuing to invest in talent and technology, including investments in our talent and simplifying processes to
support our client-focused culture.
• Committed $100 million in limited partnership investments dedicated to investing in key climate tech and energy transition funds, driving the
development of new climate innovations.
• Announced multi-year partnerships with the University of Calgary, the Schulich School of Business, and McGill University, to help foster the
energy transition ecosystem and enable new ideas and develop a new generation of leaders.
Building a North American client platform with global capabilities
• Made a strategic investment in New York and London co-headquartered specialized private markets firm Sera Global, which is aligned with
our strategy to accelerate our momentum in the U.S.
• Achieved top 10 ranking in financing for the renewable industry across North America for transactions that closed from January 1, 2022 to
September 30, 2022 (North American Renewables League Tables by Inframation).
• Expanded Carbonplace (formally known as Project Carbon) with three new members, providing settlements infrastructure and systems for
marketplaces and exchanges in the voluntary carbon market, helping to enable the sustainability ambitions of our clients.
• Recipient of Global Finance’s North American Regional Awards for Outstanding Leadership in Transition & Sustainability Linked Bonds and for
Outstanding Leadership in Green Bonds.
• CIBC Cleary Gull was the recipient of M&A Atlas Americas Awards for Americas Industries Manufacturing Deal of the Year (Middle Market) and
USA Deal of the Year (Small Markets).
Focusing on connectivity to accelerate the growth of Direct Financial Services and deepen relationships across our bank
• Expanded our industry-first Canadian Depositary Receipts lineup as part of our ongoing commitment to developing innovative, market-based
solutions that meet investor needs.
• Broadened the banking services available to clients through Simplii Financial, becoming the first Canadian digital banking brand to offer
recurring and future-dated Interac e-Transfer transactions and establish a digital gift card marketplace, in addition to launching a U.S. dollar
savings account, partnerships with Visa Direct and MoneyGram, and winning Best Bank in Canada for Value for Money by Ipsos.
• Continued to enhance our offerings to clients within our Global Money Transfer platform, with services such as Cash Pickup and Digital Identity
Verification.
As a leading capital markets franchise in Canada and banking partner to our clients around the world, Capital Markets acted as:
• Financial advisor to Blackstone Infrastructure Partners on its US$3 billion equity investment in Invenergy Renewable Holdings LLC to
accelerate renewable development activities.
• Financial advisor to Innergex Renewable Energy Inc. on its acquisition of Aela Generación S.A. and Aela Energía SpA, one of Chile’s largest
independent power producers of renewable energy, for a transaction value of US$686 million; lead on a $173 million issue of common shares
and provision of acquisition credit facilities in support of the transaction; also, joint lead placement agent on a US$710 million dual tranche
private placement of senior notes for Aela Generación S.A. and assisted in the implementation of a financial risk management strategy.
• Financial advisor to Cameco Corporation on the acquisition of Westinghouse Electric Company, through a strategic partnership with Brookfield
Renewable Partners, for a transaction value of US$7.9 billion (closing expected in the second half of 2023); lead on a US$748 million issue of
common shares and joint bookrunner, joint lead arranger and administrative agent on a US$600 million senior term loan facility and joint
bookrunner, joint lead arranger and syndication agent on a US$1 billion senior 364-day bridge facility in support of the acquisition.
30 CIBC 2022 ANNUAL REPORT
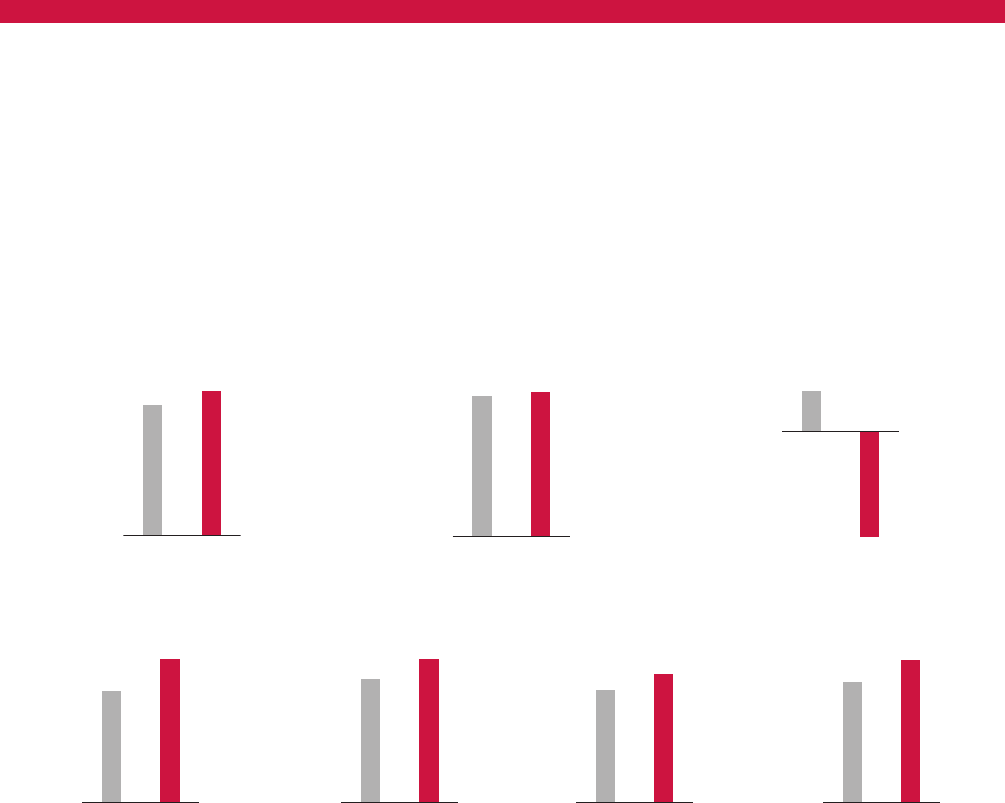
Management’s discussion and analysis
• Exclusive financial advisor to TELUS Corporation on its acquisition of LifeWorks Inc. for a transaction value of $2.9 billion.
• Exclusive financial advisor to Resolute Forest Products Inc. on its sale to Paper Excellence Group for a transaction value of US$2.7 billion
(expected to close in the first half of 2023).
• Joint bookrunner on a number of corporate green/sustainable bonds including TELUS Corporation’s $1.1 billion sustainability-linked notes,
iA Financial Corporation’s $300 million sustainable debentures and Ontario Power Generation’s $300 million green notes offerings as well as
joint bookrunner for the Government of Canada’s $5 billion green bonds, Province of Ontario’s $1.75 billion green bond, Province of Quebec’s
$1 billion green notes and European Investment Bank’s $1.4 billion climate awareness bond offerings.
• Led the structuring and execution of a number of Sustainability-Linked Loans (SLLs) in Canada, including acting as joint bookrunner, co-lead
arranger and sustainability structuring agent on a SLL overlay to the $750 million Revolver for Cogeco Communications Inc. and acting as
co-sustainability structuring agent for Hydro One’s amendments to incorporate the SLL structure to the existing $2.3 billion Hydro One Inc. and
$250 million Hydro One Limited syndicated credit facilities. Hydro One is the first organization in Canada to incorporate increasing Indigenous
procurement spend as a key sustainability performance measure in the loan.
2022 financial review
Revenue
($ billions)
5.0
4.5
21 22
Net income
($ millions)
1,908
1,857
21 22
Operating leverage
(%)
1.7
21
(4.4)
22
Average loans and acceptances
($ billions)
62.5
47.8
21 22
Average deposits
($ billions)
100.5
86.0
21 22
Average value-at-risk (VaR)
($ millions)
8.7
7.6
21 22
Revenue – Direct
financial services
($ millions)
979
828
21 22
Our focus for 2023
To support our bank’s long-term objectives, Capital Markets remains focused on delivering profitable growth by deepening client relationships and
collaborating with our partners across our bank to help make our clients’ ambitions a reality. We will continue to do this by:
• Maintaining our focused approach to client coverage in Canada;
• Growing our North American platform by further expanding our U.S. reach and broadening the services offered to clients; and
• Strengthening our connectivity, technology and innovation efforts to bring more of our bank’s offerings to our clients.
CIBC 2022 ANNUAL REPORT 31

Management’s discussion and analysis
Results
(1)
$ millions, for the year ended October 31 2022 2021
Revenue
Global markets $ 2,322 $ 2,076
Corporate and investment banking 1,700 1,616
Direct financial services 979 828
Total revenue
(2)
5,001 4,520
Provision for (reversal of) credit losses
Impaired (31) 32
Performing (31) (132)
Reversal of credit losses (62) (100)
Non-interest expenses 2,437 2,117
Income before income taxes 2,626 2,503
Income taxes
(2)
718 646
Net income $ 1,908 $ 1,857
Net income attributable to:
Equity shareholders $ 1,908 $ 1,857
Efficiency ratio 48.7 %
46.8 %
Operating leverage (4.4)%
1.7 %
Return on equity
(3)
21.3 %
25.6 %
Average allocated common equity
(3)
$ 8,978
$ 7,241
Average assets ($ billions)
(4)
$ 284.3
$ 255.1
Average loans and acceptances ($ billions)
(4)
$ 62.5
$ 47.8
Average deposits ($ billions)
(4)
$ 100.5
$ 86.0
Full-time equivalent employees
(5)
2,384
2,225
(1) For additional segmented information, see Note 30 to the consolidated financial statements.
(2) Revenue and income taxes are reported on a TEB. Accordingly, revenue and income taxes include a TEB adjustment of $211 million (2021: $204 million). The equivalent
amounts are offset in the revenue and income taxes of Corporate and Other.
(3) For additional information, see the “Non-GAAP measures” section.
(4) Average balances are calculated as a weighted average of daily closing balances.
(5) In 2021, 79 full-time equivalent employees related to Simplii Financial’s call centre operations were transferred to Capital Markets from Corporate and Other, with no
financial impact as the costs were previously allocated to Direct financial services.
Financial overview
Net income was up $51 million or 3% from 2021, primarily due to higher revenue, partially offset by higher non-interest expenses and a lower
provision reversal in the current year.
Revenue
Revenue was up $481 million or 11% from 2021.
Global markets revenue was up $246 million or 12%, primarily due to higher foreign exchange, global collateral finance and equity derivatives
trading revenue, partially offset by lower commodities trading revenue.
Corporate and investment banking revenue was up $84 million or 5%, primarily due to higher corporate banking and advisory revenue, and higher
gains from our investment portfolios, partially offset by lower equity and debt underwriting activity.
Direct financial services revenue was up $151 million or 18%, primarily due to higher revenue from Simplii Financial, and higher volumes and growth
in our foreign exchange and payments business, partially offset by lower trading volumes in direct investing.
Provision for (reversal of) credit losses
Provision reversal of credit losses was down $38 million or 38% from 2021. The provision reversal of credit losses on performing loans was down as
the prior year included a favourable change in our economic outlook driven by the recovery from the COVID-19 pandemic, and favourable portfolio
migration. The current year included a provision reversal of credit losses on impaired loans attributable to the oil and gas, and utilities sectors, while
the prior year included a provision for credit losses mainly in the utilities sector.
Non-interest expenses
Non-interest expenses were up $320 million or 15% from 2021, primarily due to higher spending on strategic initiatives, and higher employee-
related and performance-based compensation.
Income taxes
Income taxes were up $72 million or 11% from 2021, primarily due to higher income.
Average assets
Average assets were up $29.2 billion or 11% from 2021, primarily due to higher loan balances, trading securities and higher derivative valuation.
32 CIBC 2022 ANNUAL REPORT

Management’s discussion and analysis
Corporate and Other
Corporate and Other includes the following functional groups – Technology, Infrastructure and Innovation, Risk Management, People, Culture and
Brand, Finance and Enterprise Strategy, as well as other support groups. The expenses of these functional and support groups are generally
allocated to the business lines within the SBUs. The majority of the functional and support costs of CIBC Bank USA are recognized directly in the
U.S. Commercial Banking and Wealth Management SBU. Corporate and Other also includes the results of CIBC FirstCaribbean and other strategic
investments, as well as other income statement and balance sheet items not directly attributable to the business lines.
Results
(1)
$ millions, for the year ended October 31 2022 2021
Revenue
International banking $ 778 $ 687
Other (566) (206)
Total revenue
(2)
212 481
Provision for (reversal of) credit losses
Impaired 59 76
Performing (57) (54)
Provision for credit losses 2 22
Non-interest expenses 1,407 1,440
Loss before
income taxes (1,197) (981)
Income taxes
(2)
(628) (485)
Net income (loss) $ (
569) $ (496)
Net income (loss) attributable to:
Non-controlling interests $ 23 $ 17
Equity shareholders (592) (513)
Full-time equivalent employees 26,020 23,017
(1) For additional segmented information, see Note 30 to the consolidated financial statements.
(2) Revenue and income taxes of Capital Markets are reported on a TEB. The equivalent amounts are offset in the revenue and income taxes of Corporate and Other.
Accordingly, revenue and income taxes include a TEB adjustment of $211 million (2021: $204 million).
Financial overview
Net loss was up $73 million from 2021, due to lower revenue, partially offset by lower non-interest expenses and lower provision for credit losses.
Revenue
Revenue was down $269 million from 2021.
International banking revenue was up $91 million, primarily due to the impact of foreign exchange translation, higher net product spreads that
benefitted from the rising interest rate environment, and higher fee-based revenue in CIBC FirstCaribbean.
Other revenue was down $360 million, primarily due to lower treasury revenue related to an increase in funding costs from higher credit and liquidity
spreads.
Provision for (reversal of) credit losses
Provision for credit losses was down $20 million from 2021. The provision reversal of credit losses on performing loans was comparable to the prior
year. The provision for credit losses on impaired loans was down due to lower provisions in CIBC FirstCaribbean.
Non-interest expenses
Non-interest expenses were down $33 million from 2021, mainly due to a lower charge related to the consolidation of our real estate portfolio, shown
as an item of note, and lower unallocated corporate support costs, partially offset by higher employee termination costs and higher expenses in
CIBC FirstCaribbean.
Income taxes
Income tax benefit was up $143 million from 2021, primarily due to a higher loss.
CIBC 2022 ANNUAL REPORT 33

Management’s discussion and analysis
Financial condition
Review of condensed consolidated balance sheet
$ millions, as at October 31 2022 2021
Assets
Cash and deposits with banks $ 63,861 $ 56,997
Securities 175,879 161,401
Securities borrowed and purchased under resale agreements 84,539 79,940
Loans and acceptances 528,657 462,879
Derivative instruments 43,035 35,912
Other assets 47,626 40,554
$ 943,597 $ 837,683
Liabilities and equity
Deposits $ 697,572 $ 621,158
Obligations related to securities lent, sold short and under repurchase agreements 97,308 97,133
Derivative instruments 52,340 32,101
Acceptances 11,586 10,961
Other liabilities 28,117 24,961
Subordinated indebtedness 6,292 5,539
Equity 50,382 45,830
$ 943,597 $ 837,683
Assets
Total assets as at October 31, 2022 were up $105.9 billion or 13% from 2021, of which approximately $27 billion was due to the appreciation of the
U.S. dollar.
Cash and deposits with banks increased by $6.9 billion or 12%, primarily due to higher short-term placements in Treasury.
Securities increased by $14.5 billion or 9%, primarily due to increases in U.S. Treasury and Canadian government debt securities, partially offset by
decreases in corporate equity. Further details on the composition of securities is provided in Note 4 to the consolidated financial statements.
Securities borrowed and purchased under resale agreements increased by $4.6 billion or 6%, primarily due to client-driven activities.
Net loans and acceptances increased by $65.8 billion or 14%, primarily due to increases in business and government loans, which included the
impact of foreign exchange translation, Canadian residential mortgages, and the credit card portfolio, which included the addition of the Canadian
Costco credit card portfolio acquired in the second quarter. Further details on the composition of loans and acceptances are provided in the
“Supplementary annual financial information” section and Note 5 to the consolidated financial statements.
Derivative instruments increased by $7.1 billion or 20%, largely driven by increases in foreign exchange derivatives valuation, partially offset by a
decrease in equity derivatives valuation.
Other assets increased by $7.1 billion or 17%, primarily due to increases in collateral pledged for derivatives, software and other intangibles, and
tax receivables, partially offset by a decrease in broker receivables.
Liabilities
Total liabilities as at October 31, 2022 were up $101.4 billion or 13% from 2021, of which approximately $27 billion was due to the appreciation of
the U.S. dollar.
Deposits increased by $76.4 billion or 12%, primarily due to increased wholesale funding and business and government deposits, both of which
included the impact of foreign exchange translation, and domestic retail volume growth. Further details on the composition of deposits are provided
in the “Supplementary annual financial information” section and Note 10 to the consolidated financial statements.
Obligations related to securities lent, sold short and under repurchase agreements was comparable with the prior year.
Derivative instruments increased by $20.2 billion or 63%, largely driven by increases in foreign exchange and interest rate derivatives valuation,
partially offset by a decrease in equity derivatives valuation.
Acceptances increased by $0.6 billion or 6%, driven by client activities.
Other liabilities increased by $3.2 billion or 13%, primarily due to increases in accrued interest payable and broker payables.
Subordinated indebtedness increased by $0.8 billion or 14%, primarily due to the issuance of subordinated indebtedness in the second quarter. For
further details see the “Capital management” section.
Equity
Equity as at October 31, 2022 increased $4.6 billion or 10% from 2021, primarily due to a net increase in retained earnings, accumulated other
comprehensive income resulting from a net foreign currency translation gain related to our net investment in foreign operations, the issuance of a limited
recourse capital note in the third quarter and the issuance of preferred shares in the fourth quarter, partially offset by net losses recognized in other
comprehensive income related to debt securities measured at FVOCI and net losses on cash flow hedges, and the redemption of preferred shares in the
third quarter. For further details see the “Capital management” section.
34 CIBC 2022 ANNUAL REPORT

Management’s discussion and analysis
Capital management
Our capital strength protects our depositors and creditors from risks inherent in our businesses. Our overall capital management objective is to
maintain a strong and efficient capital base that:
• Acts as a buffer to absorb unexpected losses while providing sustainable returns to our shareholders;
• Enables our businesses to grow and execute on our strategy;
• Demonstrates balance sheet strength and our commitment to prudent balance sheet management; and
• Supports us in maintaining a favourable credit standing and raising additional capital or other funding on attractive terms.
We actively manage our capital to meet these objectives in support of our overall enterprise strategy. We also consider the economic outlook, and
the overall operating environment when deploying our capital and may choose to operate with greater levels of capital based on our view of
potential downside risks.
Capital management and planning framework
We maintain a capital management policy that establishes our capital management principles in the context of our risk appetite to support our
capital management objectives. Our capital management policy is reviewed and approved by the Board of Directors (the Board) in support of our
Internal Capital Adequacy Assessment Process (ICAAP). The policy includes guidelines that relate to capital strength, capital mix, dividends and
return of capital, and unconsolidated capital adequacy of regulated entities, based on regulatory requirements and our risk appetite. The level of
capital and capital ratios are continually monitored relative to our regulatory minimums and internal targets and the amount of capital required may
change in relation to our business growth, risk appetite, and the business and regulatory environment.
Capital planning is a crucial element of our overall financial planning process and establishment of strategic objectives and is developed in
accordance with the capital management policy. Each year, a capital plan and three-year outlook are developed as part of the financial plan, which
establishes targets for the coming year and business plans to achieve those targets. The capital plan is also stress-tested as a part of our
enterprise-wide stress testing process to ensure CIBC is adequately capitalized through severe but plausible stress scenarios (see the “Enterprise-
wide stress testing” section for further details). Our capital position and forecasts are monitored throughout the year and assessed against the
capital plan.
The Board, with endorsement from the Risk Management Committee (RMC), provides oversight of CIBC’s capital management through the
approval of our risk appetite, capital policy and plan. The RMC is provided with regular updates on our capital position including performance to
date, updated forecasts, and any material regulatory developments that may impact our future capital position. Treasury is responsible for the
overall management of capital including planning, forecasting, and execution of the plan, with senior management oversight provided by the Global
Asset Liability Committee (GALCO).
Enterprise-wide stress testing
We perform enterprise-wide stress testing on at least an annual basis. The results are an integral part of our ICAAP, as defined by Pillar 2 of the
Basel III Accord, wherein we identify and measure our risks on an ongoing basis in order to ensure that the capital available is sufficient to cover all
risks across CIBC, including the impacts of stress testing. We maintain a process that determines plausible but stressed economic scenarios such
as global recessions and housing price shocks, and then apply these stress scenarios to our bank-wide exposures to determine the impact on the
consolidated statement of income, RWA requirements, and consequently, key capital ratios. This helps us analyze the potential risks within our
portfolios and establish prudent capital levels in excess of the regulatory minimum requirements. All of the elements of capital are monitored
throughout the year and the capital plan is adjusted as appropriate.
Management determines the range of scenarios to be tested. Macroeconomic stress test scenarios are designed to be both severe and
plausible and designed to be consistent with OSFI’s stress testing framework to ensure that they are comprehensive.
CIBC 2022 ANNUAL REPORT 35

Management’s discussion and analysis
The following diagram summarizes the enterprise-wide stress testing process including the development of scenarios, identification of risk
drivers and linkages to our other bank-wide ICAAP processes. The process includes syndication with our economists and lines of business to
ensure scenarios are relevant to our businesses and there is a consistent interpretation of the scenarios across CIBC.
Quantify impacts
Evaluate and review bank-wide impacts
Linkages
Internal Capital Adequacy Assessment Process (ICAAP)
Enterprise-wide Stress Testing
Translation of financial and macroeconomic factors
(e.g., GDP, unemployment, yield curve, etc.)
Aggregate results
Credit Market Liquidity OtherEarningsOperational
Capital Impacts Funding and Liquidity
Scenario Development
• Develop macroeconomic scenarios
• relevant to the current and projected
• business cycle including emerging risks
Risk Identification/Modelling
• Identification of relevant risk drivers
• Development and validation of stress
• models and parameters
Earnings
Capital Financial Recovery and
Risk Liquidity Risk
Management Management Resolution
Appetite Management Management
and Planning and Planning Planning
Stress test scenarios are designed to capture a wide range of macroeconomic and financial variables that are relevant to assess the impact on our
specific portfolios. This includes, for example, GDP, unemployment, house prices, interest rates and equity prices.
The stress testing process is comprehensive, using a bottoms-up analysis of each of our bank-wide portfolios, and the results are analyzed on
a product, location and sector basis. Our stress testing approach combines the use of statistical models and expert judgment to ensure the results
are reasonable in estimating the impacts of the stress scenarios.
Stress testing methodologies and results are subject to a detailed review and challenge from both our lines of business and Risk Management.
Stress testing results are presented for review to the RMC and are also shared with the Board and OSFI. The results of our enterprise-wide stress
testing are used to highlight any vulnerabilities and ensure we remain well capitalized against regulatory and management expectations.
A key objective of the enterprise-wide stress tests is to identify key areas of exposure and foster discussion of management actions that would
be taken to mitigate the impact of stress scenarios. Contingency planning and strategies for extreme stress scenarios are included in the
development and maintenance of CIBC’s recovery and resolution plans. These plans include credible remedial actions that may be considered to
counteract and recover from stress, or promote CIBC’s orderly resolution with limited systemic impacts. Additional information on stress testing is
provided in the “Management of risk” section.
Recovery plan
FRFIs must maintain robust and credible recovery plans that identify options to restore financial strength and viability when under severe stress. CIBC
continues to maintain and update its recovery plan in line with OSFI requirements and industry best practices.
Resolution plan
The Canada Deposit Insurance Corporation (CDIC) Resolution Planning By-law establishes a statutory framework pursuant to which domestic
systemically important banks (D-SIBs) submit and maintain resolution plans that are critical to support resolvability and financial sector stability.
CDIC, Canada’s resolution authority for its member institutions, including D-SIBs, has issued guidance for the development, maintenance and
testing of comprehensive resolution plans and related strategies to demonstrate their operational capability, thus ensuring resolvability can be
achieved in an orderly fashion. CIBC’s resolution plan has been developed and maintained in alignment with guidance and is in compliance with
CDIC’s Resolution Planning By-law.
Regulatory capital requirements
Our regulatory capital requirements are determined in accordance with guidelines issued by OSFI, which are based upon the capital standards
developed by the BCBS.
36 CIBC 2022 ANNUAL REPORT

Management’s discussion and analysis
Regulatory capital consists of CET1, Tier 1 and Tier 2 capital. The tiers of regulatory capital indicate increasing quality/permanence and the
ability to absorb losses. The major components of our regulatory capital are summarized as follows:
Higher
quality
Lower
quality
CET1 capital
• Common equity (retained earnings, common shares and stock surplus)
• Accumulated other comprehensive income (AOCI)
(1)
• Qualifying instruments issued by a consolidated banking subsidiary to third parties
• Certain eligible general allowance resulting from expected credit loss provisioning
(2)
• Less regulatory deductions for items such as:
➢
Goodwill and other intangible assets
➢
Deferred tax assets
➢
Net assets related to defined benefit pension plans
➢
Certain investments
Additional Tier 1 (AT1) capital
• Non-viability contingent capital (NVCC) preferred shares
• Limited recourse capital notes
• Qualifying instruments issued by a consolidated subsidiary to third parties
Tier 2 capital
• NVCC subordinated indebtedness
• Eligible general allowance under the standardized approach
(2)
• Qualifying instruments issued by a consolidated subsidiary to third parties
Tier 1 capital
Total capital
(1) Excluding AOCI relating to cash flow hedges and changes to fair value option (FVO) liabilities attributable to changes in own credit risk.
(2) In response to the COVID 19 pandemic, OSFI has provided regulatory flexibility by implementing transitional arrangements for the treatment of expected loss provisioning,
such that part of the allowances that would otherwise be included in Tier 2 capital will instead qualify for inclusion in CET1 capital subject to certain scalars and limitations
until the end of fiscal 2022. The transitional arrangement will no longer apply in Q1 2023. See the “Continuous enhancement to regulatory capital requirements” section for
additional details.
Qualifying regulatory capital instruments must be capable of absorbing loss at the point of non-viability of the financial institution.
OSFI requires all institutions to achieve target capital ratios which include buffers. Targets may be higher for certain institutions at OSFI’s discretion.
CIBC has been designated by OSFI as a dome
stic systemically important bank (D-SIB) in Canada. D-SIBs are subject to a CET1 surcharge equal to
1.0% of RWA. In addition, OSFI expects D-SIBs to hold a Domestic Stability Buffer (DSB) requirement intended to address Pillar 2 risks that are not
adequately captured in the Pillar 1 capital requirements. The DSB is currently set at 2.5% but can range from 0% to 2.5% of RWA. Additionally, banks
need to hold an incremental countercyclical capital buffer equal to their weighted-average buffer requirement in Canada and across certain other
jurisdictions where they have private sector credit exposures. OSFI’s current targets are summarized below:
As at October 31, 2022 Minimum
Capital
conservation
buffer
D-SIB
buffer
Pillar 1
targets
(1)
Domestic
Stability
Buffer
(2)
Target including
all buffer
requirements
CET1 ratio 4.5 % 2.5 % 1.0 % 8.0 % 2.5 % 10.5 %
Tier 1 capital ratio 6.0 % 2.5 % 1.0 % 9.5 % 2.5 % 12.0 %
Total capital ratio 8.0 % 2.5 % 1.0 % 11.5 % 2.5 % 14.0 %
(1) The countercyclical capital buffer applicable to CIBC is insignificant as at October 31, 2022.
(2) On June 22, 2022, OSFI announced the DSB will remain at 2.5% of total RWA. This level remains unchanged from October 31, 2021.
In the first quarter of 2022, we increased the common equity allocated to our SBUs based on a target CET1 ratio of 11%, from 10% in 2021, for the
purpose of capital management. Further increases are possible as a result of the downside risks inherent in the economic outlook.
Capital adequacy requirements are applied on a consolidated basis consistent with our financial statements, except for our insurance subsidiaries
(CIBC Cayman Reinsurance Limited and CIBC Life Insurance Company Limited), which are excluded from the regulatory scope of consolidation.
The basis of consolidation applied to our financial statements is described in Note 1 to the consolidated financial statements. CIBC Life Insurance
Company Limited is subject to OSFI’s Life Insurance Capital Adequacy Test.
CIBC 2022 ANNUAL REPORT 37

Management’s discussion and analysis
Risk-weighted assets
The following table provides a summary of permissible regulatory capital approaches and those adopted by CIBC:
Risk
category Permissible regulatory capital approaches Approach adopted by CIBC
Credit risk
(1)
Basel provides three approaches for calculating credit risk
capital requirements:
• Standardized
• Foundation
• Advanced internal ratings-based (AIRB)
OSFI expects financial institutions in Canada with Total capital
in excess of $5 billion to use the AIRB approach for all material
portfolios and credit businesses.
OSFI provides two approaches for calculating counterparty
credit risk (CCR) for derivatives transactions:
• Standardized Approach (SA-CCR)
• Internal Model Method (IMM)
OSFI provides four approaches for calculating CCR for repo-
style transactions:
• Comprehensive approach, with supervisory haircuts
• Comprehensive approach, with own estimate haircuts
• Repo VaR approach
• IMM
Permitted approaches for equity positions in the banking book
(which includes equity investments in funds) include:
• Standardized
• Market-based
• Look-through
• Mandate-based
• Fall-back
Basel provides the following approaches for calculating capital
requirements for securitization positions:
• Internal Ratings-Based Approach (SEC-IRBA)
• Internal Assessment Approach (SEC-IAA)
• External Ratings-Based Approach (SEC-ERBA)
• Standardized Approach (SEC-SA)
We have adopted the AIRB approach for the majority of our
credit portfolios. Under this methodology, we utilize our own
internal estimates to determine probability of default (PD), loss
given default (LGD), maturity, and exposure at default (EAD) for
lending products and securities. We utilize the standardized
approach for credit portfolios within CIBC Bank USA and CIBC
FirstCaribbean. We periodically review portfolios under the
standardized approach for consideration of adoption of the
AIRB approach.
Effective April 30, 2020, CIBC has adopted the IMM approach
for calculating CCR exposure for qualifying derivative
transactions. Certain transactions remain under the SA-CCR
approach.
The comprehensive approach, with supervisory haircuts, is
used for credit risk mitigation for repo-style transactions.
We use the standardized approach for equity positions in the
banking book and both the look-through and mandate-based
approaches for equity investments in funds.
We use SEC-IRBA, SEC-IAA, SEC-ERBA and SEC-SA for
securitization exposures in the banking book.
Market risk Market risk capital requirements can be determined under the
following approaches:
• Standardized
• Internal models
Internal models involve the use of internal VaR models to
measure market risk and determine the appropriate capital
requirement. The stressed VaR and incremental risk charge
(IRC) also form part of the internal models approach.
We use the internal models approach to calculate market risk
capital. Our internal market risk models comprise VaR, stressed
VaR, IRC and a capital charge for risk not captured in VaR. We
also use SEC-ERBA for trading book securitization positions.
Operational
risk
Operational risk capital requirements can be determined under
the following approaches:
• Basic indicator approach
• Standardized approach
We use the standardized approach based on OSFI rules to
calculate operational risk capital.
(1) Includes CCR.
We also calculate a capital floor based on the standardized approaches. If our capital requirement is lower than that calculated by reference to the
standardized approaches with a floor adjustment factor applied, currently at 70%, an adjustment to our RWA would be required.
38 CIBC 2022 ANNUAL REPORT

Management’s discussion and analysis
Continuous enhancement to regulatory capital requirements
The BCBS and OSFI have published a number of proposals for changes to the existing regulatory capital requirements to strengthen the regulation,
supervision, and practices of banks, as well as to respond to changes in market conditions as a result of the COVID-19 pandemic, with the overall
objective of enhancing financial stability. The discussion below provides a summary of BCBS and OSFI publications that have been issued since
our 2021 Annual Report and transitional arrangements in response to the COVID-19 pandemic.
Basel III reforms and revised Pillar 3 disclosure requirements
On January 31, 2022, OSFI released final capital, leverage, liquidity and disclosure guidelines that incorporate the final Basel III reforms, as well as
certain updates to the treatment of credit valuation adjustments (CVA), market risk hedges of other valuation adjustments of over-the-counter (OTC)
derivatives and management of operational risk. The implementation date for these changes is the second quarter of 2023, with the exceptions of
revisions to the CVA and market risk frameworks, which is the first quarter of 2024. The revisions to the LAR Guideline will be implemented as of
April 1, 2023. Primary changes include:
• Revisions to both the internal ratings-based (IRB) approach and standardized approach to credit risk;
• Revised operational, market risk
and CVA frameworks;
• Updated CET1 capital deductions for certain assets;
• An updated capital output floor based on the revised standardized approach noted above, with the phase-in of the floor factor over three years
commencing in the second quarter of 2023;
• Modification to the Leverage Ratio framework, including a buffer requirement for D-SIBs; and
• Enhancements
to the LAR Guideline, including changes to net cumulative cash flow (NCCF) requirements.
OSFI also announced revisions to existing Pillar 3 disclosure to be implemented in the second quarter of 2023 and new Pillar 3 disclosure to be
implemented in the fourth quarter of 2023 for D-SIBs.
On November 11, 2021, the BCBS published “Revisions to market risk disclosure requirements”, which included a number of adjustments to reflect
the revised market risk framework introduced in January 2019. OSFI has not adopted the related changes and currently requires implementation of
the 2019 market risk framework in the first quarter of 2024.
Transitional arrangements for the capital treatment of expected loss provisioning
In response to the COVID-19 pandemic, OSFI introduced transitional arrangements for ECL provisioning that are available under the Basel
Framework. These transitional arrangements were effective immediately upon being announced by OSFI on March 27, 2020 and result in a portion
of allowances that would otherwise be included in Tier 2 capital qualifying for inclusion in CET1 capital. The amount of ECL allowances eligible for
inclusion in CET1 capital is determined based on the increase in stage 1 and stage 2 allowances relative to balances as at January 31, 2020 as a
baseline. This amount is then adjusted for tax effects and is subject to a scaling factor that decreases over time. The scaling factor has been set at
70% for fiscal 2020, 50% for fiscal 2021, and 25% for fiscal 2022. For exposures under the IRB approach, the lower of this amount and excess
allowances otherwise eligible for inclusion in Tier 2 capital is included as CET1 capital under the transitional arrangements. The temporary
transitional arrangements for ECL provisioning will no longer apply after October 31, 2022.
Leverage ratio
On April 9, 2020, OSFI announced temporary exclusion of central bank reserves and qualifying sovereign-issued securities from the leverage ratio
exposure measure in response to the onset of the COVID-19 pandemic. Starting January 1, 2022, the temporary exclusion of qualifying sovereign-
issued securities from the leverage ratio exposure measure was no longer applicable. On September 13, 2022, OSFI announced that the temporary
exclusion of central bank reserves from the leverage exposure measure will be no longer applicable effective April 1, 2023. As noted above,
effective February 1, 2023, D-SIBs will be expected to have leverage ratios that meet or exceed 3.5%, including a leverage ratio buffer introduced
under the modified Leverage Ratio framework as part of Basel III reforms.
We continue to monitor and prepare for developments impacting regulatory capital requirements and disclosures.
CIBC 2022 ANNUAL REPORT 39

Management’s discussion and analysis
Regulatory capital and ratios
The components of our regulatory capital and ratios under Basel III are presented in the table below:
$ millions, as at October 31 2022 2021
Common Equity Tier 1 (CET1) capital: instruments and reserves
Directly issued qualifying common share capital plus related stock surplus $ 14,841 $ 14,461
Retained earnings 28,823 25,793
AOCI (and other reserves) 1,594 1,069
Common share capital issued by subsidiaries and held by third parties (amount allowed in group CET1) 107 116
CET1 capital before regulatory adjustments 45,365 41,439
CET1 capital: regulatory adjustments
Prudential valuation adjustments 23 18
Goodwill (net of related tax liabilities) 5,268 4,877
Other intangibles other than mortgage-servicing rights (net of related tax liabilities) 2,289 1,737
Deferred tax assets excluding those arising from temporary differences (net of related tax liabilities) 15 7
Defined benefit pension fund net assets (net of related tax liabilities) 1,071 1,051
Other deductions or regulatory adjustments to CET1 as determined by OSFI
(1)
(170) (209)
Other (136) 207
Total regulatory adjustments to CET1 capital 8,360 7,688
CET1 capital 37,005 33,751
Additional Tier 1 (AT1) capital: instruments
Directly issued qualifying AT1 instruments plus related stock surplus
(2)
4,923 4,325
Directly issued capital instruments subject to phase out from AT1
(3)
– 251
AT1 instruments issued by subsidiaries
and held by third parties (amount allowed in AT1) 18 17
AT1 capital 4,941 4,593
Tier 1 capital (T1 = CET1 + AT1) 41,946 38,344
Tier 2 capital: instruments and provisions
Directly issued qualifying Tier 2 instruments plus related stock surplus
(4)
5,716 4,945
Directly issued capital instruments subject to phase out from Tier 2 – 451
Tier 2 instruments issued by subsidiaries and held by third parties (amount
allowed in Tier 2) 25 22
General allowances 576 440
Tier 2 capital (T2) 6,317 5,858
Total capital (TC = T1 + T2) $ 48,263 $ 44,202
Total RWA $ 315,634 $ 272,814
Capital ratios
CET1 ratio 11.7 % 12.4 %
Tier 1 capital ratio 13.3 % 14.1 %
Total capital ratio 15.3 % 16.2 %
(1) Includes the impact of the ECL transitional arrangement announced by OSFI on March 27, 2020 in response to the onset of the COVID-19 pandemic. The transitional
arrangement results in a portion of ECL allowances that would otherwise be included in Tier 2 capital qualifying for inclusion in CET1 capital. The amount is subject to
certain adjustments and limitations until the end of 2022.
(2) Comprised of non-viability contingent capital (NVCC) preferred shares and Limited Recourse Capital Notes (LRCN).
(3) Comprised of CIBC Tier 1 Notes – Series B due June 30, 2108. On November 1, 2021, CIBC Capital Trust redeemed all $300 million of its Tier 1 Notes – Series B.
(4) Comprised of certain debentures which qualify as NVCC.
CET1 ratio
The CET1 ratio at October 31, 2022 decreased 0.7% from October 31, 2021, driven by the impact of an increase in RWA, partially offset by the
increase in CET1 capital.
The increase in RWA was primarily due to increased book size from organic growth, the impact of foreign exchange translation, the acquisition
of the Canadian Costco credit card portfolio, increased operational risk levels and capital model updates.
The increase in CET1 capital was primarily the result of internal capital generation (net income less dividends and distributions) and the impact
of foreign currency translation, partially offset by a decrease in AOCI related to debt securities measured at FVOCI and higher intangible assets
including the impact from the acquisition of the Canadian Costco credit card portfolio.
Tier 1 capital ratio
The Tier 1 capital ratio at October 31, 2022 decreased 0.8% from October 31, 2021, primarily due to the factors affecting the CET1 ratio noted
above, the redemption of Non-cumulative Class A Preferred Shares Series 45 (NVCC) (Series 45 shares) and the redemption of CIBC Tier 1 notes
which were subject to phase-out rules for capital instruments. These factors are partially offset by the issuance of Limited Recourse Capital Notes
Series 3 (LRCN Series 3 Notes) and Non-cumulative Class A Preferred Shares Series 56 (NVCC) (Series 56 shares). See the “Capital initiatives”
section below for further details.
Total capital ratio
The Total capital ratio at October 31, 2022 decreased 0.9% from October 31, 2021, primarily due to the factors affecting the Tier 1 capital ratio
noted above and the phase-out of non-qualifying subordinated indebtedness, partially offset by a $1.0 billion issuance of Tier 2 capital instrument in
the current year. See the “Capital initiatives” section below for further details.
40 CIBC 2022 ANNUAL REPORT

Management’s discussion and analysis
Movement in total regulatory capital
Changes in regulatory capital under Basel III are presented in the table below:
$ millions, for the year ended October 31 2022 2021
CET1 capital
Balance at beginning of year $ 33,751 $ 30,876
Shares issued in lieu of cash dividends (add back) 153 132
Other issue of common shares 248 326
Purchase of common shares for cancellation (29) –
Premium on purchase of common shares for cancellation (105) –
Net income attributable to equity shareholders 6,220 6,429
Dividends and distributions (3,125) (2,780)
Change in AOCI balances
Currency translation differences 1,753 (1,115)
Securities measured at FVOCI (889) (43)
Cash flow hedges
(1)
(799) (137)
Fair value change of FVO liabilities attributable to changes in credit risk 262 12
Post-employment defined benefit plans 198 917
Removal of own credit spread (net of tax) (468) (9)
Shortfall of allowance to expected losses – –
Goodwill and other intangible assets (deduction, net of related tax liabilities) (943) 225
Other, including regulatory adjustments and transitional arrangements
(1)(2)
778 (1,082)
CET1 capital balance at end of year $ 37,005 $ 33,751
AT1 capital
Balance at beginning of year $ 4,593 $ 3,899
AT1 eligible capital issues 1,400 750
Impact of the cap on inclusion for instruments subject to phase out
(3)
(251) (51)
Redeemed capital (800) –
Other, including regulatory adjustments (1) (5)
AT1 capital balance at end of year $ 4,941 $ 4,593
Tier 2 capital
Balance at beginning of year $ 5,858 $ 6,194
New Tier 2 eligible capital issues 1,000 1,000
Redeemed capital – (1,000)
Impact of the cap on inclusion for instruments subject to phase out (451) (150)
Other, including change in regulatory adjustments
(2)
(90) (186)
Tier 2 capital balance at end of year $ 6,317 $ 5,858
Total capital balance at end of year $ 48,263 $ 44,202
(1) Net change in cash flow hedges is included in “Change in AOCI balances” then derecognized in “Other, including regulatory adjustments and transitional arrangements”.
(2) Includes the impact of the ECL transitional arrangement announced by OSFI on March 27, 2020 in response to the onset of the COVID-19 pandemic. The transitional
arrangement results in a portion of ECL allowances that would otherwise be included in Tier 2 capital qualifying for inclusion in CET1 capital. The amount is subject to
certain adjustments and limitations until the end of fiscal 2022.
(3) On November 1, 2021, CIBC Capital Trust, a trust wholly owned by CIBC, redeemed all $300 million of its Tier 1 Notes – Series B, of which $251 million was recognized as
AT1 capital as at October 31, 2021.
CIBC 2022 ANNUAL REPORT 41

Management’s discussion and analysis
Components of risk-weighted assets
The components of our RWA and corresponding minimum total capital requirements are presented in the table below:
$ millions, as at October 31 2022 2021
RWA
Minimum
total capital
required
(1)
RWA
Minimum
total capital
required
(1)
Credit risk
(2)
Standardized approach
Corporate $ 56,160 $ 4,493 $ 43,768 $
3,501
Sovereign 1,446 116 1,418 113
Banks 446 36 382 31
Real estate secured personal lending 2,467 197 2,153 172
Other retail 3,824 306 976 78
Trading book 101 8 416 33
Equity 810 65 654 52
Securitization 557 44 768 61
65,811 5,265 50,535 4,041
AIRB approach
(3)
Corporate 108,472 8,678 92,808 7,425
Sovereign
(4)
3,478 278 3,125 250
Banks 3,663 293 3,711 297
Real estate secured personal lending 27,396 2,192 22,508 1,801
Qualifying revolving retail 14,591 1,167 13,636 1,091
Other retail 11,358 909 9,525 762
Equity 686 55 564 45
Trading book 5,354 428 5,484 439
Securitization 1,810 145 1,246 100
Adjustment for scaling factor 10,500 840 9,082 727
187,308 14,985 161,689 12,937
Other credit RWA
(5)
13,261 1,061 12,913 1,033
Total credit risk
(before adjustment for CVA phase-in) 266,380 21,311 225,137 18,011
Market risk (Internal Models and IRB Approach)
VaR 921 74 1,575 126
Stressed VaR 4,002 320 3,887 311
Incremental risk charge 1,426 114 2,583 206
Securitization and other 2,881 230 1,061 85
Total market risk 9,230 738 9,106 728
Operational risk 33,328 2,666 31,397 2,512
Total RWA before adjustments for CVA phase-in $ 308,938 $ 24,715 $ 265,640 $ 21,251
CVA capital charge
Total RWA $ 6,696 $ 536 $ 7,174 $ 574
Total RWA after adjustments for CVA phase-in
Total RWA $ 315,634 $ 25,251 $ 272,814 $ 21,825
(1) Refers to the minimum standard established by the BCBS before the application of the capital conservation buffer and any other capital buffers that may be established by
regulators from time to time. It is calculated by multiplying RWA by 8%.
(2) Credit risk includes CCR, which comprises derivative and repo-style transactions. Credit risk for CIBC Bank USA and CIBC FirstCaribbean are calculated under the
standardized approach.
(3) Includes RWA relating to equity investments in funds and certain commercial loans which are determined using the supervisory slotting approach.
(4) Includes residential mortgages insured by Canada Mortgage and Housing Corporation (CMHC), an agency of the Government of Canada, and government-guaranteed
student loans.
(5) Comprises RWA relating to derivative and repo-style transactions cleared through qualified central counterparties (QCCPs), settlement risk, and other assets that are subject
to the credit risk framework but are not included in the standardized or IRB frameworks, including other balance sheet assets that are risk-weighted at 100%, significant
investments in the capital of non-financial institutions that are risk-weighted at 1,250%, and amounts below the thresholds for deduction that are risk-weighted at 250%.
The increase in credit risk RWA was primarily due to increased book size, the impact of foreign exchange translation, the acquisition of the
Canadian Costco credit card portfolio, and capital model updates.
The increase in market risk RWA was primarily driven by movement in risk levels, which includes changes in open positions and the market rates
affecting these positions.
The increase in operational risk RWA was driven by changes in gross income, as defined by OSFI.
42 CIBC 2022 ANNUAL REPORT

Management’s discussion and analysis
Leverage ratio
The Basel III capital standards include a non-risk-based capital metric, the leverage ratio, to supplement risk-based capital requirements. The leverage
ratio is defined as Tier 1 capital divided by the leverage ratio exposure. The leverage ratio exposure is defined under the standards as the sum of:
(i) On-balance sheet assets less Tier 1 capital regulatory adjustments;
(ii) Derivative exposures;
(iii) Securities financing transaction exposures; and
(iv) Off-balance sheet exposures (such as commitments, direct credit substitutes, letters of credit, and securitization exposures).
OSFI expects federally regulated deposit-taking institutions to have leverage ratios that meet or exceed 3.0%. This minimum may be higher for
certain institutions at OSFI’s discretion. See the “Continuous enhancement to regulatory capital requirements” section for recently announced capital
measures impacting the leverage ratio.
$ millions, as at October 31 2022 2021
Tier 1 capital $ 41,946 $ 38,344
Leverage ratio exposure 961,791 823,343
Leverage ratio 4.4 % 4.7 %
The leverage ratio at October 31, 2022, decreased by 0.3% from October 31, 2021, as the impact of an increase in Tier 1 capital was more than
offset by the impact of an increase in leverage ratio exposure. The increase in leverage ratio exposure was primarily driven by an increase in
on-balance sheet exposures and the reversal of the temporary exclusion of qualifying sovereign-issued securities from the exposure measure.
Total loss absorbing capacity requirements
OSFI also requires D-SIBs to maintain a supervisory target total loss absorbing capacity (TLAC) ratio (which builds on the risk-based capital ratios)
and a minimum TLAC leverage ratio (which builds on the leverage ratio).
TLAC is required to ensure that a non-viable D-SIB has sufficient loss absorbing capacity to support its recapitalization. This would, in turn,
facilitate an orderly resolution of the D-SIB while minimizing adverse impacts on the financial sector stability and taxpayers. TLAC is defined as the
aggregate of total capital and other TLAC instruments primarily comprised of bail-in eligible instruments with residual maturity greater than
365 days.
OSFI expects D-SIBs to have a minimum risk-based TLAC ratio of 21.5% plus the then applicable DSB requirement (2.5% as noted above),
and a minimum TLAC leverage ratio of 6.75%, beginning in the first quarter of fiscal 2022.
$ millions, as at October 31 2022 2021
TLAC available $ 95,136 $ 76,701
Total RWA 315,634 272,814
Leverage ratio exposure
(1)
961,791 823,343
TLAC ratio 30.1 % 28.1
%
TLAC leverage ratio 9.9 % 9.3 %
(1) The temporary exclusion of qualifying sovereign-issued securities from the leverage ratio exposure measure in response to the onset of the COVID-19 pandemic was no
longer applicable beginning in the first quarter of 2022. Central bank reserves continue to be excluded from the measure. On September 13, 2022, OSFI announced that
the temporary exclusion of central bank reserves from the leverage exposure measure will be no longer applicable effective April 1, 2023.
The TLAC ratio at October 31, 2022 increased 2.0% from October 31, 2021, driven by the increase in TLAC, partially offset by the impact of an
increase in RWA. The increase in TLAC was primarily due to issuances of bail-in eligible liabilities.
The TLAC leverage ratio at October 31, 2022 increased 0.6% from October 31, 2021, primarily due to an increase in TLAC, partially offset by
an increase in the leverage ratio exposure as noted above.
Share split
In February 2022, CIBC’s Board of Directors approved a two-for-one share split (Share Split) of CIBC’s issued and outstanding common shares to
be effected through an amendment to CIBC’s by-laws. On April 7, 2022, CIBC shareholders approved the Share Split. Each shareholder of record at
the close of business on May 6, 2022 (Record Date) received one additional share on May 13, 2022 (Payment Date) for every one share held on the
Record Date. All common share numbers and per common share amounts have been adjusted to reflect the Share Split as if it was retroactively
applied to all periods presented.
Capital initiatives
On March 13, 2020, following the onset of the COVID-19 pandemic, OSFI imposed temporary measures on FRFIs to cease dividend increases and
share buybacks in order to ensure that the additional capital available is used to support Canadian lending activities. The temporary measures were
lifted by OSFI effective November 4, 2021. The following were the main capital initiatives undertaken since our 2021 Annual Report:
Normal Course Issuer Bid (NCIB)
On December 9, 2021, we announced that the TSX had accepted the notice of our intention to commence a NCIB. Purchases under this bid will be
completed upon the earlier of: (i) CIBC purchasing 20 million common shares (on a post share split basis); (ii) CIBC providing a notice of termination;
or (iii) December 12, 2022. For the year ended October 31, 2022, we purchased and cancelled 1,800,000 common shares (on a post share split basis)
at an average price of $74.43 for a total amount of $134 million, all of which occurred during the first quarter.
Employee share purchase plan
Pursuant to the employee share purchase plan, we issued 2,302,876 common shares (on a post share split basis) for consideration of $163 million
for the year ended October 31, 2022.
Shareholder investment plan
Pursuant to the shareholder investment plan, we issued 2,272,831 common shares (on a post share split basis) for consideration of $153 million for
the year ended October 31, 2022.
CIBC 2022 ANNUAL REPORT 43

Management’s discussion and analysis
Dividends
Our quarterly common share dividend was increased from $0.805 per share to $0.830 per share for the quarter ending July 31, 2022.
On November 30, 2022, the CIBC Board of Directors approved an increase in our quarterly common share dividend from $0.830 per share to
$0.850 per share for the quarter ending January 31, 2023.
Common and preferred share dividends are declared quarterly at the discretion of the Board. The declaration and payment of dividends is
governed by Section 79 of the Bank Act (Canada), the terms of the preferred shares, as explained in Note 15 to the consolidated financial
statements.
Subordinated indebtedness
On April 7, 2022, we issued $1.0 billion principal amount of 4.20% Debentures due April 7, 2032 (subordinated indebtedness). The Debentures bear
interest at a fixed rate of 4.20% per annum (paid semi-annually) until April 7, 2027, and at Daily Compounded Canadian Overnight Repo Rate
Average (CORRA) plus 1.69% per annum (paid quarterly) thereafter until maturity on April 7, 2032. The debenture qualifies as Tier 2 capital.
Limited Recourse Capital Notes Series 3 (LRCN Series 3 Notes)
On June 15, 2022, we issued $800 million principal amount of 7.150% LRCN Series 3 Notes (NVCC) (subordinated indebtedness). The LRCN
Series 3 Notes mature on July 28, 2082, and bear interest at a fixed rate of 7.150% per annum (paid semi-annually) until July 28, 2027. Starting on
July 28, 2027, and every five years thereafter until July 28, 2077, the interest rate will be reset to the then current five-year Government of Canada
bond yield plus 4.000% per annum.
Concurrently with the issuance of the LRCN Series 3 Notes, we issued Non-Cumulative 5-Year Fixed Rate Reset Class A Preferred Shares
Series 55 (NVCC) (Series 55 shares), which are held in a CIBC LRCN Limited Recourse Trust (the Limited Recourse Trust) that is consolidated by
CIBC and, as a result, the Series 55 shares are eliminated in CIBC’s consolidated financial statements. In the event of non-payment by CIBC of the
principal amount of, interest on, or redemption price for, the LRCN Series 3 Notes when due, the sole remedy of each LRCN Series 3 Note holder is
limited to that holder’s proportionate share of the Series 55 shares held in the Limited Recourse Trust. Subject to regulatory approval, we may
redeem the LRCN Series 3 Notes, in whole or in part, every five years during the period from June 28 to and including July 28, commencing on
June 28, 2027, at par.
The LRCN Series 3 Notes and the Series 55 shares carry standard NVCC provisions necessary for them to qualify as additional Tier 1
regulatory capital under Basel III. Upon the occurrence of a Trigger Event, each Series 55 share held in the Limited Recourse Trust will automatically
and immediately be converted, without the consent of LRCN Series 3 Note holders, into a variable number of common shares that will be delivered
to LRCN Series 3 Note holders in satisfaction of the principal amount of, and accrued and unpaid interest on, all of the LRCN Series 3 Notes. All
claims of LRCN Series 3 Note holders against CIBC under the LRCN Series 3 Notes will be extinguished upon receipt of such common shares.
The LRCN Series 3 Notes are compound instruments with both equity and liability features as payments of interest and principal in cash are
made at our discretion, as the sole recourse of each LRCN Series 3 Note holder in the event of non-payment will be limited to that holder’s
proportionate share of the Series 55 shares held in the Limited Recourse Trust. The liability component of the LRCN Series 3 Notes has a nominal
value and, as a result, the full proceeds received upon the issuance of the LRCN Series 3 Notes have been presented as equity on the consolidated
balance sheet and any interest payments paid thereon are accounted for as equity distributions.
Preferred shares
On July 29, 2022, we redeemed all 32 million Non-cumulative Class A Preferred Shares Series 45 (NVCC) (Series 45 shares), at a redemption price
of $25.00 per Series 45 share, for a total redemption cost of $800 million.
Non-cumulative Rate Reset Class A Preferred Shares Series 56 (NVCC) (Series 56 shares)
On September 16, 2022, we issued 600,000 Non-cumulative Rate Reset Class A Preferred Shares Series 56 (NVCC) (Series 56 shares) with a par
value of $1,000.00 per share, for gross proceeds of $600 million. For the initial five-year period to October 28, 2027, the Series 56 shares pay
semi-annual cash dividends on the 28th day of April and October in each year, as declared, at a rate of 7.361%. The first dividend, if declared, will
be payable on April 28, 2023. On October 28, 2027, and on October 28 every five years thereafter, the dividend rate will reset to be equal to the
then current five-year Government of Canada bond yield plus 4.20%.
Subject to regulatory approval and certain provisions of the shares, we may redeem all or any part of the then outstanding Series 56 shares at
par during the period from September 28, 2027 to and including October 28, 2027 and during the period from September 28 to and including
October 28 every five years thereafter.
44 CIBC 2022 ANNUAL REPORT

Management’s discussion and analysis
Outstanding share data
The table below provides a summary of our outstanding shares, NVCC capital instruments, and the maximum number of common shares issuable
on conversion/exercise:
$ millions, except number of shares and per share amounts, as at November 25, 2022
Shares outstanding
Minimum
conversion
price per
common share
(1)
Maximum number
of common shares
issuable on
conversion/exercise
Number
of shares Amount
Common shares 906,218,463 $ 14,735
Treasury shares – common shares (68,633) (3)
Preferred shares
(2)(3)
Series 39 (NVCC) 16,000,000 $ 400 $ 2.50 160,000,000
Series 41 (NVCC) 12,000,000 300 2.50 120,000,000
Series 43 (NVCC) 12,000,000 300 2.50 120,000,000
Series 47 (NVCC) 18,000,000 450 2.50 180,000,000
Series 49 (NVCC) 13,000,000 325 2.50 130,000,000
Series 51 (NVCC) 10,000,000 250 2.50 100,000,000
Series 56 (NVCC) 600,000 600 2.50 240,000,000
Treasury shares – preferred shares
(2)(3)
(1,995) (2)
Limited recourse capital notes
(3)(4)
4.375% Limited recourse capital notes Series 1 (NVCC) n/a 750 2.50 300,000,000
4.000% Limited recourse capital notes Series 2 (NVCC) n/a 750 2.50 300,000,000
7.150% Limited recourse capital notes Series 3 (NVCC) n/a 800 2.50 320,000,000
Subordinated indebtedness
(3)(5)
3.45% Debentures due April 4, 2028 (NVCC) n/a 1,500 2.50 900,000,000
2.95% Debentures due June 19, 2029 (NVCC) n/a 1,500 2.50 900,000,000
2.01% Debentures due July 21, 2030 (NVCC) n/a 1,000 2.50 600,000,000
1.96% Debentures due April 21, 2031 (NVCC) n/a 1,000 2.50 600,000,000
4.20% Debentures due April 7, 2032 (NVCC) n/a 1,000 2.50 600,000,000
Stock options outstanding 11,412,239
(1) The minimum conversion price per common share for CIBC’s outstanding NVCC instruments, including NVCC preferred shares, NVCC subordinated debentures and NVCC
LRCN have been adjusted from $5.00 to $2.50 to account for the Share Split in accordance with the terms and conditions of the NVCC instruments.
(2) Upon the occurrence of a Trigger Event, each share is convertible into a number of common shares, determined by dividing the par value of $25.00 ($1,000 in the case of
Series 56 shares) plus declared and unpaid dividends by the average common share price (as defined in the relevant prospectus supplement) subject to a minimum price
per share (subject to adjustment in certain events as defined in the relevant prospectus supplement, including a share split). Preferred shareholders do not have the right
to convert their shares into common shares.
(3) The maximum number of common shares issuable on conversion excludes the impact of declared but unpaid dividends and accrued interest.
(4) Upon the occurrence of a Trigger Event, the Series 53, 54 and 55 Preferred Shares held in the Limited Recourse Trust in support of the LRCN are convertible into a number of
common shares, determined by dividing the par value of $1,000 by the average common share price (as defined in the relevant prospectus supplement) subject to a minimum
price per common share (subject to adjustment in certain events as defined in the relevant prospectus supplement, including a share split).
(5) Upon the occurrence of a Trigger Event, the Debentures are convertible into a number of common shares, determined by dividing 150% of the par value plus accrued and
unpaid interest by the average common share price (as defined in the relevant prospectus supplement) subject to a minimum price per common share (subject to
adjustment in certain events as defined in the relevant prospectus supplement, including a share split).
n/a Not applicable.
The occurrence of a “Trigger Event” would result in conversion of all of the outstanding NVCC instruments described above, which would represent
a dilution impact of 86% based on the number of CIBC common shares outstanding as at October 31, 2022. As described in the CAR Guideline, a
Trigger Event occurs when OSFI determines the bank is or is about to become non-viable and, if after conversion of all contingent instruments and
consideration of any other relevant factors or circumstances, it is reasonably likely that its viability will be restored or maintained; or if the bank has
accepted or agreed to accept a capital injection or equivalent support from a federal or provincial government, without which OSFI would have
determined the bank to be non-viable.
In addition to the potential dilution impacts related to the NVCC instruments discussed above, as at October 31, 2022, $55,111 million (2021:
$32,643 million) of our outstanding liabilities were subject to conversion to common shares under the bail-in regime. Under the bail-in regime, there
is no fixed and pre-determined contractual conversion ratio for the conversion of the specified eligible shares and liabilities of CIBC that are subject
to a bail-in conversion into common shares, nor are there specific requirements regarding whether liabilities subject to a bail-in conversion are
converted into common shares of CIBC or any of its affiliates. CDIC determines the timing of the bail-in conversion, the portion of the specified
eligible shares and liabilities to be converted and the terms and conditions of the conversion, subject to parameters set out in the bail-in regime. See
the “Total loss absorbing capacity requirements” section for further details.
Preferred share and other equity instruments rights and privileges
See Note 15 to the consolidated financial statements for details on our preferred share and other equity instruments rights and privileges.
Off-balance sheet arrangements
We enter into off-balance sheet arrangements in the normal course of our business. We consolidate all of our sponsored trusts that securitize our
own assets.
Non-consolidated structured entities (SEs)
We manage and administer a single-seller conduit and several CIBC-sponsored multi-seller conduits in Canada. The multi-seller conduits acquire
direct or indirect ownership or security interests in pools of financial assets from our clients and finance the acquisitions by issuing asset-backed
commercial paper (ABCP) to investors. The single-seller conduit acquires financial assets and finances these acquisitions through a credit facility
provided by a syndicate of financial institutions. The sellers to the conduits may continue to service the assets and may be exposed to credit losses
realized on these assets, typically through the provision of over-collateralization or another form of credit enhancement. The conduits may obtain
credit enhancement from third-party providers.
We provide the multi-seller conduits with commercial paper backstop liquidity facilities, securities distribution, and provide both the single and
multi-seller conduits with accounting, cash management, and operations services. The liquidity facilities for the managed and administered multi-seller
CIBC 2022 ANNUAL REPORT 45

Management’s discussion and analysis
conduits require us to provide funding, subject to the satisfaction of certain conditions with respect to the conduits, for ABCP not placed with
external investors. We may also purchase ABCP issued by the multi-seller conduits for market-making purposes.
We are required to maintain certain short-term and/or long-term debt ratings with respect to the liquidity facilities that we provide to the
sponsored multi-seller conduits. If we are downgraded below the level specified under the terms of those facilities, we must provide alternative
satisfactory liquidity arrangements, such as procuring an alternative liquidity provider that meets the minimum rating requirements.
We may also act as the counterparty to derivative contracts entered into by a multi-seller conduit in order to convert the yield of the underlying
assets to match the needs of the multi-seller conduit’s investors or to mitigate the interest rate, basis, and currency risk within the conduit.
We earn fees for providing services related to the non-consolidated single-seller and multi-seller conduits, such as backstop liquidity facilities,
distribution, transaction structuring, and conduit administration. These fees totalled $70 million in 2022 (2021: $71 million). All fees earned in respect
of activities with the conduits are on a market basis.
As at October 31, 2022, the amount funded for the various asset types in the multi-seller conduits amounted to $9.3 billion (2021: $7.5 billion).
The estimated weighted-average life of these assets was 1.8 years (2021: 2.0 years). Our holdings of commercial paper issued by the
non-consolidated sponsored multi-seller conduits that offer commercial paper to external investors were $642 million (2021: $35 million). Our
committed backstop liquidity facilities to these conduits were $11.7 billion (2021: $10.6 billion). We also provided credit facilities of $50 million
(2021: $50 million) to these conduits.
We participated in a syndicated facility of $700 million to the single-seller conduit that provides funding to franchisees of a major Canadian
retailer, which will mature in April 2025. Our portion of the commitment was $130 million (2021: $130 million), of which $98 million (2021:
$106 million) was funded as at October 31, 2022.
We engage one or more of the four major rating agencies, DBRS Limited (DBRS), Fitch Ratings Inc. (Fitch), Moody’s Investors Service, Inc.
(Moody’s), and S&P, to opine on the credit ratings of asset-backed securities (ABS) issued by our sponsored multi-seller conduits. In the event that
ratings differ between rating agencies, we use the lower rating.
We also have investments in and provide loans, liquidity and credit facilities to certain other third-party and CIBC-managed SEs. The
on-balance sheet exposure related to these SEs is included in the consolidated financial statements.
We provide interim and term senior financing to third-party SEs for the purpose of purchasing loans during the warehousing phase for future
securitization. As senior lenders we are repaid by proceeds from the issuance of debt securities to external investors when the securitization closes
or by the cash flows from the repayment of the underlying assets held by the SE or alternative financing obtained by the SE from third-party lenders.
Our on- and off-balance sheet amounts related to the SEs that are not consolidated are set out in the table below. For additional details on our
SEs, see Note 6 to the consolidated financial statements.
$ millions, as at October 31 2022 2021
Investments
and loans
(1)
Liquidity, credit
facilities and
commitments
Written credit
derivatives
(2)
Investments
and loans
(1)
Liquidity, credit
facilities and
commitments
Written credit
derivatives
(2)
Single-seller and multi-seller conduits $ 740 $ 8,682
(3)
$ – $ 141 $ 7,539
(3)
$ –
Third-party structured vehicles 5,005 2,638 – 3,838 2,016 –
Loan warehouse financing 8,898 2,700 – 3,245 921 –
Other 601 308 80 394 129 87
(1) Excludes securities issued by, retained interest in, and derivatives with entities established by CMHC, Federal National Mortgage Association, Federal Home Loan
Mortgage Corporation, Government National Mortgage Association, Federal Home Loan Banks, Federal Farm Credit Bank, and Student Loan Marketing Association.
$3 million (2021: $3 million) of the exposures related to structured vehicles run-off were hedged.
(2) Disclosed amounts reflect the outstanding notional of written credit derivatives. The negative fair value recorded on the consolidated balance sheet was $45 million
(2021: $54 million). Notional of $75 million (2021: $82 million) was hedged with credit derivatives protection from third parties. The fair value of these hedges net of CVA
was $40 million (2021: $49 million). An additional notional of $5 million (2021: $5 million) was hedged through a limited recourse note.
(3) Excludes an additional $2.4 billion (2021: $3.0 billion) relating to our backstop liquidity facilities provided to the multi-seller conduits as part of their commitment to fund
purchases of additional assets. Also excludes $642 million (2021: $35 million) of our direct investments in the multi-seller conduits which we consider investment exposure.
Other financial transactions
We are the sponsor of several mutual and pooled funds, in the form of trusts. We are the administrator of these funds. In addition, we may act in
other capacities, including custodian, trustee and broker. We earn fees at market rates from these trusts. We do not guarantee either principal or
returns to investors in these funds. We act as a trustee of a number of personal trusts and have a fiduciary responsibility to act in the best interests
of the beneficiaries of the trusts. We earn a fee for acting as a trustee. We also participate in transactions to modify the cash flows of trusts managed
by third-party asset managers to create investments with specific risk profiles, or to assist clients in the efficient management of other risks.
Typically, these involve the use of derivative products, which transfer the risks and returns to or from a trust.
Derivatives
We participate in derivatives transactions, as a market maker facilitating the needs of our clients or as a principal to manage the risks associated
with our funding, investing and trading strategies. All derivatives are recorded at fair value on our consolidated balance sheet. See Notes 12 and 23
to the consolidated financial statements for details on derivative contracts and the risks associated with them.
Credit-related arrangements
Credit-related arrangements are generally off-balance sheet instruments and are typically entered into to meet the financing needs of clients. In
addition, there are certain exposures for which we could be obligated to extend credit that are not recorded on the consolidated balance sheet. For
additional details of these arrangements, see the “Liquidity risk” section and Note 21 to the consolidated financial statements.
Guarantees
A guarantee is a contract that requires the issuer to make specified payments to reimburse the holder for a loss it incurs because a specified debtor
failed to make payment when due in accordance with the original or modified terms of a debt instrument. Guarantees include credit derivatives
protection sold and standby and performance letters of credit, as discussed in Notes 12 and 21 to the consolidated financial statements,
respectively.
46 CIBC 2022 ANNUAL REPORT

Management’s discussion and analysis
Management of risk
We have provided certain disclosures required under IFRS 7 “Financial Instruments – Disclosures” (IFRS 7) related to the nature and extent of risks
arising from financial instruments in the MD&A, as permitted by that IFRS standard. These disclosures are included in the “Risk overview”, “Credit
risk”, “Market risk”, “Liquidity risk”, “Operational risk”, “Reputation and legal risks”, “Conduct risk”, and “Regulatory compliance risk” sections.
47 Risk overview
48 Risk governance structure
49 Risk management structure
50 Risk management process
50 Risk appetite statement
51 Risk input into performance and
compensation
52 Risk policies and limits
53 Risk identification and measurement
54 Stress testing
54 Risk treatment and mitigation
54 Risk monitoring and reporting
55 Top and emerging risks
58 Risks arising from business activities
59 Credit risk
59 Governance and management
59 Policies
60 Process and control
60 Risk measurement
63 Exposure to credit risk
65 Credit quality of portfolios
68 Credit quality performance
68 Loans contractually past due
but not impaired
69 Exposure to certain countries
and regions
69 Settlement risk
69 Securitization activities
70 Market risk
70 Governance and management
70 Policies
70 Market risk limits
70 Process and control
70 Risk measurement
71 Trading activities
74 Non-trading activities
75 Pension risk
76 Liquidity risk
76 Governance and management
76 Policies
76 Risk measurement
77 Liquid assets
80 Funding
81 Contractual obligations
82 Other risks
82 Strategic risk
82 Operational risk
84 Environmental and social risk
85 Regulatory compliance risk
85 Insurance risk
86 Reputation and legal risks
86 Conduct risk
Risk overview
CIBC faces a wide variety of risks across all of its areas of business. Identifying and understanding risks and their impact allows CIBC to frame its
risk appetite and risk management practices. Defining acceptable levels of risk, and establishing sound principles, policies and practices for
managing risks, is fundamental to achieving consistent and sustainable long-term performance, while remaining within our risk appetite.
Our risk appetite defines tolerance levels for various risks. This is the foundation for our risk management culture and our risk management
framework.
Our risk management framework includes:
• CIBC, SBU, functional group-level and regional risk appetite statements;
• Risk frameworks, policies, procedures and limits to align activities with our risk appetite;
• Regular risk reports to identify and communicate risk levels;
• An independent control framework to identify and test the design and operating effectiveness of our key controls;
• Stress testing to consider the potential impact of changes in the business environment on capital, liquidity and earnings;
• Proactive consideration of risk mitigation options in order to optimize results; and
• Oversight through our risk-focused committees and governance structure.
Managing risk is a shared responsibility at CIBC. Business units and risk management professionals work in collaboration to ensure that
business strategies and activities are consistent with our risk appetite. CIBC’s approach to enterprise-wide risk management aligns with the
three lines of defence model:
(i) As the first line of defence, CIBC’s Management, in SBUs and functional groups own the risks and are accountable and responsible for
identifying and assessing risks inherent in its activities in accordance with the CIBC risk appetite. In addition, Management establishes and
maintains controls to mitigate such risks. Management may include governance groups within the business to facilitate the Control
Framework and other risk-related processes. A Governance Group refers to a group within Business Unit Management (first line of defence)
whose focus is to manage governance, risk and control activities on behalf of that Business Unit Management. A Governance Group is
considered first line of defence, in conjunction with Business Unit Management. Control Groups are groups with enterprise-wide
accountability for specific risk type and are also considered first line of defence. They provide subject matter expertise to Management and/
or implement/maintain enterprise-wide control programs and activities for their domain area (for example Information Security). While Control
Groups collaborate with Management in identifying and managing risk, they also challenge risk decisions and risk mitigation strategies.
(ii) The second line of defence is independent from the first line of defence and provides an enterprise-wide view of specific risk types,
guidance and effective challenge to risk and control activities. Risk Management is the primary second line of defence. Risk Management
may leverage subject matter expertise of other groups (e.g., third parties or Control Groups) to inform their independent assessments, as
appropriate.
(iii) As the third line of defence, CIBC’s Internal Audit is responsible for providing reasonable assurance to senior management and the Audit
Committee of the Board on the effectiveness of CIBC’s governance practices, risk management processes, and Internal Control as a part
of its risk-based audit plan and in accordance with its mandate as described in the Internal Audit Charter.
A strong risk culture and communication between the three lines of defence are important characteristics of effective risk management.
We continuously monitor our risk profile against our defined risk appetite and related limits, taking action as needed to maintain an appropriate
balance of risk and return. Monitoring our risk profile includes forward-looking analysis of sensitivity to local and global market factors, economic
conditions, and geopolitical and regulatory environments that influence our overall risk profile.
CIBC 2022 ANNUAL REPORT 47

Management’s discussion and analysis
Regular and transparent risk reporting and discussion at senior management committees facilitates communication of risks and discussion of
risk management strategies across the organization.
Risk governance structure
Our risk governance structure is illustrated below:
Board of Directors
Executive Committee
Audit
Committee
Risk
Management
Committee
Corporate
Governance
Committee
Management
Resources and
Compensation
Committee
escalation oversight
culture framework
Risk Governance Structure
Global Asset Liability
Committee
Global Risk
Committee
Board of Directors (the Board): The Board oversees the enterprise-wide risk management program through approval of our risk appetite,
Control Framework and supporting risk management policies and limits. The Board accomplishes its mandate through its Audit, Risk
Management, Management Resources and Compensation, and Corporate Governance committees, described below.
Audit Committee (AC): The Audit Committee reviews the overall design and operating effectiveness of internal controls and the control
environment, including controls over financial reporting. The Audit Committee also has oversight of the underlying processes and controls of the
ESG disclosures in our Annual Report and our Sustainability Report.
Risk Management Committee (RMC): This committee assists the Board in fulfilling its responsibilities for defining CIBC’s risk appetite and
overseeing CIBC’s risk profile and performance against the defined risk appetite. This includes oversight of key frameworks, policies and risk
limits related to the identification, measurement and monitoring of CIBC’s principal business risks.
Management Resources and Compensation Committee (MRCC): This committee is responsible for assisting the Board in its global oversight
of CIBC’s human capital strategy, including talent and total rewards, and the alignment with CIBC’s strategy, risk appetite and controls.
Corporate Governance Committee (CGC): This committee is responsible for assisting the Board in fulfilling its corporate governance oversight
responsibilities and oversight of the ESG strategy.
Executive Committee (ExCo): The ExCo, led by the Chief Executive Officer (CEO) and including selected executives reporting directly to the
CEO, is responsible for setting business strategy and for monitoring, evaluating and managing risks across CIBC. The ExCo is supported by the
following management governance committees:
• Global Asset Liability Committee (GALCO): This committee, which comprises members from the ExCo and senior Treasury, Risk Management
and lines of business executives, provides oversight regarding capital management, funding and liquidity management, and asset/liability
management (ALM). It also provides strategic direction regarding structural interest rate risk (SIRR) and structural foreign exchange risk
postures, approval of funds transfer pricing policies/parameters and approval of wholesale funding plans.
• Global Risk Committee (GRC): This committee, which comprises selected members of the ExCo and senior leaders from the lines of
business, Risk Management and other functional groups, provides a forum for discussion and oversight of risk appetite, risk profile and risk
mitigation strategies. Key activities include reviewing and providing input regarding CIBC’s risk appetite statements; monitoring risk profile
against risk appetite; reviewing and evaluating business activities in the context of risk appetite; and identifying, reviewing, and advising on
current and emerging risk issues and associated mitigation plans.
48 CIBC 2022 ANNUAL REPORT

Management’s discussion and analysis
Risk management structure
The Risk Management group, led by our Chief Risk Officer (CRO), is responsible for setting risk strategies and for providing independent oversight
of the businesses. Risk Management works to identify, assess, mitigate, monitor and control risks associated with business activities and strategies,
and is responsible for providing an effective challenge to the lines of business.
The current structure is illustrated below:
Chief Risk Officer
Risk Appetite Statement and Management Control Metrics
Risk Policies and Limits
Risk Management Structure
Capital
Markets Risk
Management
Risk Identification, Measurement, Monitoring and Reporting
Stress Testing
Effective Challenge as Second Line of Defence
Risk Treatment and Mitigation
U.S. Risk
Management
Global
Operational
Risk
Management
Global Credit
Risk
Management
Enterprise Risk
Management
Risk
Analytics
and Credit
Decisioning
Compliance
and Global
Regulatory
Affairs
Enterprise
Anti-Money
Laundering
Europe and
Asia-Pacific
Risk
Management
The Risk Management group performs several important activities including:
• Developing our risk appetite and associated management control metrics;
• Setting risk strategy to manage risks in alignment with our risk appetite and business strategy;
• Establishing and communicating risk frameworks, policies, procedures and limits to mitigate risks in alignment with risk strategy;
• Measuring, monitoring and reporting on risk levels;
• Identifying and assessing emerging and potential strategic risks;
• Reviewing transactions that fall outside of risk limits delegated to business lines; and
• Ensuring compliance with applicable regulatory and anti-money laundering (AML) requirements.
The following key groups within Risk Management, independent of the originating businesses, contribute to our management of risk:
• Capital Markets Risk Management – This group provides independent oversight of the measurement, monitoring and control of market risks
(both trading and non-trading), and trading credit risk (also called counterparty credit risk) across CIBC’s portfolios, and effective challenge
and sound risk management oversight to Treasury, including with respect to liquidity and funding risk management and SIRR management.
• Global Credit Risk Management – This group is responsible for the adjudication and oversight of credit risks associated with CIBC’s
commercial, corporate and wealth management activities, management of the risks in our investment portfolios, as well as management of
special loan portfolios.
• Global Operational Risk Management – This group is responsible for designing and implementing effective operational risk management and
control programs, and providing effective challenge to and monitoring of all operational risks globally, including (but not limited to) technology
risk, information security (including cyber) risk, fraud risk, model risk, and third-party risk. In addition, the team has global accountability for
corporate risk insurance programs, reputation risks, risk policy and governance, and risk transformation programs.
• Risk Analytics and Credit Decisioning – This group manages credit risk in personal and business products (such as residential mortgages,
credit cards, personal loans/lines of credit, indirect auto lending, small business loans) offered through various distribution channels and
performs analytics to optimize retail credit performance, along with collections and AML outcomes.
• Enterprise Risk Management – This group is responsible for enterprise-wide analysis, including the measuring and monitoring of risk appetite,
enterprise-wide stress testing and reporting, credit loss reporting, risk models and model quantification, economic and regulatory capital
methodologies, as well as risk data management. In addition, this group identifies and manages environmental risk, including transaction-
specific environmental and related social risk, and the physical and transition risks associated with climate change.
• Compliance and Global Regulatory Affairs – This group is responsible for designing and implementing an effective enterprise-wide framework
to manage and mitigate regulatory compliance risk. In addition, it provides oversight of conduct and culture risk, including sales practice risk
and performs effective challenge of compensation plan changes. This group also builds and maintains credible relationships with our
prudential, market, conduct and securities regulators and acts as a liaison between the regulators and CIBC.
CIBC 2022 ANNUAL REPORT 49
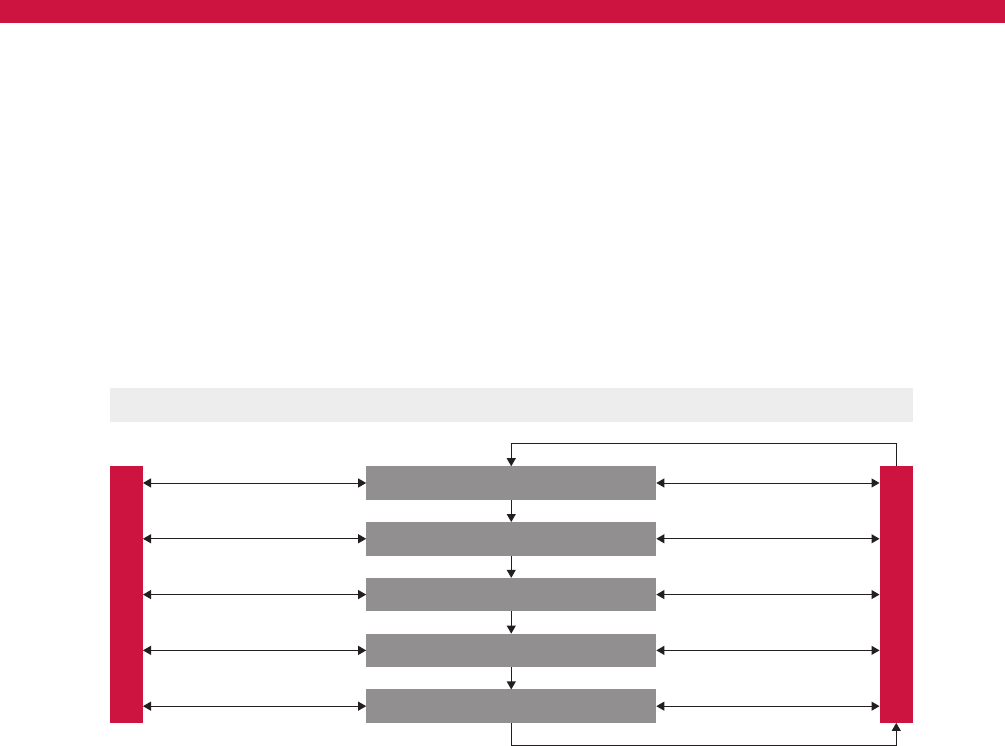
Management’s discussion and analysis
• Enterprise Anti-Money Laundering – This group is responsible for all aspects of compliance with and oversight of requirements relating to AML,
anti-terrorist financing (ATF), and sanctions measures. Enterprise Anti-Money Laundering provides advice to all businesses and functional
groups globally and is responsible for providing an enterprise-wide view of money laundering, terrorist financing and sanctions risks, as well
as guidance and effective independent challenge to control activities. Furthermore, Enterprise Anti-Money Laundering executes a risk-based
approach to deter, detect and report suspected money laundering, terrorist financing and sanctioned activities, in accordance with their
policies and supporting standards.
• Europe and Asia-Pacific Risk Management – This group carries out the mandate of CIBC Risk Management at a regional level under the leadership
of the Senior Vice-President & Chief Risk Officer, Europe & APAC Region, with oversight from the Management Committees and CIBC Luxembourg
Board. The group provides independent oversight for the identification, management, measurement, monitoring and mitigation of risks in Europe
and Asia.
• U.S. Risk Management – This group carries out the mandate of CIBC Risk Management at a regional level under the leadership of the U.S.
CRO, with oversight from the Risk Management Committee of the CIBC Board and the Risk Committees of the Boards of CIBC Bank USA and
CIBC Bancorp USA Inc. The group provides independent oversight for the identification, management, measurement, monitoring and
mitigation of risks in the U.S. region.
Risk management process
Our risk management process is illustrated below:
t
Risk Policies and Limits
Risk Appetite Statement
Monitor and Review
Reporting
Risk Identification and Measuremen
Stress Testing
Risk Treatment / Mitigation
Risk Management Process
Risk appetite statement
Our risk appetite statement defines the amount of risk we are willing to assume in pursuit of our strategic and financial objectives. Our guiding
principle is to practice sound risk management, supported by strong capital and funding positions, as we pursue our client-focused strategy. In
defining our risk appetite, we take into consideration our purpose, vision, values, strategy and objectives, along with our risk capacity (defined by
regulatory constraints). It defines how we conduct business, which is to be consistent with the following objectives:
• Safeguarding our reputation and brand;
• Doing the right thing for our clients/stakeholders;
• Engaging in client-oriented businesses that
we understand;
• Make our client’s goals our own in a professional and radically simple manner;
• Maintaining a balance between risk and returns;
• Retaining a prudent attitude towards tail and event risk;
• Meeting regulatory expectations and/or identifying and having plans in place to address any issues in a timely manner;
• Achieving/maintaining an AA rating; and
• Meeting/exceeding stakeholders’ expectations with respect to the ESG criteria including achieving net zero greenhouse gas emissions.
Our risk appetite statement contains metrics with limits
that define our risk tolerance levels. In addition, we have SBU, functional group and regional
risk appetite statements that are integrated with our overall risk appetite statement that further articulate our business level risk tolerances.
Our risk appetite statement is reviewed annually in conjunction with our strategic, financial and capital planning cycle to ensure alignment and
is approved annually by the Board. To help ensure CIBC stays within its risk appetite, the Board, RMC and senior management regularly receive
and review reporting on our risk profile against the risk appetite limits.
All strategic business decisions, as well as day-to-day business decisions, are governed by our risk appetite framework. Strategic decisions
are evaluated to ensure that the risk exposure is within our risk appetite. Day-to-day activities and decisions are governed by our framework of risk
tolerance limits, policies, standards and procedures that support our risk appetite statement.
50 CIBC 2022 ANNUAL REPORT

Management’s discussion and analysis
Risk culture
Risk culture refers to desired attitudes and behaviours relative to risk management practices. At CIBC, we strive to achieve a consistent and
effective risk culture by:
• Promoting, through both formal and informal channels, a shared accountability of risk identification, management and mitigation;
• Cultivating an environment
of transparency, open communication and robust discussion of risk;
• Setting the appropriate “tone at the top” through clear communication and reinforcement; and
• Identifying and reinforcing behaviours that are aligned with risk appetite, and escalating misaligned behaviours.
Every year, all employees are required to
complete formal training on risk appetite, reputation risk, operational risk, code of conduct, AML and other
key risk topics. By taking this mandatory training, all employees strengthen their basic knowledge of risk management in support of our risk culture.
This training is supplemented by our risk appetite statement, risk management priorities and documents on our internal website. In addition, we
have policies, procedures and limits in place that govern our day-to-day business activity, with escalation procedures for limit breaches outlined
accordingly.
Risk input into performance and compensation
Throughout the year, the Risk Management team manages various compensation risk reviews. These reviews are part of the second line of defence
responsibilities to review and challenge new compensation plans, changes to existing compensation plans and compensation plan closure. In
addition, periodic risk reviews are completed to ensure all compensation plans are risk assessed on a regular basis. All compensation plans are
rated as either high-risk or low-risk with high-risk compensation plans requiring approval from the CRO.
At each year-end, Risk Management provides an assessment of adherence to risk appetite and material risk matters across CIBC. Risk
Management also considers a number of risk inputs to identify matters that may directly impact incentive pools and/or individual compensation
awards and/or performance ratings. Annually, Risk Management reviews the assessment with both the RMC and the MRCC.
The MRCC oversees the performance management and compensation process and is responsible for assisting the Board in its global
oversight of CIBC’s human capital strategy, including talent and total rewards, and the alignment with CIBC’s strategy, risk appetite and controls.
The MRCC’s oversight of human capital strategy includes inclusion and diversity, employee health, safety and wellbeing and other ESG practices
related to their mandate. The MRCC’s key compensation-related responsibilities include:
• Approving CIBC’s compensation philosophy and any material changes to CIBC’s compensation principles or practices;
• Approving new material compensation policies and material changes to existing material compensation policies;
• Reviewing and recommending for Board approval new material compensation plans or changes to existing material compensation plans;
• Reviewing a report on non-material plans;
• Assessing the appropriateness and alignment of compensation relative to actual business performance and risks;
• Reviewing and recommending for Board approval incentive compensation funding and allocations, based on an assessment of business
performance and risk;
• Reviewing and recommending for Board approval individual compensation target and compensation for the ExCo, including the CEO and
other key officers; and
• Approving individual compensation for employees with total direct compensation above a certain materiality threshold.
CIBC 2022 ANNUAL REPORT 51

Management’s discussion and analysis
Risk policies and limits
Our risk policies and limits framework is intended to ensure that risks are appropriately identified, measured, monitored and controlled in accordance
with our risk appetite. For most risks, we have developed an overarching framework document that sets out the key principles for managing the
associated risks and our key risk policies and limits. This framework is supported by standards, guidelines, processes, procedures and controls that
govern day-to-day activities in our businesses. Oversight is provided by management committees, as well as the Board/Board committees.
Key risk policies and management committees are illustrated below:
Risk Appetite Statement and Risk Appetite Framework
Risk Management Framework
Risk
Credit
Market
Operational
Reputation
Liquidity
Strategic
Management Oversight
Credit Committee
Personal and Business Banking
Credit Risk Committee
Global Risk Committee
Traded Risk Committee
Global Risk Committee
Global Asset Liability
Committee
Traded Risk Committee
Operational Risk and Control
Committee
Global Risk Committee
Technology Operational Risk
Committee
Model and Parameter Risk
Committee
Cyber Security Committee
Traded Risk Committee
Third Party Risk Council
Executive Fraud Risk Council
Reputation and Legal Risks
Committee
Global Asset Liability
Committee
Global Risk Committee
Executive Committee
Global Risk Committee
Risk Limits
Credit Concentration Limits
Delegated Credit Approval
Authorities
Trading Credit Risk Limits
Market Risk Limits
Delegated Risk Authorities
Key Risk Indicators
Liquidity and Funding Limits
Pledging Limits
Key Risk Indicators
Risk Appetite Statement
Overarching
Framework / Policy
Credit Risk Management
Policy
Trading Credit Risk
Management Policy
Market Risk Management
Policy
Structural Risk Management
Policies
Operational Risk Management
Framework
Control Framework
Conduct and Culture Risk
Framework
Global Reputation Risk
Management Framework and
Policy
Liquidity Risk Management
Policy
Pledging Policy
Strategic Planning Policy
Regulatory Global Risk CommitteeKey Risk IndicatorsRegulatory Compliance
Management Policy
AML Executive Steering
Committee
Risk Appetite Statement
Key AML Metrics
Enterprise Anti-Money
Laundering Framework and
Enterprise Anti-Money
Laundering and Anti-Terrorist
Financing Policy
52 CIBC 2022 ANNUAL REPORT

Management’s discussion and analysis
Risk identification and measurement
Risk identification and measurement are important elements of CIBC’s risk management framework. Risk identification is a continuous process,
generally achieved through:
• Regular assessment of risks associated with lending and trading credit exposures;
• Ongoing monitoring of trading and non-trading portfolios;
• Assessment of
risks in new business activities and processes;
• Assessment of risks in complex and unusual business transactions;
• Regular monitoring of the overall risk profile considering market developments and trends, and external and internal events; and
• Ongoing monitoring of management operations and processes.
Risk Management maintains a “Risk Register” to list all material risks facing CIBC. The inventory is based on the risks
inherent in our businesses and
updated through various processes, illustrated in the following chart, to reflect changes in the nature of the risks we are facing. The Risk Register is
used to support our ICAAP, either explicitly in the economic and regulatory capital calculations, or implicitly through the buffer of actual capital over
economic capital and regulatory capital.
Macro and
External
Risks
Assessment of
Risk Level
(probability /
severity
considerations)
Risk Register
Internal Capital
Adequacy
Assessment
Process
(ICAAP)
Risks Inherent
in CIBC’s
Businesses
Risk Identification Processes
Strategic Business Reviews
Change Initiative Risk Assessment Process
Risk and Control Self Assessments
Strategic and Emerging Risk Themes
External and Peer Benchmarking
Regulatory Reviews
The decision to register a new risk is based on its risk assessment through our risk identification processes and includes criteria such as severity,
measurability and probability. Furthermore, the decision on the amount of capital allocated to cover the new risk brought on the books will take into
consideration the effectiveness and impact of the risk mitigants available.
We have enterprise-wide methodologies, models and techniques in place to measure both the quantitative and qualitative aspects of risks,
appropriate for the various types of
risks we face. These methodologies, models and techniques are subject to independent assessment and review
to ensure that the underlying logic remains sound, that model risks have been identified and managed, that use of the models continues to be
appropriate and outputs are valid.
Risk is usually measured in terms of expected loss, unexpected loss, and economic capital.
Expected loss
Expected loss represents the loss that is statistically expected to occur in the normal course of business, with adjustments for conservatism, in a
given period of time.
In respect of credit risk, the parameters used to measure expected loss are PD, LGD and EAD. These parameters are updated regularly and
are based on our historical experience through the cycle and benchmarking of credit exposures. Unlike the PD, LGD and EAD parameters used for
calculating ECL on our consolidated financial statements, the PD, LGD and EAD parameters used for regulatory capital purposes are not adjusted
for forward-looking information.
For trading market risks, VaR is a statistical technique used to measure risk. VaR is an estimate of the loss in market value for a given level of
confidence that we would expect to incur in our trading portfolio due to an adverse one-day movement in market rates, implied volatility and prices
using the most recent 500 trading days. We also use stressed VaR to estimate an expected loss over a 10 day holding period and using a one year
historical window when relevant market factors were in distress.
For trading credit risks associated with market value based products, we use models to estimate exposure relative to the value of the portfolio
of trades with each counterparty, giving consideration to market rates and prices.
Unexpected loss and economic capital
Unexpected loss is the statistical estimate of the amount by which actual losses might exceed expected losses over a specified time horizon,
computed at a given confidence level. We use economic capital to estimate the level of capital needed to protect us against unexpected losses.
Economic capital allows us to assess performance on a risk-adjusted basis.
We also use techniques such as sensitivity analysis and stress testing to help ensure that the risks remain within our risk appetite and that our
capital is adequate to cover those risks. Our stress testing program includes evaluation of the potential effects of various economic and market
scenarios on our risk profile, earnings and capital. Refer to the “Capital management” section for additional details.
CIBC 2022 ANNUAL REPORT 53

Management’s discussion and analysis
Model risk management
Model risk management encompasses sound development, independent validation, and ongoing monitoring and review of the models as well as
governance and controls that are proportionate to the risks. Our model inventory includes, but is not limited to, models that relate to risk
measurement (including VaR, economic and regulatory capital), pricing, mark-to-market (MTM), credit risk rating and scoring models, credit models
for the calculation of loss severity and stress testing, and models for the calculation of ECL under IFRS 9. CIBC’s approach to provide effective
governance and oversight for model risk management comprises the following key elements:
• Governance and oversight by management committees, including the Model and Parameter Risk Committee (MPRC), senior management and
the Board;
• Policies, procedures and standards to outline applicable roles and responsibilities of the various oversight groups and to provide guidance to
identify, measure, control and monitor model risk throughout the model’s life cycle; and
• Controls for key operational aspects of model risk management including maintaining a model inventory, model risk ranking, model risk
attestation
and ongoing monitoring and reporting.
The MPRC is a subcommittee of the Operational Risk and Control Committee (ORCC) and is responsible
for reviewing and approving proposals for
new and/or modified regulatory, economic capital and IFRS 9 models and provides oversight of CIBC’s regulatory, economic capital and IFRS 9
models and parameters for credit, market and operational risks. The MPRC has accountability and responsibility for model and parameter
approvals, parameter performance monitoring, validation oversight, and policy oversight.
Model risk mitigation policies
We have policies, procedures, standards and controls to ensure effective model risk management for CIBC. A model review and validation is the
independent effective challenge that documents the model risk and ensures models are sound and we can rely on their output. The model review
and validation process includes:
• Review of model documentation;
• Comprehensive, systematic testing of key model parameters on implementation to ensure results are as expected;
• Replication of the risk quantification process to determine whether the model implementation is faithful to the model specifications;
• Review of whether the model/parameter concepts and assumptions are appropriate and robust;
• Accuracy testing to assess the calibration and accuracy of the risk components including, for example, the discriminative power of rating
systems and the reasonableness of capital parameters;
• Sensitivity testing to analyze the sensitivity of model/parameter outputs to model/parameter assumptions and key inputs;
• Scenario and stress testing of the model outputs to key inputs;
• Back-testing by comparing actual results with model-generated risk measures;
• Benchmarking to other models and comparable internal and external data;
• Review of the internal usage of the model/parameter applications to ensure consistency of application;
• Reporting of model status to the MPRC, supported through an up-to-date inventory of regulatory models and parameters;
• A quarterly attestation process for model owners in order to ensure compliance with the Model Risk and Validation Policy; and
• A comprehensive validation report that identifies the conditions for valid application of the model and summarizes these findings to the model
owners, developers and users.
Once a model has been approved for use, ongoing monitoring becomes a joint responsibility of model users, owners and validators.
Stress testing
Stress testing supplements our other risk management tools by providing an estimate of the potential impacts of plausible but stressed economic
scenarios and risk factors. Results of stress testing are interpreted in the context of our risk appetite, including metrics for capital adequacy.
Enterprise-wide stress testing, capital planning and financial planning processes are integrated for a comprehensive information system. See the
“Capital management” section for detailed discussion on our enterprise-wide stress testing.
Risk treatment and mitigation
Risk treatment and mitigation is the implementation of options for modifying risk levels. We pursue risk mitigation options in order to control our risk
profile in the context of our risk appetite. Our objective is to proactively consider risk mitigation options in order to optimize results.
Discussions regarding potential risk mitigation strategies are held between Risk Management and the lines of business, and at the GRC or
GALCO and at the RMC for governance and oversight, as appropriate. In evaluating possible strategies, considerations include costs and benefits,
residual risks (i.e., risks that are retained), secondary risks (i.e., those caused by the risk mitigation actions), and appropriate monitoring and review
to track results.
Risk controls
Our risk management framework also includes a comprehensive set of risk controls, designed to ensure that risks are being appropriately identified
and managed. Our risk controls are part of CIBC’s overall Control Framework, developed based on the Committee of Sponsoring Organizations of
the Treadway Commission’s (COSO) widely accepted “Internal Control – Integrated Framework”. The Control Framework also draws on elements of
the OSFI Supervisory Framework and Corporate Governance Guidelines.
The Board, primarily through the RMC, approves certain credit risk limits and delegates specific transactional approval authorities to the CEO or
jointly to the CEO and CRO. The RMC must approve transactions that exceed delegated authorities. Delegation of authority to business units is
controlled to ensure decision-making authorities are restricted to those individuals with the necessary experience levels. In addition, CIBC has rigorous
processes to identify, evaluate and remediate risk control deficiencies in a timely manner. Regular reporting is provided to the RMC to evidence
compliance with risk limits. Risk limits and the delegation of authority to the CEO or jointly to the CEO and CRO are reviewed annually by the RMC.
Risk monitoring and reporting
To monitor CIBC’s risk profile and facilitate evaluation against the risk appetite statement, a number of measurement metrics have been established,
with regular reporting against these metrics provided to the GRC and the RMC. This reporting enables decisions on growth and risk mitigation
strategies.
Exposures are also regularly monitored against limits, with escalation protocols for limit excesses, should they occur. Escalation protocols
ensure awareness at appropriate levels and facilitate management of excesses that is consistent with our risk appetite.
Regular management reports on each risk type are also prepared to facilitate monitoring and control of risk at a more granular level.
54 CIBC 2022 ANNUAL REPORT

Management’s discussion and analysis
Top and emerging risks
We monitor and review top and emerging risks that may affect our future results, and take action to mitigate potential risks. We perform in-depth
analyses, which may include stress testing our exposures relative to the risks, and we provide updates and related developments to the Board on a
regular basis. Top and emerging risks are those that we consider to have potential negative implications that are material for CIBC. This section
describes those top and emerging risks, as well as regulatory and accounting developments that are material for CIBC.
Inflation, interest rates and economic growth
High inflation exacerbated by global supply chain issues, including from the war in Ukraine, continues to drive tightening in monetary policies
globally and GDP growth forecasts have been revised downward, increasing the risk of recession. We are closely monitoring the macroeconomic
environment and assessing its potential adverse impact on our clients, counterparties and businesses. Further details on the macroeconomic
environment are provided in the “Economic and market environment – Outlook for calendar year 2023” section.
Canadian consumer debt and the housing market
OSFI’s Guideline B-20 was introduced in 2012, with a subsequent update effective January 2018, to provide its expectations for strong residential
mortgage underwriting for federally regulated lenders. The revised guideline had its intended effect as debt-to-income ratios flattened in 2018–2019.
Subsequently, to counter the unfavourable economic impact of COVID-19, the government put in place several support programs, the Bank of
Canada cut interest rates and CIBC and other Canadian banks supported clients with relief programs. The housing market rebounded strongly and
prices grew, increasing the risk that new borrowers may be unable to repay loan obligations due to higher indebtedness levels. In June 2021, as
part of the updated Guideline B-20, we started to qualify uninsured and insured mortgages at the higher of the mortgage contract rate plus 2%, or
5.25%. In March 2022, the Bank of Canada started to increase interest rates with further hikes expected, leading to higher mortgage rates for new
and renewing contracts. A downward correction in housing activity and house prices would increase risk-weighted assets and potentially lead to
higher credit losses. We regularly run stress tests and perform scenario and sensitivity analyses to assess the potential impact of a number of
macroeconomic factors, including interest rates, unemployment and housing prices, on borrowers’ ability to repay loan obligations and portfolio
performance. See the “Real estate secured personal lending” section for the guidance issued by OSFI in June 2022 on the Clarification on the
Treatment of Innovative Real Estate Secured Lending Products under Guideline B-20.
Geopolitical risk
The level of geopolitical risk escalates at certain points in time. While the specific impact on the global economy and on global credit and capital
markets would depend on the nature of the event, in general, any major event could result in instability and volatility, leading to widening spreads,
declining equity valuations, flight to safe-haven currencies and increased purchases of gold. In the short run, market disruption could hurt the net
income of our trading and non-trading market risk positions. Geopolitical risk could reduce economic growth, and in combination with the potential
impacts on commodity prices and the recent rise of protectionism, could have serious negative implications for general economic and banking
activities. Current areas of concern include:
• The war in Ukraine;
• Ongoing U.S., Canada and China relations and trade issues;
• Global uncertainty and market repercussions pertaining to the COVID-19 pandemic as discussed below;
• Rising civil unrest and activism globally;
• Implications of the U.S. “Buy American” policy;
• Relations between the U.S. and Iran;
• Tensions in the Middle East; and
• Concerns following the agreed-upon Brexit deal.
While it is impossible to predict where new geopolitical disruption will occur, we do pay particular attention to markets and regions with existing or
recent historical instability to assess the impact of these environments on the markets and businesses in which we operate.
Pandemic risk
The COVID-19 pandemic disrupted the global economy, financial markets, supply chains and business productivity in unprecedented and
unpredictable ways. Future developments, such as the severity and duration of the pandemic, the emergence and progression of new variants, and
actions taken by governments, monetary authorities, regulators, financial institutions and other third parties in response to a resurgence of cases,
continue to impact our outlook.
If further variants continue to emerge and vaccines are not able to effectively mitigate the impacts in a timely manner and if broader economic
closures are reinstated to address future waves of infection, the effect on the economy and financial markets could worsen and result in further
volatility. Unexpected developments in financial markets, regulatory environments, or consumer behaviour and confidence may have additional
adverse impacts on our business, results of operations, reputation and financial condition.
Climate risk
The physical effects of climate change along with regulations designed to mitigate its negative impacts will have a measurable impact on
communities and the economy. The physical risks of climate change resulting from severe weather events and systemic issues such as rising sea
levels can impact CIBC’s profitability through disruptions in our own operations and damage to critical infrastructure. Transition risks, which arise as
society adjusts towards a low-carbon future, can impact the financial health of our clients as changes in policy and technology aimed at limiting
global warming can increase their operating costs and reduce profitability, while translating into potentially higher credit losses for the bank. We are
also exposed to reputational risks due to changing stakeholder expectations related to action or inaction in addressing climate-related risks. As the
world transitions to a low-carbon economy, we are committed to understanding and responsibly managing the relevant impacts of climate change
on our operations and our business activities. In support of this commitment, we announced our ambition to achieve net zero greenhouse gas
emissions associated with operational and financing activities by 2050, including interim targets to reduce the carbon intensity of our financed
emissions in the oil and gas and power generation sectors by 2030. This builds on our environmental leadership and enhances our ability to
continue creating long-term shareholder value as the landscape of climate-related risks and opportunities evolves.
Setting net-zero targets across a complex set of financing activities is an emerging practice and our methodology is informed by international
standards and current industry best practices. With our first targets in place, we are now working to accelerate our climate aspirations by
embedding net-zero considerations through our business practices and financing activities.
CIBC 2022 ANNUAL REPORT 55

Management’s discussion and analysis
There is an increasing demand for disclosure around climate-related risk identification and mitigation. We support the Task Force on Climate-
related Financial Disclosure’s (TCFD’s) recommendations for globally consistent and comparable climate disclosure and recently published our
second standalone report, which presents information about CIBC’s efforts towards aligning our climate disclosure with the TCFD framework. We
are proactively collaborating with our Canadian peer banks to ensure consistency and comparability as we continue to improve our TCFD reporting.
We keep informed of emerging risks by engaging with stakeholders through established partnerships, such as the United Nations Environment
Programme – Finance Initiative (UNEP-FI) and we are also a signatory to external sustainability frameworks such as the Partnership for Carbon
Accounting Financials (PCAF) and the Global Reporting Initiative (GRI) to ensure comparable sustainability disclosure.
In the past year, a number of regulators and standard-setting organizations announced intentions of preparing disclosure frameworks related
to climate change risks. Key among them is the IFRS Foundation’s establishment of the International Sustainability Standards Board (ISSB) to
develop global sustainability disclosure standards for the financial markets and to increase connectivity with accounting standards. In addition,
regulators such as the SEC, OSFI and the Canadian Securities Administrators (CSA) have released proposed requirements for climate risk
disclosures including defining guidance and expectations related to climate risk management practices and metrics to measure this risk. In May
2022, OSFI released draft Guideline B-15 on Climate Risk Management. OSFI’s principles-based expectations set out in this guideline focus on
understanding and mitigating the impact of climate-related risks to business models and strategy, governance and risk management practices used
to manage climate-related risks, and remaining financially and operationally resilient through severe climate scenarios. In addition, in October 2021,
the CSA released a proposed new National Instrument 51-107 on climate-related disclosures, which builds upon the current TCFD guidance to
address the need for consistent and comparable climate information to inform investment decisions.
Potential divergence among the regulators in disclosure expectations, coupled with the pace at which the regulatory landscape changes, pose
operational risks to us. We continue to monitor these developments and evolve our approach to support future regulatory requirements.
See the “Environmental
and social risk” section for additional information.
Technology, information and cyber security risk
Financial institutions like CIBC are evolving their use of technology and business processes to improve the client experience and streamline
operations. At the same time, cyber threats and the associated financial, reputation and business interruption risks have also increased. We
continue to actively manage these risks through strategic risk reviews, enterprise-wide technology and information security programs, with the goal
of maintaining overall cyber-resilience that prevents, detects, and responds to threats such as data breaches, malware, unauthorized access, and
denial-of-service attacks, which can result in damage to CIBC systems and information, theft or disclosure of confidential information, unauthorized
or fraudulent activity, and service disruption at CIBC or its service providers, including those that offer cloud services.
Given the importance of electronic financial systems, including secure online and mobile banking provided by CIBC to its clients, CIBC
monitors the changing environment globally, including cyber threats, mitigation strategies and evolving regulatory requirements, in order to improve
our controls and processes to protect our systems and client information. In addition, we perform cyber security preparedness, testing, and
recovery exercises to validate our defences, benchmark against best practices and provide regular updates to the Board. We have well-defined
cyber incident response protocols and playbooks in the event that a security incident or breach occurs. We also have cyber insurance coverage to
help mitigate against certain potential losses associated with cyber incidents. Our insurance coverage is subject to various terms and provisions,
including limits on the types and amounts of coverage relating to losses arising from cyber incidents. We periodically assess our insurance
coverage based on our risk tolerance and limits. Despite our commitment to information and cyber security, and given the rapidly evolving threat
and regulatory landscape, coupled with a changing business environment, it is not possible for us to identify all cyber risks or implement measures
to prevent or eliminate all potential cyber incidents from occurring. However, we monitor our risk profile for changes and continue to refine
approaches to security protection and service resilience to minimize the impact of any cyber incidents that may occur.
Commodity prices
Commodity markets continued to exhibit elevated volatility with both oil and gas prices trading in a wide range over recent months, as several
factors weigh heavily on supply and demand fundamentals. Supply-side constraints continue to manifest as a result of the ongoing conflict in
Ukraine and resulting sanctions on Russia, with European markets being particularly susceptible to an interruption in Russian natural gas supplies.
The macroeconomic environment is tempering demand expectations given the outlook for reduced growth, while other factors such as the
Organization of the Petroleum Exporting Countries production cuts, winter temperatures, a potential slowdown in China and U.S. releases from
strategic reserves are influencing prices and volatility in the near term. We also continue to monitor longer-term developments as geopolitical
tensions, and a desire for energy independence, face off against environmental considerations in a manner that will shape energy policies and
trade flows in the years to come.
Disintermediation risk
Canadian banking clients are increasingly shifting their service transactions from brick-and-mortar banking centres to digital platforms. Competitive
pressure from digital disruptors, both global technology leaders and smaller financial technology entrants, is increasing and the risk of
disintermediation continues to grow due to the level of sophistication of these non-traditional competitors, and increased adoption of emerging
technologies. The emergence of Decentralized Finance, where fully automated financial applications are programmed into a blockchain network
using digital assets, such as cryptocurrencies, is one such technology trend that enables parties to transact without third-party intermediaries such
as banks. However, in Canada, the risk of blockchain technology disintermediating banks in the near-term appears low. Currently, Canadians have
access to robust financial infrastructure that delivers much of the value promised within a blockchain-based transactional network. For banks, while
blockchain technology offers an effective approach to addressing counterparty risk, the value a bank brings to a client relationship extends beyond
managing counterparty risk; especially as clients develop more complex financial considerations that require the expertise and empathy of a
human-centered approach. Decentralized Finance may evolve in ways that make it more accessible to the general public, but without appropriate
regulation to address the elevated levels of volatility, fraud, theft, and associated risks, its appeal may remain limited to Canadians with a higher risk
tolerance. Advances in artificial intelligence (AI) and automation also have the potential to transform business models over time, including the
delivery of financial services advice through automated processes. CIBC is maturing its AI capabilities with a focus on maintaining customer
confidence and trust by building AI practices that apply principles such as fairness, ethics, transparency and security.
We manage disintermediation risk through strategic reviews as well as investment in emerging channels, in data and analytics capabilities, and in
technology and innovation in general, to meet our clients’ changing expectations, while working to reduce our cost structure and simplify operations.
We maintain a central and coordinated approach to innovation to manage these risks while also benefitting from the opportunities they bring.
56 CIBC 2022 ANNUAL REPORT

Management’s discussion and analysis
Third-party risk
The Board and senior management recognize the establishment of third-party relationships as important to CIBC’s business model and therefore
leverage them to achieve CIBC’s business objectives. With the introduction of new technologies, new foreign jurisdictions and increasing reliance
on sub-contractors, the third-party landscape continues to evolve. While such relationships may benefit us through reduced costs, increased
innovation, improved performance and increased business competitiveness, they can also introduce risks of failure or disruption to CIBC through
breakdowns in people, processes or technology or through external events that impact these third parties.
To mitigate third-party risks, prepare for future third-party risks and changing regulatory expectations, and to ensure existing processes and
internal controls are operating effectively, we rely on our strong risk culture and established the Third Party Risk Management program, which
includes policies, procedures, expertise and resources dedicated to third-party risk management. The program identifies and manages risks that
arise from third-party relationships from the point of planning through the life cycle of the business arrangement and supports the maintenance of
collaborative relationships that advance our strategic direction and operational needs within our risk appetite.
Anti-money laundering
Money laundering, terrorist financing activities and other related crimes pose a threat to the stability and integrity of a country’s financial sector and
its broader economy. In recognition of this threat, the international community has made the fight against these illegal activities a priority. We are
committed to adhering to all regulatory requirements pertaining to AML/ATF and Sanctions in the jurisdictions where we operate and implementing
best practices to minimize the impact of such activities. In Canada, to improve the effectiveness of the AML/ATF regime, amendments to the
regulations under the Proceeds of Crime (Money Laundering) and Terrorist Financing Act continue to be published (with some provisions coming
into force by 2024). In accordance with these amendments, we have implemented procedures, processes and controls with respect to client due
diligence, record keeping and reporting as well as mandatory annual AML/ATF and Sanctions training for all employees to ensure that relevant
regulatory obligations are met in each jurisdiction where we operate. Since March 2022, Canada, the U.S., U.K. and the European Union have
expanded economic sanctions on Russia over the war in Ukraine, which continue to develop. While overall exposure is deemed limited, we continue
to monitor and enhance controls, as required to respond to this evolving situation.
U.S. banking regulation
Our U.S. operations are subject to supervision by the Board of Governors of the Federal Reserve System (Federal Reserve), and are also subject to
a comprehensive federal and state regulatory framework. Our wholly owned subsidiary, CIBC Bancorp USA Inc. (CIBC Bancorp), is a financial
holding company subject to regulation and supervision by the Federal Reserve under the Bank Holding Company Act of 1956, as amended. CIBC
Bank USA, our Illinois-chartered bank, is subject to regulation by the U.S. Federal Deposit Insurance Corporation (FDIC), the Federal Reserve and
the Illinois Department of Financial and Professional Regulation. CIBC’s New York branch is subject to regulation and supervision by the New York
Department of Financial Services and the Federal Reserve. Certain market activities of our U.S. operations are subject to regulation by the SEC and
the U.S. Commodity Futures Trading Commission, as well as other oversight bodies.
The scope of these regulations impact our business in a number of ways. For example, both CIBC Bancorp and CIBC Bank USA are required
to maintain minimum capital ratios in accordance with Basel III rules adopted by the U.S. bank regulatory agencies, which differ in some respects
from Canada’s Basel III rules. Under the U.S. bank regulatory framework, both CIBC and CIBC Bancorp are expected to provide a source of
strength to the subsidiary bank and may be required to commit additional capital and other resources to CIBC Bank USA in the event that its
financial condition were to deteriorate, whether due to overall challenging economic conditions in the U.S., or because of business-specific issues.
The Federal Reserve (in the case of CIBC Bancorp), and the FDIC and the Illinois Department of Financial and Professional Regulation (in the case
of CIBC Bank USA) also have the ability to restrict dividends paid by CIBC Bancorp or CIBC Bank USA, which could limit our ability to receive
distributions on our capital investment in our U.S. banking operations.
As our combined U.S. operations grow, we will become subject to additional enhanced prudential standards under the Federal Reserve’s
regulations applicable to foreign banking organizations. Furthermore, the Federal Reserve and the FDIC may also restrict our U.S. operations,
organic or inorganic growth, if, among other things, they have supervisory concerns about risk management, AML or compliance programs and
practices, governance and controls, and/or capital and liquidity adequacy at CIBC Bancorp, CIBC Bank USA or our New York branch, as
applicable. In some instances, banking regulators may take supervisory actions that may not be publicly disclosed, which may restrict or limit our
New York branch and our U.S. subsidiaries from engaging in certain categories of new activities or acquiring shares or control of other companies.
Any restrictions imposed by banking regulators could negatively impact us by loss of revenue, limitations on the products or services we offer, and
increased operational and compliance costs.
The U.S. regulatory environment continues to evolve and future legislative and regulatory developments may impact CIBC.
Interbank Offered Rate transition
Interest rate benchmarks including the London Interbank Offered Rate (LIBOR) and other similar benchmarks, are being reformed and replaced by
alternative benchmark rates (alternative rates) that are largely based on traded markets. The United Kingdom’s (U.K.’s) Financial Conduct Authority
(FCA) originally announced in July 2017 that it would not compel banks to submit LIBOR rates beyond 2021. Consistent with this announcement, as
of December 31, 2021, a formal cessation of GBP, EUR, JPY and CHF LIBORs occurred, with fallback to the alternative rates triggered. In addition,
trading of USD LIBOR has been curtailed in advance of its forthcoming cessation in June 2023 as the industry continues its transition away from
LIBOR as a reference rate underpinning loans, derivatives and cash products globally. We continue to monitor industry developments in this space
and have also implemented controls to ensure new USD LIBOR trades are for permitted purposes only during this transition. Furthermore, in
December 2021 the Canadian Alternative Reference Rate working group (CARR) recommended that the Canadian Dollar Offered Rate (CDOR)
should cease calculation and publication after June 2024 with CORRA suggested as the replacement benchmark rate. On May 16, 2022, the CDOR
administrator announced the cessation of CDOR consistent with the recommendations outlined by CARR. See the “Other regulatory developments”
section for further details.
Tax reform
As many governments took on additional debt to support the economy during the pandemic and look to ensure a strong post-pandemic recovery,
there are tax reform proposals that could increase taxes affecting CIBC.
The Canadian Federal government published draft legislation in 2022 that if enacted would increase our income taxes as described in the
“Financial results review – Taxes” section.
Canada is one of 137 members of The Organisation for Economic Co-Operation and Development (OECD)/G20 Inclusive Framework on Base
Erosion and Profit Shifting that joined a Two-Pillar plan for international tax reform agreed to in October 2021. The Two-Pillar framework’s stated
purpose is to ensure that large Multinational Enterprises (MNEs) pay tax where they operate and earn profit. Pillar One focuses on the taxation of digital
CIBC 2022 ANNUAL REPORT 57

Management’s discussion and analysis
services and Pillar Two establishes rules for the application of the 15% global minimum tax. Pillar One is to be implemented by a multilateral
convention to come into effect in 2023, which will require all parties to remove their Digital Services Taxes. If Pillar One implementation is delayed, the
Canadian government plans to enact draft Digital Services Tax legislation, which will come into effect no earlier than January 1, 2024. The Canadian
government held public consultation on the implementation of Pillar Two model rules, but no legislation has yet been proposed.
Corporate transactions
CIBC seeks out acquisition and divestiture opportunities that align with its strategy, risk appetite and financial goals. The ability to successfully
execute on our strategy to integrate acquisitions, and the ability to anticipate and manage risks associated with such corporate transactions are
subject to various factors such as receiving regulatory and shareholder approval on a timely basis and on favourable terms, retaining clients and
key personnel, realizing synergies and efficiencies, controlling integration and acquisition costs, and changes in general business and economic
conditions, among others.
Although many of the factors are beyond our control, their impact is partially mitigated by conducting due diligence before completing the
transaction and developing and executing appropriate plans. However, given the inherent uncertainty involved in such corporate transactions, we
cannot anticipate all potential events, facts and circumstances that may arise and there could be an adverse impact on our operations and financial
performance as a result of such corporate transactions.
Regulatory developments
See the “Taxes”, “Capital management”, “Credit risk”, “Liquidity risk” and “Accounting and control matters” sections for additional information on
regulatory developments.
Accounting developments
See the “Accounting and control matters” section and Note 31 to the consolidated financial statements for additional information on accounting
developments.
Risks arising from business activities
The chart below shows our business activities and related risk measures based upon regulatory RWA and average allocated common equity as at
October 31, 2022:
CIBC
SBUs
Canadian Personal
and Business Banking
Canadian Commercial
Banking and Wealth
Management
U.S. Commercial Banking
and Wealth Management
Capital Markets
Corporate and Other
Business
activities
• Deposits
• Residential mortgages
• Personal loans
• Credit cards
• Business lending
• Insurance
• Commercial banking
• Full-service brokerage
• Asset management
• Private wealth management
• Commercial banking
• Asset management
• Private wealth management
• Personal and small business
banking
• Corporate banking
• Global markets
• Investment banking
• Direct financial services
• International banking
• Investment portfolios
• Joint ventures
• Functional and support
groups (see page 33)
Balance
sheet
(1)
($ millions)
Average assets 305,070
Average deposits 204,003
($ millions)
Average assets 84,693
Average deposits 93,950
($ millions)
Average assets 53,983
Average deposits 45,633
($ millions)
Average assets 284,259
Average deposits 100,484
($ millions)
Average assets 172,208
Average deposits 229,619
RWA
($ millions)
Credit risk 61,948
Market risk –
Operational risk 12,150
($ millions)
Credit risk 62,415
Market risk –
Operational risk 7,569
($ millions)
Credit risk
(2)
60,165
Market risk 56
Operational risk 3,879
($ millions)
Credit risk
(3)
66,935
Market risk 8,873
Operational risk 9,280
($ millions)
Credit risk
(4)
21,613
Market risk 301
Operational risk 450
Average
allocated
common
equity
(5)
(%)
Proportion of total 19
CIBC
Comprising:
Credit risk 77
Market risk –
Operational risk 16
Other
(6)
7
(%)
Proportion of total 19
CIBC
Comprising:
Credit risk 79
Market risk –
Operational risk 10
Other
(6)
11
(%)
Proportion of total
25
CIBC
Comprising:
Credit risk
58
Market risk
–
Operational risk
4
Other
(6)
38
(%)
Proportion of total
21
CIBC
Comprising:
Credit risk
78
Market risk
10
Operational risk
11
Other
(6)
1
(%)
Proportion of total
16
CIBC
Comprising:
Credit risk
55
Market risk
1
Operational risk
4
Other
(6)
40
Risk profile
We are exposed to credit, market, liquidity, operational, and other risks, which primarily include strategic, insurance, technology, information and cyber
security, reputation and legal, regulatory compliance, and environmental and social risks.
(1) Average balances are calculated as a weighted average of daily closing balances.
(2) Includes CCR of $9 million, which comprises derivatives and repo-style transactions.
(3) Includes CCR of $17,234 million, which comprises derivatives and repo-style transactions.
(4) Includes CCR of $227 million, which comprises derivatives and repo-style transactions.
(5) Average allocated common equity is a non-GAAP measure. For additional information on the composition of this non-GAAP measure, see the “Non-GAAP measures” section.
(6) Represents average allocated common equity relating to capital deductions, such as goodwill and intangible assets, in accordance with the rules in OSFI’s CAR Guideline.
58 CIBC 2022 ANNUAL REPORT

Management’s discussion and analysis
Credit risk
Credit risk is the risk of financial loss due to a borrower or counterparty failing to meet its obligations in accordance with contractual terms.
Credit risk arises out of the lending businesses in each of our SBUs and in International banking, which is included in Corporate and Other.
Other sources of credit risk consist of our trading activities, which include our OTC derivatives, debt securities, and our repo-style transaction
activity. In addition to losses on the default of a borrower or counterparty, unrealized gains or losses may occur due to changes in the credit
spread of the counterparty, which could impact the carrying or fair value of our assets.
Governance and management
Credit risk is managed through the three lines of defence model. The first line of defence consists of the frontline businesses and control groups that
assess and manage the risks associated with their activities. They own the risks and the controls that mitigate the risks – this is the first line of
defence.
The second line of defence is Risk Management, which takes a broader, independent view and is responsible for the adjudication and
oversight of credit risks associated with CIBC’s personal, small business, commercial, corporate and wealth management activities.
Internal audit is the third line of defence, providing reasonable assurance to senior management and the Audit Committee of the Board on the
effectiveness of CIBC’s governance practices, risk management processes, and internal control as part of its risk-based audit plan and in
accordance with its mandate as described in the Internal Audit Charter.
Senior management reports to the GRC and RMC at least quarterly on material credit risk matters, including material credit transactions,
compliance with limits, portfolio trends, impaired loans and credit loss provisioning levels. Provision for (reversal of) credit losses is reviewed by the
RMC and the Audit Committee quarterly.
Specific to the management of credit risk, Risk Management is mandated to provide enterprise-wide oversight of the management of credit
risk in CIBC’s credit portfolios, including the measurement, monitoring and control of credit risk and the management of credit risk models. Key
groups in Risk Management with credit risk responsibility include:
Capital Markets Risk Management: This group is responsible for independent oversight of the measurement, monitoring and control of traded and
non-traded market risk, liquidity risk and trading credit risk, including adjudication of trading credit facilities for banks, non-bank financial entities,
prime brokerage clients and central clearing counterparties. In addition, Capital Markets Risk Management is responsible for the risk management
of sovereign and country risk, securitizations and the oversight of the Global Collateral Finance framework covering repos and securities lending.
Global Credit Risk Management: This group is responsible for the adjudication and oversight of credit risks associated with our commercial,
corporate and wealth management credit portfolios, management of the risks in our investment portfolios, as well as management of special loan
portfolios.
Model Validation, Global Operational Risk Management: This group is responsible for the oversight of model validation practices. Model
validation constitutes the independent set of processes, activities and ongoing documentary evidence that models and parameters are sound and
CIBC can rely on their output.
Enterprise Risk Management: This group is responsible for enterprise-wide analysis, including enterprise-wide stress testing and reporting, risk
data systems and models, economic and regulatory capital methodologies as well as transaction-specific environmental and social risk.
Risk Analytics and Credit Decisioning: This group manages credit risk in personal and small business products offered through the various
distribution channels (e.g., residential mortgages, credit cards, personal loans/lines of credit, small business loans) and performs analytics to
optimize retail credit performance, along with collections and AML outcomes.
U.S. Risk Management: This group carries out the mandate of CIBC Risk Management at a regional level and provides independent oversight of
the identification, management, measurement, monitoring and control of credit risks in the U.S. Commercial Banking and Wealth Management SBU.
Adjudication and oversight above delegated levels is provided by the CRO, GRC and RMC.
Policies
To control credit risk, prudent credit risk management principles are used as a base to establish policies, standards and guidelines that govern
credit activities as outlined by the credit risk management policy.
The credit risk management policy supplements CIBC’s risk management framework and risk appetite framework, and together with
CIBC’s portfolio concentration limits for credit exposures, CIBC’s common risk/concentration risk limits for credit exposures, and other
supporting credit risk policies, standards and procedures, assists CIBC in achieving its desired risk profile by providing an effective foundation
for the management of credit risk.
Credit risk limits
The RMC approves Board limits, and exposures above Board limits require reporting to, or approval of, the RMC. Management limits are
approved by the CRO. Usage is monitored to ensure risks are within allocated management and Board limits. Exposures above management
limits require the approval of the CRO. Business lines may also impose lower limits to reflect the nature of their exposures and target markets.
This tiering of limits provides for an appropriate hierarchy of decision making and reporting between management and the RMC. Credit approval
authority flows from the Board and is further cascaded to officers in writing. The Board’s Investment and Lending Authority Resolution sets
thresholds above which credit exposures require reporting to, or approval of, the RMC, ensuring an increasing level of oversight for credit
exposures of higher risk. CIBC maintains country limits to control exposures within countries outside of Canada and the U.S.
Credit concentration limits
At a bank-wide level, credit exposures are managed to promote alignment to our risk appetite statement, to maintain the target business mix and
to ensure that there is no undue concentration of risk. We set limits to control borrower concentrations by risk-rating band for large exposures
(i.e., risk-rated credits). Direct loan sales, credit derivative hedges, or structured transactions may also be used to reduce concentrations. We
also have a set of portfolio concentration limits in place to control exposures by country, industry, product and activity. Further, our policies
require limits to be established as appropriate for new initiatives and implementation of strategies involving material levels of credit risk.
Concentration limits represent the maximum exposure levels we wish to hold on our books. In the normal course, it is expected that exposures
will be held at levels below the maximums. The credit concentration limits are reviewed and approved by the RMC at least annually.
CIBC 2022 ANNUAL REPORT 59

Management’s discussion and analysis
Credit concentration limits are also applied to our retail lending portfolios to mitigate concentration risk. We not only have concentration
limits applied to individual borrowers and geographic regions, but also to different types of credit facilities, such as unsecured credits. In
addition, we limit the maximum insured mortgage exposure to private insurers in order to reduce counterparty risk.
Credit risk mitigation
We may mitigate credit risk by obtaining a pledge of collateral, which improves recoveries in the event of a default. Our credit risk management
policies include verification of the collateral and its value and ensuring that we have legal certainty with respect to the assets pledged.
Valuations are updated periodically depending on the nature of the collateral, legal environment, and the creditworthiness of the counterparty.
The main types of collateral include: (i) cash or marketable securities for securities lending and repurchase transactions; (ii) cash or marketable
securities taken as collateral in support of our OTC derivatives activity; (iii) charges over operating assets such as inventory, receivables and
real estate properties for lending to small business and commercial borrowers; and (iv) mortgages over residential properties for retail lending.
In certain circumstances we may use third-party guarantees to mitigate risk. We also obtain insurance to reduce the risk in our real estate
secured lending portfolios, the most material of which relates to the portion of our residential mortgage portfolio that is insured by CMHC, an
agency of the Government of Canada.
We mitigate the trading credit risk of OTC derivatives, securities lending and repurchase transactions with counterparties by employing the
International Swaps and Derivatives Association (ISDA) Master Agreement, as well as Credit Support Annexes (CSAs) or similar master and
collateral agreements. See Note 12 to the consolidated financial statements for additional details on the risks related to the use of derivatives
and how we manage these risks.
ISDA Master Agreements and similar master and collateral agreements, such as the Global Master Repurchase Agreement and Global
Master Securities Lending Agreement, facilitate cross transaction payments, prescribe close-out netting processes, and define the
counterparties’ contractual trading relationship. In addition, the agreements formalize non-transaction-specific terms. Master agreements serve
to mitigate our credit risk by outlining default and termination events, which enable parties to close out of all outstanding transactions in the case
of a negative credit event on either party’s side. The mechanism for calculating termination costs in the event of a close-out are outlined in the
master agreement; this allows for the efficient calculation of a single net obligation of one party to another.
CSAs and other collateral agreements are often included in ISDA Master Agreements or similar master agreements governing securities
lending and repurchase transactions. They mitigate CCR by providing for the exchange of collateral between parties when a party’s exposure to
the other exceeds agreed upon thresholds, subject to a minimum transfer amount. CSAs and other collateral agreements that operate with
master agreements also designate acceptable collateral types, and set out rules for re-hypothecation and interest calculation on collateral.
Collateral types permitted under CSAs and other master agreements are set through our trading credit risk management documentation
procedures. These procedures include requirements around collateral type concentrations.
Consistent with global initiatives to improve resilience in the financial system, we clear derivatives through central counterparties (CCPs)
where feasible. Credit derivatives may be used to reduce industry sector concentrations and single-name exposure.
Forbearance techniques
We employ forbearance techniques to manage client relationships and to minimize credit losses due to default, foreclosure or repossession. In
certain circumstances, it may be necessary to modify a loan for reasons related to a borrower’s financial difficulties, reducing the potential of default.
Total debt restructurings are subject to our normal quarterly impairment review which considers, amongst other factors, covenants and/or payment
delinquencies. Loan loss provisions are adjusted as appropriate.
In retail lending, forbearance techniques include interest capitalization, amortization amendments and debt consolidations. We have a set of
eligibility criteria that allow our Client Account Management team to determine suitable remediation strategies and propose products based on each
borrower’s situation.
The solutions available to corporate and commercial clients vary based on the individual nature of the client’s situation and are undertaken
selectively where it has been determined that the client has or is likely to have repayment difficulties servicing its obligations. Covenants often reveal
changes in the client’s financial situation before there is a change in payment behaviour and typically allow for a right to reprice or accelerate
payments. Solutions may be temporary in nature or may involve other special management options.
Process and control
The credit approval process is centrally controlled, with all significant credit requests submitted to a credit adjudication group within Risk
Management that is independent of the originating businesses. Approval authorities are a function of the risk and amount of credit requested. In
certain cases, credit requests must be escalated to senior management, the CRO, or to the RMC for approval.
After initial approval, individual credit exposures continue to be monitored. A formal risk assessment is completed at least annually for all
risk-rated accounts, including review of assigned ratings. Higher risk-rated accounts are subject to closer monitoring and are reviewed at least
quarterly. Collections and specialized loan workout groups handle the day-to-day management of high-risk loans to maximize recoveries.
Risk measurement
Exposures subject to AIRB approach
Under the AIRB approach we are required to categorize exposures to credit risk into broad classes of assets with different underlying risk
characteristics. This asset categorization may differ from the presentation in our consolidated financial statements. Under the AIRB approach,
credit risk is measured using the following three key risk parameters
(1)
:
• PD – the probability that the obligor will default within the next 12 months.
• EAD – the estimate of the amount that will be drawn at the time of default.
• LGD – the expected severity
of loss as the result of the default, expressed as a percentage of the EAD.
Our credit risk exposures are divided into business and government and retail portfolios. Regulatory models used to measure
credit risk
exposure under the AIRB approach are subject to CIBC’s model risk management process.
(1) These parameters differ from those used in the calculation of ECL under IFRS 9. See the “Accounting and control matters” section for further details.
60 CIBC 2022 ANNUAL REPORT

Management’s discussion and analysis
Business and government portfolios (excluding scored small business) – risk-rating method
The portfolios comprise exposures to corporate, sovereign, and bank obligors. Our adjudication process and criteria includes assigning an obligor
rating that reflects our estimate of the financial strength of the borrower, and a facility rating or LGD rating that reflects the collateral amount and
quality applicable to secured exposures, the seniority position of the claim, and the capital structure of the borrower for unsecured exposures.
The obligor rating takes into consideration our financial assessment of the obligor, the industry, and the economic environment of the region
in which the obligor operates. Where a guarantee from a third-party exists, both the obligor and the guarantor will be assessed. While our obligor
rating is determined independently of external ratings for the obligor, our risk-rating methodology includes a review of those external ratings.
CIBC employs a 20-point master internal obligor default rating scale that broadly maps to external agencies’ ratings as presented in the
table below.
Grade
CIBC
rating
S&P
equivalent
Moody’s
equivalent
Investment grade 00–47 AAA to BBB- Aaa to Baa3
Non-investment grade 51–67 BB+ to B- Ba1 to B3
Watch list 70–80 CCC+ to C Caa1 to Ca
Default 90 D C
We use quantitative modelling techniques to assist in the development of internal risk-rating systems. The risk-rating systems have been
developed through analysis of internal and external credit risk data, supplemented with expert judgment. The risk ratings are used for portfolio
management, risk limit setting, product pricing, and in the determination of regulatory and economic capital.
Our credit process is designed to ensure that we approve applications and extend credit only where we believe that our client has the
ability to repay according to the agreed terms and conditions.
Our credit framework of policies and limits defines our appetite for exposure to any single name or group of related borrowers, which is a
function of the internal risk rating. We generally extend new credit only to borrowers in the investment and non-investment grade categories
noted above. Our credit policies are also defined to manage our exposure to concentration in borrowers in any particular industry or region.
In accordance with our process, each obligor is assigned an obligor default rating and the assigned rating is mapped to a PD estimate that
represents a long-run average one-year default likelihood. For corporate obligors, PD estimates are calculated using joint maximum likelihood
techniques based on our internal default rate history by rating category and longer dated external default rates as a proxy for the credit cycle to
arrive at long-run average PD estimates. Estimates drawn from third-party statistical default prediction models are used to supplement the
internal default data for some rating bands where internal data is sparse. For small and medium corporate enterprises, PD estimates are
developed using only internal default history. For bank and sovereign obligors, PD estimates are derived from an analysis based on external
default data sets and supplemented with internal data where possible. We examine several different estimation methodologies and compare
results across the different techniques. In addition, we apply the same techniques and estimation methodologies to analogous corporate default
data and compare the results for banks and sovereigns to the corporate estimates for each technique. A regulatory floor is applied to PD
estimates for corporate and bank obligors.
Each facility is assigned an LGD rating and each assigned rating is mapped to an LGD estimate that considers economic downturn
conditions. For corporate obligors, LGD estimates are primarily derived from internal historical recovery data. Time to resolution is typically one
to two years for most corporate obligors, and one to four years in the real estate sector. LGD values are based on discounted post-default cash
flows for resolved accounts and include material direct and indirect costs associated with collections. External data is used in some cases to
supplement our analysis. Economic downturn periods are identified for each portfolio by examining the history of actual losses, default rates and
LGD. For bank and sovereign exposures, LGD estimates are primarily driven by expert judgment supplemented with external data and
benchmarks where available. Appropriate adjustments are made to LGD estimates to account for various uncertainties associated with
estimation techniques and data limitations, including adjustments for unresolved accounts.
EAD is estimated based on the current exposure to the obligor together with possible future changes in that exposure driven by factors
such as the available undrawn credit commitment amount and the obligor default rating. EAD estimates are primarily based on internal historical
loss data supplemented with comparable external data. Economic downturn periods are identified for each portfolio by examining the historical
default rates and actual EAD factors.
Appropriate adjustments are made to PD, LGD and EAD estimates to account for various uncertainties associated with estimation
techniques and data limitations, including adjustments for unresolved accounts (for LGD).
A simplified risk-rating process (slotting approach) is used for part of our uninsured Canadian commercial mortgage portfolio, which
comprises non-residential mortgages and multi-family residential mortgages. These exposures are individually rated on our rating scale using a
risk-rating methodology that considers the property’s key attributes, which include its loan-to-value (LTV) and debt service ratios, the quality of
the property, and the financial strength of the owner/sponsor. All exposures are secured by a lien over the property. In addition, we have insured
multi-family residential mortgages, which are not treated under the slotting approach, but are instead treated as sovereign exposures.
Retail portfolios
Retail portfolios are characterized by a large number of relatively small exposures. They comprise: real estate secured personal lending
(residential mortgages and personal loans and lines secured by residential property); qualifying revolving retail exposures (credit cards,
overdrafts and unsecured lines of credit); and other retail exposures (loans secured by non-residential assets, unsecured loans including
student loans, and scored small business loans).
We use scoring models in the adjudication of new retail credit exposures, which are based on statistical methods of analyzing the unique
characteristics of the borrower, to estimate future behaviour. In developing our models, we use internal historical information from previous
borrowers, as well as information from external sources, such as credit bureaus. The use of credit scoring models allows for consistent
assessment across borrowers. There are specific guidelines in place for each product, and our adjudication decision will take into account the
characteristics of the borrower, any guarantors, and the quality and sufficiency of the collateral pledged (if any). The lending process will include
documentation of, where appropriate, satisfactory identification, proof of income, independent appraisal of the collateral and registration of
security.
Retail portfolios are managed as pools of homogeneous risk exposures, using external credit bureau scores and/or other behavioural
assessments to group exposures according to similar credit risk profiles. These pools are established through statistical techniques.
Characteristics used to group individual exposures vary by asset category; as a result, the number of pools, their size, and the statistical
techniques applied to their management differ accordingly.
CIBC 2022 ANNUAL REPORT 61

Management’s discussion and analysis
The following table maps the PD bands to various risk levels:
Risk level PD bands
Exceptionally low 0.01%–0.20%
Very low 0.21%–0.50%
Low 0.51%–2.00%
Medium 2.01%–10.00%
High 10.01%–99.99%
Default 100%
For the purposes of the AIRB approach for retail portfolios, additional PD, LGD and EAD segmentation into homogeneous risk exposures is
established through statistical techniques. The principal statistical estimation technique is decision trees benchmarked against alternative
techniques such as regression and random forests.
Within real estate secured lending, we have two key parameter estimation models: mortgages and real estate secured personal lines of
credit. Within qualifying revolving retail, we have three key parameter estimation models: credit cards, overdraft, and unsecured personal lines.
A small percentage of credit cards, overdraft, and unsecured line accounts that do not satisfy the requirements for qualifying revolving retail are
grouped into other retail parameter models. Within other retail, we have three key parameter models: margin lending, personal loans, and scored
small business loans. Each parameter model pools accounts according to characteristics such as: delinquency, current credit bureau score,
internal behaviour score, estimated current LTV ratio, account type, account age, utilization, outstanding balance, or authorized limit.
PD is estimated as the average default rate over an extended period based on internal historical data, generally for a 5-to-10-year period,
which is adjusted using internal historical data on default rates over a longer period or comparable external data that includes a period of stress.
A regulatory floor is applied to our PD estimate for all retail exposures with the exception of insured mortgages and government-guaranteed
loans.
LGD is estimated based on observed recovery rates over an extended period using internal historical data. In determining our LGD
estimate, we exclude any accounts that have not had enough time since default for the substantial majority of expected recovery to occur. This
recovery period is product-specific and is typically in the range of 1 to 3 years. Accounts that cure from default and return to good standing are
considered to have zero loss. We simulate the loss rate in a significant downturn based on the relationship(s) between LGD and one or more of
the following: PD; housing prices, cure rate, and recovery time; or observed LGD in periods with above-average loss rates. We apply
appropriate adjustments to address various types of estimation uncertainty including sampling error and trending. A regulatory floor is applied to
all real estate secured exposures with the exception of insured mortgages.
EAD for revolving products is estimated as a percentage of the authorized credit limit based on the observed EAD rates over an extended
period using historical data. We simulate the EAD rate in a significant downturn based on the relationship(s) between the EAD rate and PD and/
or the observed EAD rate in periods with above-average EAD rates. For term loan products, EAD is set equal to the outstanding balance.
We apply appropriate adjustments to PD, LGD and EAD to address various types of estimation uncertainty including sampling error and
trending.
Back-testing
We monitor the three key risk parameters – PD, EAD and LGD – on a quarterly basis for our business and government portfolios and on a
monthly basis for our retail portfolios. Every quarter, the back-testing results are reported to OSFI and are presented to the business and Risk
Management senior management for review and challenge. For each parameter, we identify any portfolios whose realized values are
significantly above or significantly below expectations and then test to see if this deviation is explainable by changes in the economy. If the
results indicate that a parameter model may be losing its predictive power, we prioritize that model for review and update.
Stress testing
As part of our regular credit portfolio management process, we conduct stress testing and scenario analyses on our portfolio to quantitatively
assess the impact of various historical, as well as hypothetical, stressed conditions, versus limits determined in accordance with our risk
appetite. Scenarios are selected to test our exposures to specific industries (e.g., oil and gas and real estate), products (e.g., mortgages and
cards), or geographic regions (e.g., Europe and the Caribbean). Results from stress testing are a key input into management decision making,
including the determination of limits and strategies for managing our credit exposure. See the “Real estate secured personal lending” section for
further discussion on our residential mortgage portfolio stress testing.
62 CIBC 2022 ANNUAL REPORT

Management’s discussion and analysis
Exposure to credit risk
The portfolios are categorized based upon how we manage the business and the associated risks. Gross credit exposure amounts presented in
the table below represent our estimate of EAD, which is net of derivative master netting agreements and CVA but is before allowance for credit
losses or credit risk mitigation. Gross credit exposure amounts relating to our business and government portfolios are reduced for collateral held
for repo-style transactions, which reflects the EAD value of such collateral. Non-trading equity exposures are not included in the table below as
they have been deemed immaterial under the OSFI guidelines, and hence are subject to 100% risk-weighting.
$ millions, as at October 31 2022 2021
AIRB
approach
Standardized
approach Total
AIRB
approach
(1)
Standardized
approach Total
Business and government portfolios
Corporate
Drawn $ 151,361 $ 45,924 $ 197,285 $ 120,417 $ 36,321 $ 156,738
Undrawn commitments 64,470 10,142 74,612 61,417 7,583 69,000
Repo-style transactions 185,680 – 185,680 172,827 – 172,827
Other off-balance sheet 14,181 831 15,012 13,644 981 14,625
OTC derivatives 13,094 98 13,192 12,914 415 13,329
428,786 56,995 485,781 381,219 45,300 426,519
Sovereign
Drawn 149,200 28,680 177,880 125,001 26,272 151,273
Undrawn commitments 8,560 – 8,560 8,525 – 8,525
Repo-style transactions 24,228 – 24,228 26,746 – 26,746
Other off-balance sheet 2,421 – 2,421 1,613 – 1,613
OTC derivatives 2,475 – 2,475 2,011 1 2,012
186,884 28,680 215,564 163,896 26,273 190,169
Banks
Drawn 14,151 1,548 15,699 12,291 1,565 13,856
Undrawn commitments 1,297 18 1,315 1,554 3 1,557
Repo-style transactions 46,155 – 46,155 42,529 – 42,529
Other off-balance sheet 74,748 – 74,748 64,728 – 64,728
OTC derivatives 6,287 12 6,299 5,765 12 5,777
142,638 1,578 144,216 126,867 1,580 128,447
Gross business and government portfolios 758,308 87,253 845,561 671,982 73,153 745,135
Less: collateral held for repo-style transactions 237,484 – 237,484 225,399 – 225,399
Net business and government portfolios 520,824 87,253 608,077 446,583 73,153 519,736
Retail portfolios
Real estate secured personal lending
Drawn 281,518 5,491 287,009 261,531 4,835 266,366
Undrawn commitments 38,038 – 38,038 36,631 – 36,631
319,556 5,491 325,047 298,162 4,835 302,997
Qualifying revolving retail
Drawn 18,034 n/a 18,034 18,181 n/a 18,181
Undrawn commitments 58,471 n/a 58,471 54,509 n/a 54,509
Other off-balance sheet 375 n/a 375 327 n/a 327
76,880 n/a 76,880 73,017 n/a 73,017
Other retail
Drawn 17,519 5,099 22,618 15,578 1,419 16,997
Undrawn commitments 3,308 28 3,336 2,937 26 2,963
Other off-balance sheet 45 121 166 40 – 40
20,872 5,248 26,120 18,555 1,445 20,000
Total retail portfolios 417,308 10,739 428,047 389,734 6,280 396,014
Securitization exposures 15,333 3,257 18,590 10,823 4,556 15,379
Gross credit exposure 1,190,949 101,249 1,292,198 1,072,539 83,989 1,156,528
Less: collateral held for repo-style transactions 237,484 – 237,484 225,399 – 225,399
Net credit exposure
(2)
$ 953,465 $ 101,249 $ 1,054,714 $ 847,140 $ 83,989 $ 931,129
(1) Includes exposures subject to the supervisory slotting approach.
(2) Excludes exposures arising from derivative and repo-style transactions that are cleared through QCCPs as well as credit risk exposures arising from other assets that
are subject to the credit risk framework but are not included in the standardized or IRB frameworks, including other balance sheet assets that are risk-weighted at
100%, significant investments in the capital of non-financial institutions that are risk-weighted at 1,250%, settlement risk, and amounts below the thresholds for
deduction that are risk-weighted at 250%.
n/a Not applicable.
Net credit exposure increased by $123.6 billion in 2022, due to business growth in our North American lending portfolios.
CIBC 2022 ANNUAL REPORT 63

Management’s discussion and analysis
Exposures subject to the standardized approach
(1)
Exposures within CIBC Bank USA, CIBC FirstCaribbean and certain exposures to individuals for non-business purposes do not have sufficient
historical data to support the AIRB approach for credit risk, and are subject to the standardized approach. The standardized approach utilizes a
set of risk weightings defined by the regulators, as opposed to the more data intensive AIRB approach. A detailed breakdown of our
standardized credit risk exposures by risk-weight category, before considering the effect of credit risk mitigation strategies and before
allowance for credit losses, is provided below.
$ millions, as at October 31 Risk-weight category 2022 2021
0% 20% 35% 50% 75% 100% 150% Total Total
Corporate $ – $ – $ – $ – $ – $ 56,863 $ 132 $ 56,995 $ 45,300
Sovereign 24,809 2,971 – 102 – 794 4 28,680 26,273
Banks – 1,359 – 85 – 134 – 1,578 1,580
Real estate secured personal lending – – 3,980 – 1,269 233 9 5,491 4,835
Other retail – – – – 5,130 80 38 5,248 1,445
$ 24,809 $ 4,330 $ 3,980 $ 187 $ 6,399 $ 58,104 $ 183 $ 97,992 $ 79,433
(1) See “Securitization exposures” section for securitization exposures that are subject to the standardized approach.
We use credit ratings from S&P and Moody’s to calculate credit risk RWA for certain exposures under the standardized approach, including
securities issued by sovereigns and their central banks (sovereigns), banks and corporates, and deposits with sovereigns and banks. This includes
S&P and Moody’s issuer-specific credit ratings for securities issued by sovereigns and corporates, the S&P country credit rating for the country of
incorporation for securities issued by banks, and deposits with banks, and the S&P country credit rating for deposits with central banks. The RWA
calculated using credit ratings from these agencies represents 0.8% of credit risk RWA under the standardized approach.
Trading credit exposures
We have trading credit exposure (also called counterparty credit exposure) that arises from our OTC derivatives and our repo-style transactions.
The nature of our derivatives exposure and how it is mitigated is further explained in Note 12 to the consolidated financial statements. Our repo-
style transactions consist of our securities bought or sold under repurchase agreements, and our securities borrowing and lending activity.
The PD of our counterparties is estimated using models consistent with the models used for our direct lending activity. Due to the
fluctuations in the market values of interest rates, exchange rates, and equity and commodity prices, counterparty
credit exposure cannot be
quantified with certainty at the inception of the trade. Counterparty credit exposure is estimated using the current fair value of the exposure, plus
an estimate of the maximum potential future exposure due to changes in the fair value. Credit risk associated with these counterparties is
managed within the same process as our lending business, and for the purposes of credit adjudication, the exposure is aggregated with any
exposure arising from our lending business. The majority of our counterparty credit exposure benefits from the credit risk mitigation techniques
discussed above, including daily re-margining, and posting of collateral.
We are also exposed to wrong-way risk. Specific wrong-way risk arises when CIBC receives financial collateral issued (or an underlying
reference obligation of a transaction is issued)
by the counterparty itself, or by a related entity that would be considered to be part of the same
common risk group. General wrong-way risk arises when the exposure and/or collateral pledged to CIBC is highly correlated to that of the
counterparty. Exposure to wrong-way risk with derivative counterparties is monitored by Capital Markets Risk Management. Where we may be
exposed to wrong-way risk, our adjudication procedures subject those transactions to a more rigorous approval process. The exposure may be
hedged with other derivatives to further mitigate the risk that can arise from these transactions.
We establish a CVA for expected future credit losses from each of our derivative counterparties. The expected future credit loss is a
function of our estimates of the PD, the estimated loss in the event of default, and other factors such as risk mitigants.
Rating profile of OTC derivative mark-to-market (MTM) receivables
$ billions, as at October 31 2022 2021
Exposure
(1)
Investment grade $ 11.18 79.1 % $ 9.87 68.9 %
Non-investment grade 2.87 20.3 4.39 30.6
Watch list 0.09 0.6 0.07 0.5
Default – – – –
Unrated
– – – –
$ 14.14 100.0 % $ 14.33 100.0 %
(1) MTM of the OTC derivative contracts is after the impact of master netting agreements, but before any collateral.
Concentration of exposures
Concentration of credit risk exists when a number of obligors are engaged in similar activities, or operate in the same geographic areas or
industry sectors, and have similar economic characteristics so that their ability to meet contractual obligations is similarly affected by changes in
economic, political, or other conditions.
64 CIBC 2022 ANNUAL REPORT

Management’s discussion and analysis
Geographic distribution
(1)
The following table provides a geographic distribution of our business and government exposures under the AIRB approach, net of collateral
held for repo-style transactions.
$ millions, as at October 31, 2022 Canada U.S. Europe Other Total
Drawn $ 195,500 $ 89,657 $ 13,330 $ 16,225 $ 314,712
Undrawn commitments 51,733 16,322 3,693 2,579 74,327
Repo-style transactions 8,629 5,430 1,857 2,663 18,579
Other off-balance sheet 74,955 7,646 8,190 559 91,350
OTC derivatives 11,100 6,547 2,157 2,052 21,856
$ 341,917 $ 125,602 $ 29,227 $ 24,078 $ 520,824
October 31, 2021 $ 301,992 $ 95,561 $ 28,504 $ 20,526 $ 446,583
(1) Classification by country is primarily based on domicile of debtor or customer.
Business and government exposure by industry groups
The following table provides an industry-wide breakdown of our business and government exposures under the AIRB approach, net of collateral
held for repo-style transactions.
$ millions, as at October 31 Drawn
Undrawn
commitments
Repo-style
transactions
Other off-
balance sheet
OTC
derivatives
2022
Total
2021
Total
Commercial mortgages $ 9,098 $ 10 $ – $
– $ – $ 9,108 $ 9,665
Financial institutions 93,137 13,940 17,504 79,477 10,991 215,049 187,163
Retail and wholesale 9,966 4,191 – 391 308 14,856 12,120
Business services 9,675 3,054 8 634 330 13,701 11,253
Manufacturing – capital goods 3,961 2,357 – 275 313 6,906 5,577
Manufacturing – consumer goods 5,131 2,163 – 254 134 7,682 6,270
Real estate and construction 39,584 10,477 – 1,661 178 51,900 45,470
Agriculture 7,860 2,268 – 34 90 10,252 9,306
Oil and gas 3,642 5,491 – 646 5,429 15,208 15,931
Mining 1,956 3,700 – 755 211 6,622 4,903
Forest products 464 612 – 217 60 1,353 1,220
Hardware and software 3,348 1,544 – 56 48 4,996 3,422
Telecommunications and cable 1,508 1,935 – 365 308 4,116 3,440
Broadcasting, publishing and printing 460 118 – 7 8 593 614
Transportation 5,873 3,647 – 269 604 10,393 10,889
Utilities 15,567 11,365 – 4,559 557 32,048 28,209
Education, health, and social services 3,691 1,621 2 191 104 5,609 5,530
Governments 99,791 5,834 1,065 1,559 2,183 110,432 85,601
$ 314,712 $ 74,327 $ 18,579 $ 91,350 $ 21,856 $ 520,824 $ 446,583
As part of our risk mitigation strategy, we may use credit protection purchases as a hedge against customer or industry sector concentration. As at
October 31, 2022, we had no credit protection purchased (2021: $124 million) related to our business and government loans.
Credit quality of portfolios
Credit quality of the retail portfolios
The following table presents the credit quality of our retail portfolios under the AIRB approach.
$ millions, as at October 31 2022 2021
EAD
Risk level
Real estate secured
personal lending
Qualifying
revolving retail
Other
retail Total Total
Exceptionally low $ 243,056 $ 47,835 $ 3,183 $ 294,074 $ 282,648
Very low 40,396 9,035 6,282 55,713 48,481
Low 31,437 13,122 7,503 52,062 44,718
Medium 3,804 5,839 2,600 12,243 11,551
High 587 1,002 1,203 2,792 1,953
Default 276 47 101 424 383
$ 319,556 $ 76,880 $ 20,872 $ 417,308 $ 389,734
Securitization exposures
The following table provides details on securitization exposures in our banking book, by credit rating.
$ millions, as at October 31 2022 2021
EAD
Exposures under the AIRB approach
S&P rating equivalent
AAA to BBB- $ 15,333 $ 10,823
BB+ to BB- – –
Below BB- – –
Unrated – –
15,333 10,823
Exposures under the standardized approach 3,257 4,556
Total securitization exposures $ 18,590 $ 15,379
CIBC 2022 ANNUAL REPORT 65

Management’s discussion and analysis
Government lending programs in response to COVID-19
In 2020, the Government of Canada launched a number of lending programs to provide credit and financing to businesses during the COVID-19
pandemic. CIBC participated in a number of those programs, including the Canada Emergency Business Account (CEBA) program with the Export
Development Canada (EDC). Loans advanced under the CEBA program are not recognized on our consolidated balance sheet because they are
funded by EDC and all of the resulting cash flows and associated risks and rewards, including any exposure to payment defaults and principal
forgiveness, are assumed by EDC. As at October 31, 2022, loans of $4.1 billion (2021: $4.5 billion), net of repayments, have been provided to our
clients under the CEBA. Funded loans outstanding on our consolidated balance sheet under other Canadian lending programs for businesses that
commenced during the pandemic were $0.4 billion (2021: $0.3 billion).
The Paycheck Protection Program (PPP), introduced by the U.S. Small Business Administration (SBA), was a forgivable loan program that
ended on May 31, 2021. PPP loans
are guaranteed by the U.S. SBA. Loans advanced under the PPP are recognized on our consolidated balance
sheet as business and government loans with the SBA’s guarantee reflected in our estimate of the ECL associated with these loans. Loans
outstanding under the PPP in the U.S. were US$54 million (2021: US$0.5 billion).
Real estate secured personal lending
Real estate secured personal lending comprises residential mortgages, and personal loans and lines secured by residential property (HELOC). This
portfolio is lower risk compared with other retail portfolios, as we have a first charge on the majority of the properties and a second lien on only a
small portion of the portfolio. We use the same lending criteria in the adjudication of both first lien and second lien loans.
Under the Bank Act (Canada), banks are limited to providing residential real estate loans of no more than 80% of the collateral value. An
exception is made for mortgage loans with a higher LTV ratio if they are insured
by either CMHC or a private mortgage insurer. Mortgage insurance
protects banks from the risk of default by the borrower, over the term of the coverage. Mortgage insurers are subject to regulatory capital
requirements, which aim to ensure that they are well capitalized. If a private mortgage insurer becomes insolvent, the Government of Canada has,
provided certain conditions are met, obligations in respect of policies underwritten by certain insolvent private mortgage insurers as more fully
described in the Protection of Residential Mortgage or Hypothecary Insurance Act (PRMHIA). There is a possibility that losses could be incurred in
respect of insured mortgages if, among other things, CMHC or the applicable private mortgage insurer denies a claim, or further, if a private
mortgage insurer becomes insolvent and either the conditions under the PRMHIA are not met or the Government of Canada denies the claim.
The following disclosures are required by OSFI pursuant to the Guideline B-20 “Residential Mortgage Underwriting Practices and Procedures”
(Guideline B-20).
The following table provides details on our residential mortgage and HELOC portfolios:
$ billions, as at October 31, 2022
Residential mortgages
(1)
HELOC
(2)
Total
Insured Uninsured Uninsured Insured Uninsured
Ontario
(3)
$ 21.8 15 % $ 123.4 85 % $ 10.9 100 % $ 21.8 14 % $ 134.3 86 %
British Columbia and territories
(4)
7.3 14 44.8 86 4.0 100 7.3 13 48.8 87
Alberta 12.0 45 14.9 55 2.0 100 12.0 42 16.9 58
Quebec 5.2 25 15.9 75 1.2 100 5.2 23 17.1 77
Central prairie provinces 3.1 42 4.3 58 0.6 100 3.1 39 4.9 61
Atlantic provinces 3.2 36 5.8 64 0.7 100 3.2 33 6.5 67
Canadian portfolio
(5)(6)
52.6 20 209.1 80 19.4 100 52.6 19 228.5 81
U.S. portfolio
(5)
– – 2.4 100 – – – – 2.4 100
Other international portfolio
(5)
– – 2.7 100 – – – – 2.7 100
Total portfolio $ 52.6 20 % $ 214.2 80 % $ 19.4 100 % $ 52.6 18 % $ 233.6 82 %
October 31, 2021 $ 59.6 24 % $ 187.9 76 % $ 18.8 100 % $ 59.6 22 % $ 206.7 78 %
(1) Balances reflect principal values.
(2) We did not have any insured HELOCs as at October 31, 2022 and 2021.
(3) Includes $9.9 billion (2021: $11.7 billion) of insured residential mortgages, $77.0 billion (2021: $67.7 billion) of uninsured residential mortgages, and $6.3 billion
(2021: $6.0 billion) of HELOCs in the Greater Toronto Area (GTA).
(4) Includes $3.2 billion (2021: $3.8 billion) of insured residential mortgages, $30.6 billion (2021: $27.9 billion) of uninsured residential mortgages, and $2.5 billion
(2021: $2.4 billion) of HELOCs in the Greater Vancouver Area (GVA).
(5) Geographic location is based on the address of the property.
(6) 61% (2021: 64%) of insurance on Canadian residential mortgages is provided by CMHC and the remaining by two private Canadian insurers, both rated at least AA (low)
by DBRS.
The average LTV ratios
(1)
for our uninsured residential mortgages and HELOCs originated and acquired during the year are provided in the following
table:
For the year ended October 31 2022 2021
Residential
mortgages HELOC
Residential
mortgages HELOC
Ontario
(2)
65 % 65 % 64 % 68 %
British Columbia and territories
(3)
62 64 61 65
Alberta 72 72 69 73
Quebec 69 71 68 73
Central prairie provinces 71 73 69 74
Atlantic provinces 70 70 69 73
Canadian portfolio
(4)
65 66 64 68
U.S. portfolio
(4)
64 61 63 65
Other international portfolio
(4)
73 % n/m 75 % n/m
(1) LTV ratios for newly originated and acquired residential mortgages and HELOCs are calculated based on weighted average.
(2) Average LTV ratios for our uninsured GTA residential mortgages originated during the year were 65% (2021: 64%).
(3) Average LTV ratios for our uninsured GVA residential mortgages originated during the year were 62% (2021: 61%).
(4) Geographic location is based on the address of the property.
n/m Not meaningful.
66 CIBC 2022 ANNUAL REPORT

Management’s discussion and analysis
The following table provides the average LTV ratios on our total Canadian residential mortgage portfolio:
Insured Uninsured
October 31, 2022
(1)(2)
50 % 48 %
October 31, 2021
(1)(2)
51 % 49 %
(1) LTV ratios for residential mortgages are calculated based on weighted average. The house price estimates for October 31, 2022 and 2021 are based on the Forward
Sortation Area (FSA) level indices from the Teranet – National Bank National Composite House Price Index (Teranet) as of September 30, 2022 and 2021, respectively.
Teranet is an independent estimate of the rate of change in Canadian home prices.
(2) Average LTV ratio on our uninsured GTA residential mortgage portfolio was 48% (2021: 47%). Average LTV ratio on our uninsured GVA residential mortgage portfolio was
44% (2021: 45%).
The tables below summarize the remaining amortization profile of our total Canadian, U.S. and other international residential mortgages. The first
table provides the remaining amortization periods based on the minimum contractual payment amounts with the assumption that variable rate
mortgages renew at payment amounts that maintain the original amortization schedule. The second table summarizes the remaining amortization
profile of our total Canadian, U.S. and other international residential mortgages based upon current customer payment amounts.
Contractual payment basis
0–5 years
>5–10
years
>10–15
years
>15–20
years
>20–25
years
>25–30
years
>30–35
years >35 years
Canadian portfolio
October 31, 2022 – % 1 % 1 % 10 % 54 % 34 % – % – %
October 31, 2021 – % 1 % 1 % 8 % 57 % 33 % – % – %
U.S. portfolio
October 31, 2022 – % 1 % – % 2 % 9 % 88 % – % – %
October 31, 2021 – % 1 % – % 1 % 10 % 88 % – % – %
Other international portfolio
October 31, 2022 7 % 12 % 21 % 23 % 20 % 15 % 1 % 1 %
October 31, 2021 8 % 15 % 21 % 23 % 19 % 13 % 1 % – %
Current customer payment basis
0–5 years
>5–10
years
>10–15
years
>15–20
years
>20–25
years
>25–30
years
>30–35
years >35 years
(1)
Canadian portfolio
October 31, 2022 1 % 3 % 5 % 13 % 31 % 17 % 4 % 26 %
October 31, 2021 1 % 3 % 7 % 17 % 45 % 27 % – % – %
U.S. portfolio
October 31, 2022 1 % 2 % 6 % 9 % 10 % 72 % – % – %
October 31, 2021 1 % 3 % 6 % 9 % 10 % 71 % – % – %
Other international portfolio
October 31, 2022 7 % 12 % 21 % 23 % 20 % 15 % 1 % 1 %
October 31, 2021 7 % 12 % 21 % 24 % 19 % 15 % 1 % – %
(1) Includes variable rate mortgages of $68 billion, of which $39 billion relates to mortgages in which all of the fixed contractual payments are currently being applied to
interest based on the rates in effect at October 31, 2022 and the terms of the mortgages, with the portion of the contractual interest requirement not met by the payments
being added to the principal. Since the amortization profile reflected in this table is based on the current amount of existing contractual payments, it does not reflect that
the contractual payment amount is required to be increased at the time of renewal by the amount necessary to reduce the amortization period down to the period in effect
at the time the mortgage was originally provided.
The increase in the duration of the amortization profile is driven by the prime rate increases that commenced earlier in 2022, impacting clients with a
variable rate mortgage. The increase in interest rates had no impact on the remaining amortization period for fixed rate mortgages which in the
current interest rate environment are assumed to be renewed at the same or a shorter amortization period.
We have two types of condominium exposures in Canada: mortgages and developer loans. Both are primarily concentrated in the Toronto and
Vancouver areas. As at October 31, 2022, our Canadian condominium mortgages were $38.7 billion (2021: $34.7 billion), of which 20% (2021: 24%)
were insured. Our drawn developer loans were $1.7 billion (2021: $1.1 billion), or 0.8% (2021: 0.7%) of our business and government portfolio, and
our related undrawn exposure was $5.9 billion (2021: $4.9 billion). The condominium developer exposure is diversified across 112 projects.
We stress test our mortgage and HELOC portfolios to determine the potential impact of different economic events. Our stress tests can use variables
such as unemployment rates, debt service ratios and housing price changes, to model potential outcomes for a given set of circumstances. The
stress testing involves variables that could behave differently in certain situations. Our main tests use economic variables in a similar range or more
conservative to historical events when Canada experienced economic downturns, and also incorporate the impact of the COVID-19 pandemic. Our
results show that in an economic downturn, our capital position should be sufficient to absorb mortgage and HELOC losses.
On December 17, 2021, OSFI and the Department of Finance confirmed that the minimum qualifying rate for uninsured and insured mortgages will
remain the higher of: (i) the mortgage contract rate plus 2%; or (ii) 5.25% as a minimum floor.
OSFI Clarification on the Treatment of Innovative Real Estate Secured Lending Products under Guideline B-20
On June 28, 2022, OSFI released a new Advisory (Clarification on the Treatment of Innovative Real Estate Secured Lending Products under
Guideline B-20), which complements existing expectations under Guideline B-20. The Advisory articulates OSFI’s expectations regarding
underwriting practices and procedures for reverse residential mortgages, residential mortgages with shared equity features and Combined Loan
Plans (CLPs), which are applicable to all FRFIs that are engaged in residential mortgage underwriting and/or the acquisition of residential mortgage
loan assets in Canada. The changes will affect CIBC’s Home Power Plan (HPP) product, which is considered a CLP, with LTVs above 65% when
combined with related mortgage products. OSFI expects that HPPs with balances above the 65% LTV limit after considering the associated
mortgage to be both amortizing and non-readvanceable until the combined LTV reduces to 65%. For previously originated HPPs, principal
payments on both the mortgage and HPP are required to be matched by a reduction in the aggregate authorized limit until it reduces to a 65% LTV.
This change will take place for existing borrowers upon the first renewal date of their HPP after October 2023. We expect to discontinue the
origination of HPPs that do not meet these requirements by October 2023.
CIBC 2022 ANNUAL REPORT 67

Management’s discussion and analysis
Credit quality performance
As at October 31, 2022, total loans and acceptances after allowance for credit losses were $528.7 billion (2021: $462.9 billion). Consumer loans
(comprising residential mortgages, credit cards, and personal loans, including student loans) constitute 62% (2021: 65%) of the portfolio, and
business and government loans (including acceptances) constitute the remainder of the portfolio.
Consumer loans were up $26.8 billion or 9% from the prior year, primarily due to an increase in residential mortgages and credit cards.
Business and
government loans (including acceptances) were up $39.0 billion or 24% from the prior year, mainly attributable to financial
institutions, real estate and construction, business services, and retail and wholesale.
Impaired loans
The following table provides details of our impaired loans and allowance for credit losses:
$ millions, as at or for the year ended October 31 2022 2021
Business and
government
loans
Consumer
loans Total
Business and
government
loans
Consumer
loans Total
Gross impaired loans
Balance at beginning of year $ 1,033 $ 800 $ 1,833 $ 1,359 $ 990 $ 2,349
Classified as impaired during the year 491 1,456 1,947 750 1,686 2,436
Transferred to performing during the year (100) (294) (394) (235) (574) (809)
Net repayments
(1)
(243) (448) (691) (511) (579) (1,090)
Amounts written off (312) (718) (1,030) (279) (707) (986)
Foreign exchange and other 51 27 78 (51) (16) (67)
Balance at end of year $ 920 $ 823 $ 1,743 $ 1,033 $ 800 $ 1,833
Allowance for credit losses – impaired loans $ 351 $ 313 $ 664 $ 508 $ 264 $ 772
Net impaired loans
(2)
Balance at beginning of year $ 525 $ 536 $ 1,061 $ 709 $ 726 $ 1,435
Net change in gross impaired (113) 23 (90) (326) (190) (516)
Net change in allowance 157 (49) 108 142 – 142
Balance at end of year $ 569 $ 510 $ 1,079 $ 525 $ 536 $ 1,061
Net impaired loans as a percentage of net loans and acceptances 0.20 % 0.23 %
(1) Includes disposal of loans.
(2) Net impaired loans are gross impaired loans net of stage 3 allowance for credit losses.
Gross impaired loans
As at October 31, 2022, gross impaired loans were $1,743 million, down $90 million from the prior year, primarily due to decreases in the Canadian
residential mortgages portfolio, and the real estate and construction, and utilities sectors, partially offset by the impact of U.S. dollar appreciation on
our existing portfolio, and an increase in the education, health and social services sector.
57% of gross impaired loans related to Canada, of which the residential mortgages and personal lending portfolios, as well as the retail and
wholesale
, and education, health and social services sectors accounted for the majority.
21% of gross impaired loans related to the U.S., of which the real estate and construction, capital goods manufacturing, and business services
sectors accounted for the majority.
The remaining gross impaired loans related to CIBC FirstCaribbean, of which the residential mortgages and personal lending portfolios, as well
as the real estate and construction, and business services sectors accounted for the majority.
See the “Supplementary annual financial information” section for additional details on the geographic distribution and industry classification of
impaired loans.
Allowance for credit losses – impaired loans
Allowance for credit losses on impaired loans was $664 million, down $108 million from the prior year, primarily due to decreases in the utilities, real
estate and construction, and business services sectors, partially offset by the impact of the U.S. dollar appreciation on our existing portfolio.
Loans contractually past due but not impaired
The following table provides an aging analysis of loans that are not impaired, where repayment of principal or payment of interest is contractually
in arrears. Loans less than 30 days past due are excluded as such loans are not generally indicative of the borrowers’ ability to meet their
payment obligations.
$ millions, as at October 31
31 to
90 days
Over
90 days
2022
Total
2021
Total
Residential mortgages $ 874 $ – $ 874 $ 703
Personal 247 – 247 146
Credit card
(1)
206 125 331 203
Business and government 256 – 256 162
$ 1,583 $ 125 $ 1,708 $ 1,214
(1) For the acquired Canadian Costco credit card portfolio, the credit cards were transferred in the aging category that applied at the time of acquisition and have
continued to age to the extent a payment has not been made.
During the year, gross interest income that would have been recorded if impaired loans were treated as current was $87 million (2021: $96 million),
of which $45 million (2021: $55 million) was in Canada and $42 million (2021: $41 million) was outside Canada. During the year, interest recognized
on impaired loans was $35 million (2021: $41 million), and interest recognized on loans before being classified as impaired was $31 million
(2021: $30 million), of which $23 million (2021: $21 million) was in Canada and $8 million (2021: $9 million) was outside Canada.
68 CIBC 2022 ANNUAL REPORT

Management’s discussion and analysis
Exposure to certain countries and regions
The following table provides our exposure to certain countries and regions outside of Canada and the U.S.
Our direct exposures presented in the table below comprise (A) funded – on-balance sheet loans (stated at amortized cost net of stage 3
allowance for credit losses, if any), deposits with banks (stated at amortized cost net of stage 3 allowance for credit losses, if any) and securities
(stated at carrying value); (B) unfunded – unutilized credit commitments, letters of credit, and guarantees (stated at notional amount net of stage 3
allowance for credit losses, if any); and (C) derivative MTM receivables (stated at fair value) and repo-style transactions (stated at fair value).
The following table provides a summary of our positions in these regions:
Direct exposures
$ millions, as at October 31, 2022
Funded Unfunded
Derivative MTM receivables
and repo-style transactions
(1)
Total direct
exposure
(A)+(B)+(C) Corporate
Sovereign Banks
Total
funded
(A) Corporate Banks
Total
unfunded
(B) Corporate Sovereign Banks
Net
exposure
(C)
U.K. $ 6,439 $ 1,537 $ 2,562 $ 10,538 $ 6,251 $ 541 $ 6,792 $ 809 $ – $ 439 $ 1,248 $ 18,578
Europe excluding U.K.
(2)
6,366 772 5,987 13,125 5,557 1,157 6,714 146 96 455 697 20,536
Caribbean 5,167 2,343 3,151 10,661 1,810 2,299 4,109 30 – 275 305 15,075
Latin America
(3)
180 84 15 279 213 – 213 – 43 1 44 536
Asia 455 4,716 3,185 8,356 127 385 512 – 226 679 905 9,773
Oceania
(4)
7,609 1,641 1,440 10,690 3,561 204 3,765 38 – 87 125 14,580
Other 508 – 100 608 498 5 503 – – – – 1,111
Total
(5)
$ 26,724 $ 11,093 $ 16,440 $ 54,257 $ 18,017 $ 4,591 $ 22,608 $ 1,023 $ 365 $ 1,936 $ 3,324 $ 80,189
October 31, 2021 $ 13,496 $ 12,483 $ 9,153 $ 35,132 $ 9,366 $ 5,422 $ 14,788 $ 912 $ 339 $ 1,630 $ 2,881 $ 52,801
(1) The amounts shown are net of CVA and collateral. Collateral on derivative MTM receivables was $6.5 billion (2021: $4.6 billion), collateral on repo-style transactions was
$62.4 billion (2021: $60.5 billion), and both comprise cash and investment grade debt securities.
(2) Exposures to Russia and Ukraine are de minimis.
(3) Includes Mexico, Central America and South America.
(4) Includes Australia and New Zealand.
(5) Excludes exposure of $4,355 million (2021: $4,947 million) to supranationals (a multinational organization or a political union comprising member nation-states).
Settlement risk
Settlement risk is the risk that during an agreed concurrent exchange of currency or principal payments, the counterparty will fail to make its
payment to CIBC. This risk can arise in general trading activities and from payment and settlement system participation.
Many global settlement systems offer significant risk reduction benefits through complex risk mitigation frameworks. Bilateral payment netting
agreements may be put in place to mitigate risk by reducing the aggregate settlement amount between counterparties. Further, we participate in
several North American payment and settlement systems, including a global foreign exchange multilateral netting system. We also use financial
intermediaries to access some payment and settlement systems, and for certain trades, we may utilize an established clearing house to minimize
settlement risk.
Transactions settled outside of payment and settlement systems or clearing houses require approval of credit facilities for counterparties,
either as pre-approved settlement risk limits or payment-versus-payment arrangements.
Securitization activities
We engage in three types of securitization activities: we securitize assets that we originate, we securitize assets originated by third parties and we
engage in trading activities related to securitized products.
We securitize assets that we originate principally as a funding mechanism. The credit risk on the underlying assets in these transactions is
transferred to the SE, with CIBC retaining first loss exposure and other investors exposed to the remaining credit risk.
Securitization activities relating to assets originated by third parties can include the securitization of those assets through ABCP conduits (or
similar programs) that we sponsor (including both consolidated and non-consolidated SEs; see the “Off-balance sheet arrangements” section and
Note 6 to our consolidated financial statements for additional details), or through direct exposure to a client-sponsored structured entity. Risks
associated with securitization exposures to client-originated assets are mitigated through the transaction structure, which includes credit
enhancements. For the transactions where we retain credit risk on the exposures that we hold, we earn interest income on these holdings. For the
transactions in the non-consolidated ABCP conduits, we are also exposed to liquidity risk associated with the potential inability to roll over maturing
ABCP in the market. We earn fee income for the services that we provide to these ABCP conduits.
We are also involved in the trading of ABS and ABCP to earn income in our role as underwriter and market maker. We are exposed to credit
and market risk on the securities that we hold in inventory on a temporary basis until such securities are sold to an investor.
Capital requirements for exposures arising from securitization activities are determined using one of the following approaches: SEC-IRBA,
SEC-ERBA, SEC-IAA, or SEC-SA.
The SEC-IAA process relies on internal risk ratings and is utilized for securitization exposures relating to ABCP conduits when external ratings
are not available for the securitization exposures but the ABCP itself is externally rated. The internal assessment process involves an evaluation of a
number of factors, including, but not limited to, pool characteristics, including asset eligibility criteria and concentration limits, transaction triggers,
the asset seller’s risk profile, servicing capabilities, and cash flow stress testing. Cash flows are stress-tested based on historical asset performance
using our internal cash flow stress testing models by asset type. These models are subject to our model risk mitigation policies and are
independently reviewed by the Model Validation team in Risk Management. The stress test factors used to determine the transaction risk profile and
required credit enhancement levels are tailored for each asset type and transaction based on the assessment of the factors described above and
are done in accordance with our internal risk rating methodologies and guidelines. Internal risk ratings are mapped to equivalent external ratings of
external credit assessment institutions (DBRS, Fitch, Moody’s and S&P) and are used to determine the appropriate risk weights for capital purposes.
Securitization exposures and underlying asset performance are monitored on an ongoing basis. Risk Management serves as a second line of
defence providing independent oversight regarding risk rating assumptions and adjudicating on the assignment of the internal risk ratings. SEC-IAA
applies to various asset types in our ABCP conduits including, but not limited to, auto loans and leases, consumer loans, credit cards, equipment
loans and leases, fleet lease receivables, franchise loans, residential mortgages and residential rental equipment.
Internal risk ratings determined for securitization exposures are also used in the estimation of ECL as required under IFRS 9, determining
economic capital, and for setting risk limits.
CIBC 2022 ANNUAL REPORT 69

Management’s discussion and analysis
Market risk
Market risk is the risk of economic and/or financial loss in our trading and non-trading portfolios from adverse changes in underlying market factors,
including interest rates, foreign exchange rates, equity market prices, commodity prices, credit spreads, and customer behaviour for retail
products. Market risk arises in CIBC’s trading and treasury activities, and encompasses all market-related positioning and market-making activity.
The trading portfolio consists of positions in financial instruments and commodities held to meet the near-term needs of our clients.
The non-trading portfolio consists of positions in various currencies that are related to ALM and investment activities.
Governance and management
Market risk is managed through the three lines of defence model. The first line of defence comprises frontline businesses and governance groups
that are responsible for managing the market risk associated with their activities.
The second line of defence is Risk Management, which has a dedicated market risk manager for each trading business, supplemented by
regional risk managers located in all of our major trading centres, facilitating comprehensive risk coverage, including the measurement, monitoring
and control of market risk.
Internal audit is the third line of defence providing reasonable assurance to senior management and the Audit Committee of the Board on the
effectiveness of CIBC’s governance practices, risk management processes, and internal control as part of its risk-based audit plan and in
accordance with its mandate as described in the Internal Audit Charter.
Senior management reports material risk matters to the GRC and RMC at least quarterly, including material transactions, limit compliance, and
portfolio trends.
Policies
We have comprehensive policies for the management of market risk. These policies are related to the identification and measurement of various
types of market risk, their inclusion in the trading portfolio, and the establishment of limits within which we monitor, manage and report our
overall exposures. Our policies also outline the requirements for the construction of valuation models, model review and validation, independent
checking of the valuation of positions, the establishment of valuation adjustments, and alignment with accounting policies including MTM and
mark-to-model methodologies.
Market risk limits
We have risk tolerance levels, expressed in terms of statistically based VaR measures, potential stress losses, and notional or other limits as
appropriate. We use a multi-tiered approach to set limits on the amounts of risk that we can assume in our trading and non-trading activities, as
follows:
• Board limits control consolidated market risk;
• Management limits control market risk for CIBC overall and are lower than the Board limits to allow for a buffer in the event of extreme
market moves and/or extraordinary client needs;
• Tier 2 limits control market risk at the business unit level; and
• Tier 3 limits control market risk at the sub-business unit or desk level.
Management limits are established by the CRO, consistent with the risk appetite statement approved by the Board. Tier 2 and Tier 3 limits are
approved at levels of management commensurate with the risk assumed.
Process and control
Market risk exposures are monitored daily against approved risk limits, and processes are in place to monitor that only authorized activities are
undertaken. We generate daily risk and limit-monitoring reports, based on the previous day’s positions. Summary market risk and limit
compliance reports are produced and reviewed periodically with the GRC and RMC.
Risk measurement
We use the following measures for market risk:
• VaR enables the meaningful comparison of the risks in different businesses and asset classes. VaR is determined by the combined
modelling of VaR for each of interest rate, credit spread, equity, foreign exchange, commodity, and debt specific risks, along with the
portfolio effect arising from the interrelationship of the different risks (diversification effect):
• Interest rate risk measures the impact of changes in interest rates and volatilities on cash instruments and derivatives.
• Credit spread risk measures the impact of changes in credit spreads of provincial, municipal and agency bonds, sovereign bonds,
corporate bonds, securitized products, and credit derivatives such as credit default swaps.
• Equity risk measures the impact of changes in equity prices and volatilities.
• Foreign exchange risk measures the impact of changes in foreign exchange rates and volatilities.
• Commodity risk measures the impact of changes in commodity prices and volatilities, including the basis between related commodities.
• Debt specific risk measures the impact of changes in the volatility of the yield of a debt instrument as compared with the volatility of
the yield of a representative bond index.
• Diversification effect reflects the risk reduction achieved across various financial instrument types, counterparties, currencies and
regions. The extent of the diversification benefit depends on the correlation between the assets and risk factors in the portfolio at a
particular time.
• Price sensitivity measures the change in value of a portfolio to a small change in a given underlying parameter, so that component risks
may be examined in isolation, and the portfolio rebalanced accordingly to achieve a desired exposure.
• Stressed VaR enables the meaningful comparison of the risks in different businesses and asset classes under stressful conditions.
Changes to rates, prices, volatilities, and spreads over a 10-day horizon from a stressful historical period are applied to current positions
to determine stressed VaR.
• IRC measures the required capital due to credit migration and default risk for debt securities held in the trading portfolios.
• Back-testing validates the effectiveness of risk measurement through analysis of observed and theoretical profit and loss outcomes.
• Stress testing and scenario analysis provide insight into portfolio behaviour under extreme circumstances.
70 CIBC 2022 ANNUAL REPORT

Management’s discussion and analysis
The following table provides balances on the consolidated balance sheet that are subject to market risk. Certain differences between accounting
and risk classifications are detailed in the footnotes below:
$ millions, as at October 31 2022 2021
Consolidated
balance
sheet
Subject to market risk
(1)
Not
subject to
market risk
Consolidated
balance
sheet
Subject to market risk
(1)
Not
subject to
market risk
Non-traded risk
primary risk
sensitivity Trading
Non-
trading Trading
Non-
trading
Cash and non-interest-bearing
deposits with banks $ 31,535 $ – $ 3,009 $ 28,526 $ 34,573 $ – $ 2,661 $ 31,912 Foreign exchange
Interest-bearing deposits with banks 32,326 9 32,317 – 22,424 19 22,405 – Interest rate
Securities 175,879 50,295 125,584 – 161,401 56,028 105,373 – Interest rate, equity
Cash collateral on securities
borrowed 15,326 – 15,326 – 12,368 – 12,368 – Interest rate
Securities purchased under resale
agreements 69,213 – 69,213 – 67,572 – 67,572 – Interest rate
Loans
Residential mortgages 269,706 – 269,706 – 251,526 – 251,526 – Interest rate
Personal 45,429 – 45,429 – 41,897 – 41,897 – Interest rate
Credit card 16,479 – 16,479 – 11,134 – 11,134 – Interest rate
Business and government 188,542 209
(2)
188,333 – 150,213 24,780
(2)
125,433 – Interest rate
Allowance for credit losses (3,073) – (3,073) – (2,849) – (2,849) – Interest rate
Derivative instruments 43,035 40,048 2,987 – 35,912 34,589 1,323 – Interest rate,
foreign exchange
Customers’ liability under
acceptances 11,574 – 11,574 – 10,958 – 10,958 – Interest rate
Other assets 47,626 2,025 34,294 11,307 40,554 2,977 26,743 10,834 Interest rate, equity,
foreign exchange
$ 943,597 $ 92,586 $ 811,178 $ 39,833 $ 837,683 $ 118,393 $ 676,544 $ 42,746
Deposits $ 697,572 $ 714
(3)
$ 626,562 $ 70,296 $ 621,158 $ 609
(3)
$ 548,419 $ 72,130 Interest rate
Obligations related to securities
sold short 15,284 14,216 1,068 – 22,790 19,472 3,318 – Interest rate
Cash collateral on securities lent 4,853 – 4,853 – 2,463 – 2,463 – Interest rate
Obligations related to securities sold
under repurchase agreements 77,171 – 77,171 – 71,880 – 71,880 – Interest rate
Derivative instruments 52,340 46,393 5,947 – 32,101 30,882 1,219 – Interest rate,
foreign exchange
Acceptances 11,586 – 11,586 – 10,961 – 10,961 – Interest rate
Other liabilities 28,117 2,836 14,347 10,934 24,961 2,705 11,344 10,912 Interest rate
Subordinated indebtedness 6,292 – 6,292 – 5,539 – 5,539 – Interest rate
$ 893,215 $ 64,159 $ 747,826 $ 81,230 $ 791,853 $ 53,668 $ 655,143 $ 83,042
(1) Funding valuation adjustment (FVA) exposures are excluded from trading activities for regulatory capital purposes, with related derivative hedges to these FVA exposures
also excluded.
(2) Excludes nil (2021: $48 million) of loans that are warehoused for future securitization purposes. These are considered non-trading for market risk purposes.
(3) Comprises FVO deposits which are considered trading for market risk purposes.
Trading activities
We hold positions in traded financial contracts to meet client investment and risk management needs. Trading revenue (net interest income and
non-interest income) is generated from these transactions. Trading instruments are recorded at fair value and include debt and equity securities,
as well as interest rate, foreign exchange, equity, commodity, and credit derivative products.
Value-at-risk
Our VaR methodology is a statistical technique that measures the potential overnight loss at a 99% confidence level. We use a full revaluation
historical simulation methodology to compute VaR, stressed VaR and other risk measures.
Although a valuable guide to risk, VaR should always be viewed in the context of its limitations. For example:
• The use of historical data for estimating future events will not encompass all potential events, particularly those that are extreme in nature.
• The use of a one-day holding period assumes that all positions can be liquidated, or the risks offset in one day. This may not fully reflect the
market
risk arising at times of severe illiquidity, when a one-day period may be insufficient to liquidate or hedge all positions fully.
• The use of a 99% confidence level does not take into account losses that might occur beyond this level of confidence.
• VaR is calculated on the basis of exposures outstanding at the close of business and assumes no management action to mitigate losses.
The VaR table below presents market risks by type of risk and in aggregate. The risks are interrelated and the diversification effect reflects the
reduction
of risk due to portfolio effects among the trading positions. Our trading risk exposures to interest rates and credit spreads arise from
activities in the global debt and derivative markets, particularly from transactions in the Canadian, U.S. and European markets. The primary
instruments are government and corporate debt, and interest rate derivatives. The majority of the trading exposure to foreign exchange risk
arises from transactions involving the Canadian dollar, U.S. dollar, Euro, Pound sterling, Australian dollar, Chinese yuan and Japanese yen,
whereas the primary risks of losses in equities are in the U.S., Canadian and European markets. Trading exposure to commodities arises
primarily from transactions involving North American natural gas, crude oil products, and precious metals.
Stressed VaR
The stressed VaR measure is intended to replicate the VaR calculation that would be generated for our current portfolio if the values of the
relevant market risk factors were sourced from a period of stressed market conditions. The model inputs are calibrated to historical data from a
continuous 12-month period of significant financial stress relevant to our current portfolio since December 2006. In 2022, our stressed VaR
window has been the 2008–2009 Global Financial Crisis period. This historical period exhibited not only increased volatility in interest rates but
also increased volatility in equity prices, combined with a reduction in the level of interest rates, and an increase in credit spreads.
CIBC 2022 ANNUAL REPORT 71

Management’s discussion and analysis
Incremental risk charge
IRC is a measure of default and migration risk for debt securities held in the trading portfolios. Our IRC methodology measures the risk of issuer
migration and default, at a 99.9% confidence level, over a period of one year.
$ millions, as at or for the year ended October 31 2022 2021
High Low As at Average High Low As at Average
Interest rate risk $ 16.3 $ 4.7 $ 6.0 $ 7.3 $ 15.0 $ 4.1 $ 5.7 $ 8.7
Credit spread risk 11.0 0.9 1.1 3.4 11.8 5.8 8.4 8.5
Equity risk 10.5 2.6 4.1 4.9 7.8 2.3 6.5 4.1
Foreign exchange risk 4.8 0.5 1.2 1.8 3.8 0.4 1.6 1.4
Commodity risk 6.0 1.1 1.4 2.3 6.1 1.0 1.3 3.0
Debt specific risk 3.3 1.2 1.9 2.2 5.7 2.1 2.9 3.1
Diversification effect
(1)
n/m n/m (8.1) (13.2) n/m n/m (18.5) (21.2)
Total VaR (one-day measure) $ 14.6 $ 5.5 $ 7.6 $ 8.7 $ 13.9 $ 4.6 $ 7.9 $ 7.6
Stressed total VaR (one-day measure) $ 49.9 $ 16.1 $ 31.2 $ 30.0 $ 40.8 $ 15.3 $ 33.2 $ 28.0
IRC (one-year measure)
(2)
$ 178.9 $ 95.7 $ 114.0 $ 130.7 $ 266.4 $ 144.6 $ 182.3 $ 203.5
(1) Total VaR is less than the sum of the VaR of the different market risk types due to risk offsets resulting from a portfolio diversification effect.
(2) High and low IRC are not equal to the sum of the constituent parts, because the highs and lows of the constituent parts may occur on different days.
n/m Not meaningful. It is not meaningful to compute a diversification effect because the high and low may occur on different days for different risk types.
Average total VaR for the year ended October 31, 2022 was up $1.1 million from the prior year, driven primarily by a decrease in the diversification
benefit, partially offset by decreases in credit spread and interest rate risks.
Average stressed total VaR for the year ended October 31, 2022 was up $2.0 million from the prior year. The increase was primarily due to
increased equity risk.
Average IRC for the year ended October 31, 2022 was down $72.8 million from the prior year due to decreases in trading book bond inventory and
improved credit quality within our fixed income portfolio.
Back-testing
To determine the reliability of the trading VaR model, outcomes are monitored regularly through a back-testing process to test the validity of the
assumptions and the parameters used in the trading VaR calculation. The back-testing process includes calculating a hypothetical or static
profit and loss and comparing that result with calculated VaR. Static profit and loss represents the change in value of the prior day’s closing
portfolio due to each day’s price movements, on the assumption that the portfolio remained unchanged. The back-testing process is conducted
on a daily basis at the consolidated CIBC level as well as business lines and individual portfolios.
Static profit and loss in excess of the one-day VaR are investigated. The back-testing process, including the investigation of results, is
performed by risk professionals who
are independent of those responsible for development of the model.
Based on our back-testing results, we are able to ensure that our VaR model continues to appropriately measure risk.
During the year, there were two negative back-testing breaches of the total VaR measure at the consolidated
CIBC level, driven by the
volatility in CAD and, to a lesser extent, USD interest rates.
72 CIBC 2022 ANNUAL REPORT

Management’s discussion and analysis
Trading revenue
Trading revenue (TEB) comprises both trading net interest income and non-interest income and excludes underwriting fees and commissions. See
the “Financial performance overview” section for details. Trading revenue (TEB) in the charts below excludes certain exited portfolios.
During the year, trading revenue (TEB) was positive for 96.9% of the days, with the largest loss of $8.8 million occurring on September 26, 2022.
Average daily trading revenue (TEB) was $7.8 million during the year, compared to $6.7 million during the previous year. Average daily trading
revenue (TEB) is calculated as the total trading revenue (TEB) divided by the number of business days in the year.
Frequency distribution of daily 2022 trading revenue (TEB)
(1)
The histogram below presents the frequency distribution of daily trading revenue (TEB) for 2022.
Trading Revenue Days
(1) or
less
0 1 2 3 4 5 6 7 8 9 10 11 1312 14 15 16 17 18 19
20 21 or
more
C $ Millions
0
10
5
20
15
25
30
Trading revenue (TEB)
(1)
versus VaR
(2)
The trading revenue (TEB) versus VaR graph below shows the current year’s daily trading revenue (TEB) against the close of business day VaR
measures.
Trading Revenue (TEB) VaR
(20)
35
25
30
5
15
10
20
0
(5)
(10)
(15)
$ millions
Nov-21 Dec-21 Jan-22 Feb-22 Mar-22 Apr-22 May-22 Jun-22 Jul-22 Aug-22 Sep-22 Oct-22
(1) Excludes certain month-end transfer pricing and other miscellaneous adjustments.
(2) Fair value adjustments are excluded from trading activities for regulatory capital purposes, with related derivative hedges to these fair value adjustments also excluded.
CIBC 2022 ANNUAL REPORT 73

Management’s discussion and analysis
Stress testing and scenario analysis
Stress testing and scenario analysis is designed to add insight into possible outcomes of abnormal market conditions, and to highlight possible
concentration of risk.
We measure the effect on portfolio valuations under a wide range of extreme moves in market risk factors. Our approach simulates the
impact on earnings of extreme market events over a one-month time horizon, and in most cases assume that no risk-mitigating actions are taken
during this period to reflect the reduced market liquidity that typically accompanies such events.
Scenarios are developed using historical market data during periods of market disruption, or are based on hypothetical impacts of
economic events, political events, and natural disasters as predicted by economists, business leaders, and risk managers.
Among the historical scenarios are the 1994 period of U.S. Federal Reserve tightening, and the market events following the 2008 market
crisis. The hypothetical scenarios include potential market crises originating in North America, Europe and Asia.
The hypothetical scenarios are informed from current themes in geopolitics, central bank action and various macro themes originating in
North America, Europe and Asia. These include considering the impact of further escalation in the war in Ukraine, possible conflict between
Taiwan and China and further impact of rising energy prices. Furthermore, during the past year, we amended our Pandemic hypothetical
scenario to reflect the shocks observed during the initial month following the declaration of the pandemic.
Below are examples of the core stress test scenarios which are currently run on a daily basis to add insight into potential exposures under stress:
• Subprime crisis traded
• U.S. Federal Reserve
tightening – 1994
• U.S. sovereign debt default and downgrade
• Chinese hard landing
• Canadian market crisis
• U.S. protectionism
• Eurozone bank crisis
• Pandemic
• Quantitative easing tapering and asset
price correction
• Oil crisis
Stress testing scenarios are periodically reviewed and amended as necessary
to ensure they remain relevant. Under stress limit monitoring, limits
are placed on the maximum acceptable loss based on risk appetite in aggregate, at the detailed portfolio level, and for specific asset classes.
Non-trading activities
Structural interest rate risk (SIRR)
SIRR primarily consists of the risk arising due to mismatches in assets and liabilities, which do not arise from trading and trading-related
businesses. The objective of SIRR management is to lock in product spreads and deliver stable and predictable net interest income over time,
while managing the risk to the economic value of our assets arising from changes in interest rates.
SIRR results from differences in the maturities or repricing dates of assets and liabilities, both on- and off-balance sheet, as well as from
embedded optionality in retail products, and other product features that could affect the expected timing of cash flows, such as options to
pre-pay loans or redeem term deposits prior to contractual maturity. A number of assumptions affecting cash flows, product re-pricing and the
administration of rates underlie the models used to measure SIRR. The key assumptions pertain to the expected funding profile of mortgage rate
commitments, fixed rate loan prepayment behaviour, term deposit redemption behaviour, the treatment of non-maturity deposits and equity. All
assumptions are derived empirically based on historical client behaviour, balance sheet composition and product pricing with the consideration
of possible forward-looking changes. All models and assumptions used to measure SIRR are subject to independent oversight by Risk
Management. A variety of cash instruments and derivatives, primarily interest rate swaps, are used to manage these risks.
The Board has oversight of the management of SIRR, approves the risk appetite and the associated SIRR risk limits. GALCO and its
subcommittee, the Asset Liability Management Committee, regularly review structural market risk positions and provide senior management
oversight.
In addition to Board-approved limits on earnings and economic value exposure, more granular management limits are in place to guide
day-to-day management of this risk. The ALM group within Treasury is responsible for the ongoing management of structural market risk across
the enterprise, with independent oversight and compliance with SIRR policy provided by Risk Management.
ALM activities are designed to manage the effects of potential interest rate movements while balancing the cost of any hedging activities
on the current net revenue. To monitor and control SIRR, two primary metrics, net interest income risk and economic value of equity (EVE) risk,
are assessed, in addition to stress testing, gap analysis and other market risk metrics. The net interest income sensitivity is a measure of the
impact of potential changes in interest rates on the projected 12-month pre-tax net interest income of the bank’s portfolio of assets, liabilities and
off-balance sheet positions in response to prescribed parallel interest rate movements with interest rates floored at zero. The EVE sensitivity is a
measure of the impact of potential changes in interest rates on the market value of the bank’s assets, liabilities and off-balance sheet positions in
response to prescribed parallel interest rate movements with interest rates floored at zero.
The following table shows the potential before-tax impact of an immediate and sustained 100 basis points increase and 100 basis points
decrease in interest rates on projected 12-month net interest income and the EVE for our structural balance sheet, assuming no subsequent
hedging. Due to the recent increase in interest rates in Canada and the U.S., and the market expectation that a higher interest rate environment
will persist, an immediate downward shock of 100 basis points was applied in the current year, while maintaining a floor on market and client
interest rates at zero at the end of the year. We have continued to provide the impact of a 25 basis point decrease and have not revised prior
period amounts as we believe the impact of a 25 basis points decrease was appropriate due to the low interest rate environment in both Canada
and the U.S. for those periods.
74 CIBC 2022 ANNUAL REPORT

Management’s discussion and analysis
Structural interest rate sensitivity – measures
$ millions (pre-tax), as at October 31 2022 2021
CAD
(1)
USD Total CAD
(1)
USD Total
100 basis point increase in interest rates
Increase (decrease) in net interest income $ 278 $ (7) $ 271 $ 270 $ 134 $ 404
Increase (decrease) in EVE (679) (336) (1,015) (684) (161) (845)
25 basis point decrease in interest rates
Increase (decrease) in net interest income (71) 2 (69) (117) (70) (187)
Increase (decrease) in EVE 151 86 237 161 29 190
100 basis point decrease in interest rates
Increase (decrease) in net interest income (301) 4 (297) n/a n/a n/a
Increase (decrease) in EVE 604 350 954 n/a n/a n/a
(1) Includes CAD and other currency exposures.
n/a Not applicable.
Foreign exchange risk
Structural foreign exchange risk primarily consists of the risk inherent in: (a) net investments in foreign operations (NIFO) due to changes in foreign
exchange rates; and (b) foreign currency denominated RWA and foreign currency denominated capital deductions. This risk, predominantly in
U.S. dollars, is managed using derivative hedges and by funding the investments in matching currencies. We actively manage this position to
ensure that the potential impact on our capital ratios is within an acceptable tolerance in accordance with the policy approved by the CRO, while
giving consideration to the impact on earnings and shareholders’ equity. Structural foreign exchange risk is managed by Treasury under the
guidance of GALCO with monitoring and oversight by Capital Markets Risk Management.
A 1% appreciation of the Canadian dollar would reduce our shareholders’ equity as at October 31, 2022 by approximately $200 million
(2021: $160 million) on an after-tax basis.
Our non-functional currency denominated earnings are converted into the functional currencies through spot or forward foreign exchange
transactions. Typically, there is no significant impact of exchange rate fluctuations on our consolidated statement of income.
Derivatives held for ALM purposes
Where derivatives are held for ALM purposes, and when transactions meet the criteria specified under IFRS, we apply hedge accounting for the
risks being hedged, as discussed in Notes 12 and 13 to the consolidated financial statements. Derivative hedges that do not qualify for hedge
accounting treatment are referred to as economic hedges and are recorded at fair value on the consolidated balance sheet with changes in fair
value recognized in the consolidated statement of income.
Economic hedges for other than FVO financial instruments may lead to income volatility because the hedged items are recorded either on
a cost or amortized cost basis or recorded at fair value on the consolidated balance sheet with changes in fair value recognized through OCI.
This income volatility may not be representative of the overall risk.
Equity risk
Non-trading equity risk arises primarily in our strategy and corporate development activities and strategic investments portfolio. The investments
comprise public and private equities, investments in limited partnerships, and equity-accounted investments.
The following table provides the amortized cost and fair values of our non-trading equities:
$ millions, as at October 31 Cost Fair value
2022 Equity securities designated at FVOCI $ 525 $ 522
Equity-accounted investments in associates
(1)
206 230
$ 731 $ 752
2021 Equity securities designated at FVOCI $ 730 $ 836
Equity-accounted investments in associates
(1)
66 89
$ 796 $ 925
(1) Excludes our equity-accounted joint ventures. See Note 25 to the consolidated financial statements for further details.
Pension risk
We sponsor defined benefit pension plans in a number of jurisdictions. As at October 31, 2022, our consolidated defined benefit pension plans were
in a net asset position of $1,379 million, compared with $1,323 million as at October 31, 2021. The change in the net asset position of our pension
plans is disclosed in Note 18 to the consolidated financial statements.
Our Canadian pension plans represent approximately 91% of our pension plans, the most significant of which is our principal Canadian
pension plan (the CIBC Pension Plan). The estimated impact
on our Canadian defined benefit obligations of a 100 basis point change in the
discount rate is disclosed in Note 18 to the consolidated financial statements.
The MRCC is responsible for sound governance and oversight, and delegates management authority to the Pension Benefits Management
Committee (PBMC). An appropriate investment strategy for the CIBC Pension Plan is set through
a statement of investment objectives, policies and
procedures.
Within Treasury, the Pension Investment Management department is responsible for developing and implementing custom investment
strategies to sustainably deliver pension benefits within manageable risk tolerances and capital impacts. Key risks include act
uarial risks (such as
longevity risk), interest rate risk, currency risk, and market (investment) risk.
A principal risk for the CIBC Pension Plan is interest rate risk, which it manages through its liability-driven investment strategy which includes a
combination of physical bonds and a bond overlay program funded through the use
of repurchase agreements. The plan also operates a currency
overlay strategy, which may use forwards or similar instruments, to manage and mitigate its currency risk. Investment risk is mitigated through a
multi-asset portfolio construction process that diversifies across a variety of market risk drivers.
The use of derivatives within the CIBC Pension Plan are permitted for risk management and rebalancing purposes, as well as the ability to
enhance returns and are governed by the plan’s derivatives policy that was approved by the PBMC. The fair value of derivatives held in the CIBC
Pension Plan is disclosed in Note 18 to the consolidated financial statements.
CIBC 2022 ANNUAL REPORT 75

Management’s discussion and analysis
Liquidity risk
Liquidity risk is the risk of having insufficient cash or its equivalent in a timely and cost-effective manner to meet financial obligations as they
come due. Common sources of liquidity risk inherent in banking services include unanticipated withdrawals of deposits, the inability to replace
maturing debt, credit and liquidity commitments, and additional pledging or other collateral requirements.
Our approach to liquidity risk management supports our business strategy, aligns with our risk appetite and adheres to regulatory
expectations.
Our management strategies, objectives and practices are regularly reviewed to align with changes to the liquidity environment, including
regulatory, business and/or market developments. Liquidity risk remains within CIBC’s risk appetite.
Governance and management
We manage liquidity risk in a manner that enables us to withstand a liquidity stress event without an adverse impact on the viability of our
operations. Actual and anticipated cash flows generated from on- and off-balance sheet exposures are routinely measured and monitored to ensure
compliance with established limits. We incorporate stress testing into the management and measurement of liquidity risk. Stress test results assist
with the development of our liquidity assumptions, identification of potential constraints to funding planning, and contribute to the design of our
contingency funding plan.
Liquidity risk is managed using the three lines of defence model, and the ongoing management of liquidity risk is the responsibility of the
Treasurer, supported
by guidance from GALCO.
The Treasurer is responsible for managing the activities and processes required for measurement and the reporting and monitoring of CIBC’s
liquidity risk position as the first line of defence.
The Liquidity and Non-Trading Market Risk group provides
independent oversight of the measurement, monitoring and control of liquidity risk,
as the second line of defence.
Internal audit is the third line of defence providing reasonable assurance to senior management and the Audit Committee of the Board on the
effectiveness of CIBC’s governance practices, risk management processes, and internal control as part of its risk-based audit plan and in
accordance with its mandate as described in the Internal Audit Charter.
The GALCO governs CIBC’s liquidity risk management, ensuring the liquidity risk management methodologies, assumptions, and key metrics
are regularly reviewed and aligned with CIBC’s requirements. The Liquidity Risk Management Committee, a subcommittee of GALCO, monitors
global liquidity risk and is responsible for ensuring that CIBC’s liquidity risk profile is comprehensively measured and managed in alignment with
CIBC’s strategic direction, risk appetite and regulatory requirements.
The RMC provides governance through bi-annual review of CIBC’s liquidity risk management policy, and recommends liquidity risk tolerance
to the Board through the risk appetite statement which is reviewed annually.
Policies
Our liquidity risk management policy establishes requirements that enable us to meet anticipated liquidity needs in both normal and stressed
conditions by maintaining a sufficient amount of available unencumbered liquid assets and diversified funding sources. Branches and
subsidiaries possessing unique liquidity characteristics, due to distinct businesses or jurisdictional requirements, maintain local liquidity
practices in alignment with CIBC’s liquidity risk management policy.
Our pledging policy sets out consolidated limits for the pledging of CIBC’s assets across a broad range of financial activities. These limits
ensure unencumbered liquid assets are available for liquidity purposes.
We maintain a detailed global contingency funding plan that sets out the strategies for addressing liquidity shortfalls in emergency and
unexpected situations, and delineates the requirements necessary to manage a range of stress conditions, establishes lines of responsibility,
articulates implementation, defines escalation procedures, and is aligned to CIBC’s risk appetite. In order to reflect CIBC’s organizational
complexity, regional and subsidiary contingency funding plans are maintained to respond to liquidity stresses unique to the jurisdictions within
which CIBC operates, and support CIBC as an enterprise.
Risk measurement
Our liquidity risk tolerance is defined by our risk appetite statement, which is approved annually by the Board, and forms the basis for the
delegation of liquidity risk authority to senior management. We use both regulatory-driven and internally developed liquidity risk metrics to
measure our liquidity risk exposure. Internally, our liquidity position is measured using the Liquidity Horizon, which combines contractual and
behavioural cash flows to measure the future point in time when projected cumulative cash outflows exceed cash inflows under a combined
CIBC-specific and market-wide stress scenario. Expected and potential anticipated inflows and outflows of funds generated from on- and
off-balance sheet exposures are measured and monitored on a regular basis to ensure compliance with established limits. These cash flows
incorporate both contractual and behavioural on- and off-balance sheet cash flows.
Our liquidity measurement system provides liquidity risk exposure reports that include the calculation of the internal liquidity stress tests
and regulatory reporting such as the LCR, NSFR and NCCF. Our liquidity management also incorporates the monitoring of our unsecured
wholesale funding position and funding capacity.
Risk appetite
CIBC’s risk appetite statement ensures prudent management of liquidity risk by outlining qualitative considerations and quantitative metrics
including the LCR and Liquidity Horizon. Quantitative metrics are measured and managed to a set of limits approved by Risk Management.
Stress testing
A key component of our liquidity risk management, and complementing our assessments of liquidity risk exposure, is liquidity risk stress testing.
Liquidity stress testing involves the application of name-specific and market-wide stress scenarios at varying levels of severity to assess the amount
of available liquidity required to satisfy anticipated obligations as they come due. The scenarios model potential liquidity and funding requirements
in the event of changes to unsecured wholesale funding and deposit run-off, contingent liquidity utilization, and liquid asset marketability.
76 CIBC 2022 ANNUAL REPORT

Management’s discussion and analysis
Liquid assets
Available liquid assets include unencumbered cash and marketable securities from on- and off-balance sheet sources, that can be used to
access funding in a timely fashion. Encumbered liquid assets, composed of assets pledged as collateral and those assets that are deemed
restricted due to legal, operational, or other purposes, are not considered as sources of available liquidity when measuring liquidity risk.
Encumbered and unencumbered liquid assets from on- and off-balance sheet sources are summarized as follows:
$ millions, as at October 31
Bank owned
liquid assets
Securities received
as collateral
Total liquid
assets
Encumbered
liquid assets
Unencumbered
liquid assets
(1)
2022 Cash and deposits with banks $ 63,861 $ – $ 63,861 $ 286 $ 63,575
Securities issued or guaranteed by sovereigns,
central banks, and multilateral development banks
133,923 85,602 219,525 122,283 97,242
Other debt securities 6,764 8,957 15,721 2,262 13,459
Equities 30,825 29,521 60,346 30,408 29,938
Canadian government guaranteed National Housing
Act mortgage-backed securities
33,148 3,321 36,469 16,711 19,758
Other liquid assets
(2)
19,159 2,326 21,485 16,040 5,445
$ 287,680 $ 129,727 $ 417,407 $ 187,990 $ 229,417
2021 Cash and deposits with banks $ 56,997 $ – $ 56,997 $ 252 $ 56,745
Securities issued or guaranteed by sovereigns,
central banks, and multilateral development banks
113,515 100,944 214,459 134,370 80,089
Other debt securities 5,681 5,510 11,191 1,827 9,364
Equities 37,855 22,996 60,851 25,133 35,718
Canadian government guaranteed National Housing
Act mortgage-backed securities
36,116 948 37,064 14,677 22,387
Other liquid assets
(2)
12,772 3,927 16,699 7,203 9,496
$ 262,936 $ 134,325 $ 397,261 $ 183,462 $ 213,799
(1) Unencumbered liquid assets are defined as on-balance sheet assets, assets borrowed or purchased under resale agreements, and other off-balance sheet collateral
received less encumbered liquid assets.
(2) Includes cash pledged as collateral for derivatives transactions, select ABS and precious metals.
The following table summarizes unencumbered liquid assets held by CIBC (parent) and its domestic and foreign subsidiaries:
$ millions, as at October 31 2022 2021
CIBC (parent) $ 166,968 $ 153,971
Domestic subsidiaries 11,535 12,271
Foreign subsidiaries 50,914 47,557
$ 229,417 $ 213,799
Asset haircuts and monetization depth assumptions under a liquidity stress scenario are applied to determine asset liquidity value. Haircuts take into
consideration those margins applicable at central banks – such as the Bank of Canada and the U.S. Federal Reserve Bank – historical observations, and
securities characteristics including asset type, issuer, credit ratings, currency and remaining term to maturity, as well as available regulatory guidance.
Our unencumbered liquid assets increased by $15.6 billion since October 31, 2021, primarily due to an increase in unencumbered liquid
government securities holdings and cash balances. This increase is a
result of higher deposit and funding levels to fund asset growth.
Furthermore, we maintain access eligibility to the Bank of Canada’s Emergency Lending Assistance program and the U.S. Federal Reserve
Bank’s Discount Window.
Asset encumbrance
In the course of our day-to-day operations, securities and other assets are pledged to secure obligations, participate in clearing and settlement
systems and for other collateral management purposes.
The following table provides a summary of our total on- and off-balance sheet encumbered and unencumbered assets:
$ millions, as at October 31
Encumbered Unencumbered Total assets
Pledged as
collateral Other
(1)
Available as
collateral Other
(2)
2022 Cash and deposits with banks $ – $ 286 $ 63,575 $ – $ 63,861
Securities
(3)
157,357 5,263 141,964 – 304,584
Loans, net of allowance for credit losses
(4)
– 46,720 29,645 440,720 517,085
Other assets 13,637 – 2,304 86,294 102,235
$ 170,994 $ 52,269 $ 237,488 $ 527,014 $ 987,765
2021 Cash and deposits with banks $ – $ 252 $ 56,745 $ – $ 56,997
Securities
(3)
154,382 1,817 134,018 – 290,217
Loans, net of allowance for credit losses
(4)
1,488 44,615 29,331 376,487 451,921
Other assets 6,599 – 3,005 77,820 87,424
$ 162,469 $ 46,684 $ 223,099 $ 454,307 $ 886,559
(1) Includes assets supporting CIBC’s long-term funding activities and assets restricted for legal or other reasons, such as restricted cash.
(2) Other unencumbered assets are not subject to any restrictions on their use to secure funding or as collateral, however, they are not considered immediately available to
existing borrowing programs.
(3) Total securities comprise certain on-balance sheet securities, as well as off-balance sheet securities received under resale agreements, secured borrowings transactions,
and collateral-for-collateral transactions.
(4) Loans included as available as collateral represent the loans underlying National Housing Act mortgage-backed securities and Federal Home Loan Banks eligible loans.
Restrictions on the flow of funds
Our subsidiaries are not subject to significant restrictions that would prevent transfers of funds, dividends or capital distributions. However,
certain subsidiaries have different capital and liquidity requirements, established by applicable banking and securities regulators.
We monitor and manage our capital and liquidity requirements across these entities to ensure that resources are used efficiently and entities
are in compliance with local regulatory and policy requirements.
CIBC 2022 ANNUAL REPORT 77

Management’s discussion and analysis
Liquidity coverage ratio
The objective of the LCR is to promote short-term resilience of a bank’s liquidity risk profile, ensuring that it has adequate unencumbered high-
quality liquid resources to meet its liquidity needs in a 30-day acute stress scenario. Canadian banks are required by OSFI to achieve a minimum
LCR value of 100%. We are in compliance with this requirement.
In accordance with the calibration methodology contained in OSFI’s LAR Guideline, we report the LCR to OSFI on a monthly basis. The ratio is
calculated as the total of unencumbered HQLA over the total net cash outflows in the next 30 calendar days.
The LCR’s numerator consists of unencumbered HQLA, which follow an OSFI-defined set of eligibility criteria that considers fundamental and
market-related characteristics, and the relative ability to operationally monetize assets on a timely basis during a period of stress. Our centrally-
managed liquid asset portfolio includes those liquid assets reported in the HQLA, such as central government treasury bills and bonds, central bank
deposits and high-rated sovereign, agency, provincial, and corporate securities. Asset eligibility limitations inherent in the LCR metric do not
necessarily reflect our internal assessment of our ability to monetize our marketable assets under stress.
The ratio’s denominator reflects net cash outflows expected in the LCR’s stress scenario over the 30-calendar-day period. Expected cash
outflows represent LCR-defined withdrawal or draw-down rates applied against outstanding liabilities and off-balance sheet commitments,
respectively. Significant contributors to our LCR outflows include business and financial institution deposit run-off, draws on undrawn lines of credit
and unsecured debt maturities. Cash outflows are partially offset by cash inflows, which are calculated at OSFI-prescribed LCR inflow rates, and
include performing loan repayments and maturing non-HQLA marketable assets.
During a period of financial stress, institutions may use their stock of HQLA, thereby falling below 100%, as maintaining the LCR at 100% under
such circumstances could produce undue negative effects on the institution and other market participants.
The LCR is calculated and disclosed using a standard OSFI-prescribed template.
$ millions, average of the three months ended October 31, 2022 Total unweighted value
(1)
Total weighted value
(2)
HQLA
1 HQLA n/a $ 181,522
Cash outflows
2 Retail deposits and deposits from small business customers, of which: $ 228,368 17,128
3 Stable deposits 98,720 2,962
4 Less stable deposits 129,648 14,166
5 Unsecured wholesale funding, of which: 224,197 98,230
6 Operational deposits (all counterparties) and deposits in networks of cooperative banks 115,716 28,374
7 Non-operational deposits (all counterparties) 86,173 47,548
8 Unsecured debt 22,308 22,308
9 Secured wholesale funding n/a 13,987
10 Additional requirements, of which: 159,193 41,293
11 Outflows related to derivative exposures and other collateral requirements 26,510 13,946
12 Outflows related to loss of funding on debt products 6,910 6,910
13 Credit and liquidity facilities 125,773 20,437
14 Other contractual funding obligations 5,141 5,141
15 Other contingent funding obligations 388,116 7,394
16 Total cash outflows n/a 183,173
Cash inflows
17 Secured lending (e.g. reverse repos) 101,934 22,659
18 Inflows from fully performing exposures 23,311 11,669
19 Other cash inflows 8,196 8,196
20 Total cash inflows $ 133,441 $ 42,524
Total adjusted value
21 Total HQLA n/a $ 181,522
22 Total net cash outflows n/a $ 140,649
23 LCR n/a 129 %
$ millions, average of the three months ended July 31, 2022 Total adjusted value
24 Total HQLA n/a $ 167,702
25 Total net cash outflows n/a $ 136,859
26 LCR n/a 123 %
(1) Unweighted inflow and outflow values are calculated as outstanding balances maturing or callable within 30 days of various categories or types of liabilities, off-balance
sheet items or contractual receivables.
(2) Weighted values are calculated after the application of haircuts (for HQLA) and inflow and outflow rates prescribed by OSFI.
n/a Not applicable as per the LCR common disclosure template.
Our average LCR as at October 31, 2022, increased to 129% from 123% in the prior quarter, due to higher HQLA, partially offset by an increase in
net cash outflows.
Furthermore, we report the LCR to OSFI in multiple currencies, thus measuring the extent of potential currency mismatch under the ratio. CIBC
predominantly operates in major currencies with deep and fungible foreign exchange markets.
Net stable funding ratio (NSFR)
Derived from the BCBS’s Basel III framework and incorporated into OSFI’s LAR Guideline, the NSFR standard aims to promote long-term resilience
of the financial sector by requiring banks to maintain a sustainable funding profile in relation to the composition of their assets and off-balance sheet
activities. Canadian D-SIBs are required to maintain a minimum NSFR value of 100% on a consolidated bank basis. CIBC is in compliance with this
requirement.
In accordance with the calibration methodology contained in OSFI’s LAR Guideline, we report the NSFR to OSFI on a quarterly basis. The ratio
is calculated as total available stable funding (ASF) over the total required stable funding (RSF).
The numerator consists of the portion of capital and liabilities considered reliable over a one-year time horizon. The NSFR considers longer-
term sources of funding to be more stable than short-term funding and deposits from retail and commercial customers to be behaviourally more
78 CIBC 2022 ANNUAL REPORT

Management’s discussion and analysis
stable than wholesale funding of the same maturity. In accordance with our funding strategy, key drivers of our ASF include client deposits
supplemented by secured and unsecured wholesale funding, and capital instruments.
The denominator represents the amount of stable funding required based on the OSFI-defined liquidity characteristics and residual maturities
of assets and off-balance sheet exposures. The NSFR ascribes varying degrees of RSF such that HQLA and short-term exposures are assumed to
have a lower funding requirement than less liquid and longer-term exposures. Our RSF is largely driven by retail, commercial and corporate lending,
investments in liquid assets, derivative exposures, and undrawn lines of credit and liquidity.
The ASF and RSF may be adjusted to zero for certain liabilities and assets that are determined to be interdependent if they meet the NSFR-
defined criteria, which take into account the purpose, amount, cash flows, tenor and counterparties among other aspects to ensure the institution is
acting solely as a pass-through unit for the underlying transactions. We report, where applicable, interdependent assets and liabilities arising from
transactions OSFI has designated as eligible for such treatment in the LAR Guideline.
The NSFR is calculated and disclosed using an OSFI-prescribed template, which captures the key quantitative information based on liquidity
characteristics unique to the NSFR as defined in the LAR Guideline. As a result, amounts presented in the table below may not allow for direct
comparison with the annual consolidated financial statements.
$ millions, as at October 31, 2022
a b c d
e
Unweighted value by residual maturity
Weighted
value
No
maturity <6 months
6 months
to <1 year >1 year
ASF item
1 Capital $ 51,229 $ – $ – $ 5,716 $ 56,945
2 Regulatory capital 51,229 – – 5,716 56,945
3 Other capital instruments – – – – –
4 Retail deposits and deposits from small business customers 196,289 42,442 16,514 15,162 249,648
5 Stable deposits 90,973 14,797 8,203 8,515 116,788
6 Less stable deposits 105,316 27,645 8,311 6,647 132,860
7 Wholesale funding 167,997 178,412 55,348 85,742 220,115
8 Operational deposits 117,115 4,181 – – 60,648
9 Other wholesale funding 50,882 174,231 55,348 85,742 159,467
10 Liabilities with matching interdependent assets – 1,636 2,387 12,262 –
11 Other liabilities – 99,015
(1)
7,550
12 NSFR derivative liabilities 13,149
(1)
13 All other liabilities and equity not included in the above categories – 51,615 129 34,122 7,550
14 Total ASF 534,258
RSF item
15 Total NSFR HQLA 11,313
16 Deposits held at other financial institutions for operational purposes – 3,825 – 395 2,308
17 Performing loans and securities 65,278 105,413 52,671 355,651 382,621
18 Performing loans to financial institutions secured by Level 1 HQLA – 19,359 2,854 – 2,405
19 Performing loans to financial institutions secured by non-Level 1 HQLA and
unsecured performing loans to financial institutions
594 34,378 6,605 20,353 28,127
20 Performing loans to non-financial corporate clients, loans to retail and small
business customers, and loans to sovereigns, central banks and public
sector entities, of which:
34,211 37,248 27,215 118,133 162,214
21 With a risk weight of less than or equal to 35% under the Basel II
standardized approach for credit risk
– – – – –
22 Performing residential mortgages, of which: 18,669 11,468 15,761 209,618 171,829
23 With a risk weight of less than or equal to 35% under the Basel II
standardized approach for credit risk
18,669 11,392 15,677 204,508 167,406
24 Securities that are not in default and do not qualify as HQLA, including
exchange-traded equities
11,804 2,960 236 7,547 18,046
25 Assets with matching interdependent liabilities – 1,636 2,387 12,262 –
26 Other assets 12,762 99,299
(1)
44,800
27 Physical traded commodities, including gold 2,304 1,959
28 Assets posted as initial margin for derivative contracts and contributions to
default funds of central counterparties
10,581
(1)
8,994
29 NSFR derivative assets 10,897
(1)
–
30 NSFR derivative liabilities before deduction of variation margin posted 28,942
(1)
1,447
31 All other assets not included in the above categories 10,458 43,546 142 5,191 32,400
32 Off-balance sheet items 378,863
(1)
13,071
33 Total RSF $ 454,113
34 NSFR 118 %
$ millions, as at July 31, 2022
Weighted
value
35 Total ASF $ 519,356
36 Total RSF $ 443,626
37 NSFR 117 %
$ millions, as at October 31, 2021
Weighted
value
38 Total ASF $ 472,518
39 Total RSF $ 401,362
40 NSFR 118 %
(1) No assigned time period per disclosure template design.
CIBC 2022 ANNUAL REPORT 79

Management’s discussion and analysis
Our NSFR as at October 31, 2022, increased to 118% from 117% in the prior quarter and was comparable with 2021, due to an increase in long-
term funding, offset by an increase in lending in line with strategic business growth.
CIBC considers the impact of its business decisions on the LCR, NSFR and other liquidity risk metrics that it regularly monitors as part of a robust
liquidity risk management function. Variables
that can impact the metrics month-over-month include, but are not limited to, items such as wholesale
funding activities and maturities, strategic balance sheet initiatives, and transactions and market conditions affecting collateral.
Reporting of the LCR and NSFR is calibrated centrally by Treasury, in conjunction with the SBUs and other functional groups.
Funding
We fund our operations with client-sourced deposits, supplemented with a wide range of wholesale funding.
Our principal approach aims to fund our consolidated balance sheet with deposits primarily raised from personal and commercial banking
channels. We maintain
a foundation of relationship-based core deposits, whose stability is regularly evaluated through internally developed
statistical assessments.
We routinely access a range of short-term and long-term secured and unsecured funding sources diversified by geography, depositor
type, instrument, currency and maturity. We raise
long-term funding from existing programs including covered bonds, asset securitizations and
unsecured debt.
We continuously evaluate opportunities to diversify into new funding products and investor segments in an effort to maximize funding
flexibility and minimize concentration and financing costs. We regularly monitor wholesale
funding levels and concentrations to internal limits
consistent with our desired liquidity risk profile.
GALCO and RMC review and approve CIBC’s funding plan, which incorporates projected asset and liability growth, funding maturities, and
output from our liquidity position
forecasting.
The following table provides the contractual maturity profile of our wholesale funding sources at their carrying values:
$ millions, as at October 31, 2022
Less than
1 month
1–3
months
3–6
months
6–12
months
Less than
1 year total
1–2
years
Over
2 years Total
Deposits from banks
(1)
$ 1,580 $ 1,730 $ 2,459 $ 3,465 $ 9,234 $ – $ – $ 9,234
Certificates of deposit and commercial paper 10,472 12,942 20,911 21,019 65,344 477 – 65,821
Bearer deposit notes and bankers’ acceptances 398 586 394 336 1,714 – – 1,714
Senior unsecured medium-term notes
(2)
– 4,291 4,504 15,249 24,044 13,146 30,389 67,579
Senior unsecured structured notes 206 – – – 206 – 68 274
Covered bonds/asset-backed securities
Mortgage securitization – 1,230 403 2,355 3,988 2,318 10,172 16,478
Covered bonds – 1,674 697 2,080 4,451 – 21,807 26,258
Cards securitization – – – – – 1,028 2,002 3,030
Subordinated liabilities – – – – – 36 6,256 6,292
Other – – – – – – 8 8
$ 12,656 $ 22,453 $ 29,368 $ 44,504 $ 108,981 $ 17,005 $ 70,702 $ 196,688
Of which:
Secured $ – $ 2,904 $ 1,100 $ 4,435 $ 8,439 $ 3,346 $ 33,981 $ 45,766
Unsecured 12,656 19,549 28,268 40,069 100,542 13,659 36,721 150,922
$ 12,656 $ 22,453 $ 29,368 $ 44,504 $ 108,981 $ 17,005 $ 70,702 $ 196,688
October 31, 2021 $ 16,671 $ 23,696 $ 16,387 $ 36,144 $ 92,898 $ 25,488 $ 52,514 $ 170,900
(1) Includes non-negotiable term deposits from banks.
(2) Includes wholesale funding liabilities which are subject to conversion under bail-in regulations. See the “Capital management” section for additional details.
The following table provides the diversification of CIBC’s wholesale funding by currency:
$ billions, as at October 31 2022 2021
CAD $ 51.2 26 % $ 48.0 28 %
USD 103.0 52 91.5 54
Other 42.5 22 31.4 18
$ 196.7 100 % $ 170.9 100 %
We manage liquidity risk in a manner that enables us to withstand severe liquidity stress events. Wholesale funding may present a higher risk of
run-off in stress situations, and we maintain significant portfolios of unencumbered liquid assets to mitigate this risk. See the “Liquid assets” section
for additional details.
Funding plan
Our funding plan is updated at least quarterly, or in response to material changes in underlying assumptions and business developments. The plan
incorporates projected asset and liability growth from our ongoing operations, and the output from our liquidity position forecasting.
Credit ratings
Our access to and cost of wholesale funding are dependent on multiple factors, among them credit ratings provided by rating agencies. Rating
agencies’ opinions are based upon internal methodologies, and are subject to change based on factors including, but not limited to, financial
strength, competitive position, macroeconomic backdrop and liquidity positioning.
On February 22, 2022, S&P announced the following updates to our credit ratings: senior debt to A- from BBB+; subordinated indebtedness to
A- from BBB+; subordinated indebtedness – NVCC to BBB+ from BBB; LRCN – NVCC to BBB- from BB+; preferred shares – NVCC to P-2(L) from
P-3(H). These rating revisions reflect S&P’s views on improvements in our risk position.
80 CIBC 2022 ANNUAL REPORT

Management’s discussion and analysis
Our credit ratings are summarized in the following table:
As at October 31, 2022 DBRS Fitch Moody’s S&P
Deposit/Counterparty
(1)
AA AA Aa2 A+
Legacy senior debt
(2)
AA AA Aa2 A+
Senior debt
(3)
AA(L) AA- A2 A-
Subordinated indebtedness A(H) A Baa1 A-
Subordinated indebtedness – NVCC
(4)
A(L) A Baa1 BBB+
Limited recourse capital notes – NVCC
(4)
BBB(H) n/a Baa3 BBB-
Preferred shares – NVCC
(4)
Pfd-2 n/a Baa3 P-2(L)
Short-term debt R-1(H) F1+ P-1 A-1
Outlook Stable Stable Stable Stable
(1) DBRS Long-Term Issuer Rating; Fitch Long-Term Deposit Rating and Derivative Counterparty Rating; Moody’s Long-Term Deposit and Counterparty Risk Assessment
Rating; S&P’s Issuer Credit Rating.
(2) Includes senior debt issued prior to September 23, 2018 as well as senior debt issued on or after September 23, 2018 which is not subject to bail-in regulations.
(3) Comprises liabilities which are subject to conversion under bail-in regulations. See the “Capital management” section for additional details.
(4) Comprises instruments which are treated as NVCC in accordance with OSFI’s CAR Guideline.
n/a Not applicable.
Additional collateral requirements for rating downgrades
We are required to deliver collateral to certain derivative counterparties in the event of a downgrade to our current credit risk rating. The collateral
requirement is based on MTM exposure, collateral valuations, and collateral arrangement thresholds, as applicable. The following table presents the
additional cumulative collateral requirements for rating downgrades:
$ billions, as at October 31 2022 2021
One-notch downgrade $– $ 0.1
Two-notch downgrade 0.1 0.2
Three-notch downgrade 0.3 0.3
Contractual obligations
Contractual obligations give rise to commitments of future payments affecting our short- and long-term liquidity and capital resource needs. These
obligations include financial liabilities, credit and liquidity commitments, and other contractual obligations.
Assets and liabilities
The following table provides the contractual maturity profile of our on-balance sheet assets, liabilities and equity at their carrying values.
Contractual analysis is not representative of our liquidity risk exposure, however this information serves to inform our management of liquidity
risk, and provide input when modelling a behavioural balance sheet.
$ millions, as at October 31, 2022
Less than
1 month
1–3
months
3–6
months
6–9
months
9–12
months
1–2
years
2–5
years
Over
5 years
No
specified
maturity Total
Assets
Cash and non-interest-bearing deposits
with banks
(1)
$ 31,535 $ – $ – $ – $ – $ – $ – $ – $ – $ 31,535
Interest-bearing deposits with banks 32,326 – – – – – – – – 32,326
Securities 7,423 6,244 5,472 4,302 5,933 13,893 64,060 36,358 32,194 175,879
Cash collateral on securities borrowed 15,326 – – – – – – – – 15,326
Securities purchased under resale
agreements 44,040 11,997 6,180 4,175 1,481 1,340 – – – 69,213
Loans
Residential mortgages 1,943 4,077 8,099 6,528 14,214 45,804 180,672 8,369 – 269,706
Personal 1,228 552 1,047 785 790 662 3,687 5,536 31,142 45,429
Credit card 346 692 1,038 1,038 1,038 4,153 8,174 – – 16,479
Business and government 10,464 7,518 8,867 11,235 12,521 32,717 74,126 20,181 10,913 188,542
Allowance for credit losses – – – – – – – – (3,073) (3,073)
Derivative instruments 7,088 5,847 2,803 2,354 1,778 7,586 8,912 6,667 – 43,035
Customers’ liability under acceptances 10,419 1,109 2 44 – – – – – 11,574
Other assets – – – – – – – – 47,626 47,626
$ 162,138 $ 38,036 $ 33,508 $ 30,461 $ 37,755 $ 106,155 $ 339,631 $ 77,111 $ 118,802 $ 943,597
October 31, 2021 $ 133,285 $ 39,067 $ 39,932 $ 35,900 $ 31,154 $ 95,910 $ 276,311 $ 70,812 $ 115,312 $ 837,683
Liabilities
Deposits
(2)
$ 14,627 $ 33,409 $ 45,187 $ 60,217 $ 54,474 $ 31,954 $ 72,009 $ 16,238 $ 369,457 $ 697,572
Obligations related to securities sold short 15,284 – – – – – – – – 15,284
Cash collateral on securities lent 4,853 – – – – – – – – 4,853
Obligations related to securities sold under
repurchase agreements 70,976 5,332 752 – 111 – – – – 77,171
Derivative instruments 7,192 4,725 2,751 2,624 2,574 6,919 12,219 13,336 – 52,340
Acceptances 10,431 1,109 2 44 – – – – – 11,586
Other liabilities 25 57 58 77 65 311 629 949 25,946 28,117
Subordinated indebtedness – – – – – 36 – 6,256 – 6,292
Equity – – – – – – – – 50,382 50,382
$ 123,388 $ 44,632 $ 48,750 $ 62,962 $ 57,224 $ 39,220 $ 84,857 $ 36,779 $ 445,785 $ 943,597
October 31, 2021 $ 114,437 $ 58,465 $ 42,381 $ 43,224 $ 28,107 $ 40,038 $ 54,440 $ 27,969 $ 428,622 $ 837,683
(1) Cash includes interest-bearing demand deposits with the Bank of Canada.
(2) Comprises $232.1 billion (2021: $213.9 billion) of personal deposits; $443.0 billion (2021: $387.1 billion) of business and government deposits and secured borrowings;
and $22.5 billion (2021: $20.2 billion) of bank deposits.
The changes in the contractual maturity profile were primarily due to the natural migration of maturities and also reflect the impact of our regular
business activities.
CIBC 2022 ANNUAL REPORT 81

Management’s discussion and analysis
Credit-related commitments
The following table provides the contractual maturity of notional amounts of credit-related commitments. Since a significant portion of
commitments are expected to expire without being drawn upon, the total of the contractual amounts is not representative of future liquidity
requirements.
$ millions, as at October 31, 2022
Less than
1 month
1–3
months
3–6
months
6–9
months
9–12
months
1–2
years
2–5
years
Over
5 years
No specified
maturity
(1)
Total
Unutilized credit commitments $ 1,621 $ 10,058 $ 5,190 $ 5,867 $ 5,300 $ 21,483 $ 67,286 $ 2,583 $ 216,873 $ 336,261
Securities lending
(2)
44,328 4,352 4,328 – – – – – – 53,008
Standby and performance letters of credit 3,968 3,330 2,927 3,783 2,942 618 739 152 – 18,459
Backstop liquidity facilities – 11,003 1,076 604 172 – – – – 12,855
Documentary and commercial letters of
credit
59 98 21 2 1 4 24 – – 209
Other 718 – – – – – – – – 718
$ 50,694 $ 28,841 $ 13,542 $ 10,256 $ 8,415 $ 22,105 $ 68,049 $ 2,735 $ 216,873 $ 421,510
October 31, 2021 $ 49,440 $ 28,564 $ 10,516 $ 9,343 $ 7,902 $ 25,284 $ 57,866 $ 3,678 $ 188,449 $ 381,042
(1) Includes $167.3 billion (2021: $141.5 billion) of personal, home equity and credit card lines, which are unconditionally cancellable at our discretion.
(2) Excludes securities lending of $4.9 billion (2021: $2.5 billion) for cash because it is reported on the consolidated balance sheet.
Other off-balance sheet contractual obligations
The following table provides the contractual maturities of other off-balance sheet contractual obligations affecting our funding needs:
$ millions, as at October 31, 2022
(1)
Less than
1 month
1–3
months
3–6
months
6–9
months
9–12
months
1–2
years
2–5
years
Over
5 years Total
Purchase obligations
(2)
$ 111 $ 155 $ 275 $ 192 $ 162 $ 596 $ 757 $ 145 $ 2,393
Underwriting commitments 936 – – – – – – – 936
Future lease commitments
(1)
– – – – – – 72 497 569
Investment commitments – – 9 1 1 1 18 432 462
Pension contributions
(3)
19 38 57 57 57 – – – 228
$ 1,066 $ 193 $ 341 $ 250 $ 220 $ 597 $ 847 $ 1,074 $ 4,588
October 31, 2021 $ 414 $ 176 $ 221 $ 320 $ 185 $ 483 $ 735 $ 1,187 $ 3,721
(1) Excludes operating lease obligations that are accounted for under IFRS 16, which are typically recognized on the consolidated balance sheet, and operating and tax
expenses relating to lease commitments. The table includes lease obligations that are not accounted for under IFRS 16, including those related to future starting lease
commitments for which we have not yet recognized a lease liability and right-of-use asset.
(2) Obligations that are legally binding agreements whereby we agree to purchase products or services with specific minimum or baseline quantities defined at fixed,
minimum or variable prices over a specified period of time are defined as purchase obligations. Purchase obligations are included through to the termination date
specified in the respective agreements, even if the contract is renewable. Many of the purchase agreements for goods and services include clauses that would allow
us to cancel the agreement prior to expiration of the contract within a specific notice period. However, the amount above includes our obligations without regard to
such termination clauses (unless actual notice of our intention to terminate the agreement has been communicated to the counterparty). The table excludes purchases
of debt and equity instruments that settle within standard market time frames.
(3) Includes estimated minimum funding contributions for our funded defined benefit pension plans in Canada, the U.S., the U.K., and the Caribbean. Estimated minimum
funding contributions are included only for the next annual period as the minimum contributions are affected by various factors, such as market performance and
regulatory requirements, and are therefore subject to significant variability.
Other risks
Strategic risk
Strategic risk is the risk of ineffective or improper implementation of business strategies, including mergers, acquisitions and divestitures. It includes
the potential financial loss due to the failure of organic growth initiatives or failure to respond appropriately to changes in the business environment.
For additional details on corporate transactions, see the “Top and emerging risks” section.
Oversight of strategic risk is the responsibility of the ExCo and the Board. At least annually, the CEO outlines the process and presents the
strategic business plan to the Board for review and approval. As part of the annual planning process, Risk Management assesses the overall
and
business unit strategic plans to ensure alignment with our risk appetite. The Board reviews the plan in light of management’s assessment of
emerging market trends, the competitive environment, potential risks and other key issues.
One of the tools for measuring, monitoring and controlling strategic risk is attribution of regulatory capital against this risk. Our regulatory capital
models include a strategic risk component for those businesses utilizing capital to fund an acquisition or a significant organic growth strategy.
Operational risk
Operational risk is the risk of loss resulting from people, inadequate or failed internal processes and systems, or from external events.
Operational risk is inherent in all CIBC activities and transactions. Failure to manage operational risk can result in direct or indirect financial loss,
reputational impact, or regulatory review and penalties. The Operational Risk Management Framework
(the Framework) sets out the
requirements and roles and responsibilities in managing operational risk at CIBC.
Governance and Management
Operational risk is managed through the three lines of defence model and articulated in the Operational Risk Management Framework. A strong risk
culture and communication between the three lines of defence are important characteristics of effective risk management. All three lines of defence,
including all team members are accountable for identifying, managing and mitigating operational risk within the approved Operational Risk Appetite.
For further details, refer to the “Management of risk – Risk overview” section.
Global Operational Risk Management (GORM) is responsible for oversight of the enterprise-wide operational risk and control environment globally.
To effectively discharge its mandate, GORM establishes frameworks, policies, related procedures and guidelines, and develops tools, systems and
processes to enable effective identification, measurement,
mitigation, monitoring and reporting of operational risks. GORM is also responsible for
determining the level of operational risk capital in compliance with OSFI’s guidelines. From a governance perspective, the ORCC, chaired by the
Senior Vice-President, GORM, is a forum for senior management, with representation from each of the three lines of defence, to monitor and discuss
significant operational risk and control matters. ORCC is a sub-committee of the GRC. GRC, chaired by the CRO, is a senior management forum for
discussion and oversight of risk appetite, risk profile and risk mitigation strategies.
82 CIBC 2022 ANNUAL REPORT

Management’s discussion and analysis
Operational risk management approach
Information transparency, timely escalation, clear accountability and a robust internal control environment are the principles forming the basis of the
Operational Risk Management Framework, which supports and governs the processes of identifying, measuring, mitigating, monitoring, and
reporting operational risks. We mitigate operational losses by consistently applying risk-based approaches and employing risk-specific assessment
tools. Regular review of our risk governance structure ensures clarity of, and ownership in, key risk areas.
Risk identification
Risk identification includes the process of assessing, understanding and confirming risks, on Business Unit operations, transactions, change
initiatives and emerging risks to ensure operational risks are proactively identified and managed. CIBC’s business lines regularly conduct reviews of
operational risks inherent in their products, services or processes and assess ways to mitigate and manage them in alignment with CIBC’s risk
appetite. These reviews include using risk and control self-assessments, audit findings, operational risk scenarios, past internal and external loss
events, key risk indicators (KRIs) trends, change initiative risk assessments and in-depth risk reviews to form a holistic operational risk profile for the
business lines. Under the three lines of defence model, GORM and relevant Control Groups challenge business lines’ risk assessments and
mitigation actions.
Risk measurement
Risk measurement is the quantification of operational risks through operational risk capital calculations, internal loss data collection and analysis,
and stress testing to understand potential operational risk exposures.
Operational loss is one of the key operational risk metrics informing us of areas of heightened risk. We collect and analyze internal operational
loss event data for themes and trends. The occurrence of a material or potential material loss triggers an investigation to determine the root causes
of the incident and the effectiveness of existing mitigating controls, as well as the identification of any additional mitigating actions. Additionally, we
monitor the external environment for emerging or potential risks to CIBC. The analysis of material operational risk events is performed by the first line
of defence and the outputs of the analysis are subject to formal independent challenge by our second line of defence. The analysis of material
operational risk events forms one component of our ongoing operational risk reporting to senior management and the Board.
A robust risk measurement practice is in place to quantify operational risk and ensure adequate capital. We use the standardized method to
quantify our operational risk exposure in the form of operational risk regulatory capital, as agreed with local regulators.
Risk mitigation
Risk mitigation is the determination of appropriate strategies and development of action plans to address operational risks to ensure residual risks
are within the CIBC risk appetite. Our primary tool for mitigating operational risk exposure is a robust internal control environment. Our Control
Framework outlines key principles, structure and processes underpinning our approach to managing risks through effective controls. Under our
framework, all key controls are subject to ongoing testing and review to ensure they effectively mitigate our operational risk exposures. In addition,
our corporate insurance program may afford additional protection from loss while our global business continuity and broader operational resilience
programs enable us to deliver critical services to our clients through disruption.
Risk monitoring and reporting
Risk monitoring and reporting ensures that operational risk issues, including emerging risks, are monitored and communicated to the relevant
stakeholders in a timely and transparent manner.
Both forward-looking KRIs as well as backward-looking key performance indicators provide insight into our risk exposure and are used to
monitor the main drivers of exposure associated with key operational risks and their adherence to the operational risk appetite. KRIs assist in early
detection of potential operational risk events by identifying unfavourable trends and highlighting controls that may not be designed or operating
effectively. Business lines are required to identify and implement KRIs for material risk exposures on an ongoing basis. Escalation triggers are used
to highlight risk exposures requiring additional attention from senior management and/or the Board. The second line of defence challenges the
selection of KRIs and the appropriateness of thresholds.
Our risk monitoring processes support a transparent risk-reporting program, informing both senior management and the Board of our control
environment, operational risk exposures, and mitigation strategies. Operational risk practices are continuously enhanced to increase robustness of
the operational risk management program for effective and efficient identification, measurement, mitigation, monitoring and reporting of operational
risks in CIBC.
Operational risks which may adversely impact CIBC include the following:
Anti-money laundering/anti-terrorist financing
The risk of CIBC’s potential non-conformance with global AML and ATF regulatory requirements and sanctions regulations leading to enhanced
regulatory scrutiny, regulatory censure (i.e., cease and desist orders) and/or financial loss (i.e., regulatory, criminal or civil penalties and/or forfeiture
of assets). See “Anti-money laundering” in the “Top and emerging risks” section for further details.
Fraud risk
The risk relating to the intentions to defraud, misappropriate property/assets or circumvent regulations, the law or CIBC policy and can be
committed by either employees or by outsiders such as clients or third parties.
Information security risk (including cyber security)
The risk to the confidentiality, integrity and availability of CIBC-owned information, and the information entrusted to CIBC by clients, employees,
shareholders, business partners, and third parties that if leaked, accessed without authorization or lost, could cause damage to CIBC’s business
and its customers. See “Technology, information and cyber security risk” in the “Top and emerging risks” section for further details.
Technology risk
The risk of compromised availability, degradation, recovery, capacity, performance, integrity of new or existing systems. See “Technology,
information and cyber security risk” in the “Top and emerging risks” section for further details.
CIBC 2022 ANNUAL REPORT 83

Management’s discussion and analysis
Third party risk
The potential risk that may arise from relying on a third party business arrangement between CIBC and another entity, by contract or otherwise. This
includes activities that involve outsourced products and services, use of outside consultants, networking arrangements, managed services, services
provided by affiliates and subsidiaries, joint ventures, sponsorships, no-fee contracts, and any other arrangement that involves the delivery of
business activities, functions or processes to CIBC and/or its clients. See “Third-party risk” in the “Top and emerging risks” section for further
details.
Other operational risks include business interruption risk, data risk, conduct risk (see the “Conduct risk” section), financial reporting risk, legal risk
(see the “Reputation and legal risks” section), model risk, people risk, privacy risk, project risk, physical security and safety risk, regulatory
compliance risk (see the “Regulatory compliance risk” section) and transaction processing and execution risk.
Environmental and social risk
Environmental and social risk is the risk of financial loss or damage to reputation associated with environmental and social issues, whether arising
from our credit and investment activities or related to our own operations. These risks can include but are not limited to topics such as climate
change, biodiversity, racial inequality, and modern slavery.
Governance
As environmental and social risk management requires a multi-disciplinary approach, these risk factors are considered in our ESG Governance
Framework, which defines responsibility for ESG from the Board down to those with day-to-day accountability for execution.
CIBC’s Board and its committees provide ongoing oversight of our bank-wide ESG framework, each playing a distinct, but integrated role. The
Corporate Governance Committee leads oversight of our ESG strategy, and in this capacity considers external challenges, trends and
developments that should be incorporated in our strategic plans. Other Board committees lead the oversight of specific elements of our ESG
strategy based on mandate, and as it pertains to environmental and social risks; in particular, the Risk Committee supervises key frameworks
related to CIBC’s principal business risks, which include climate-related risks, and the Audit Committee has oversight of the underlying processes
and controls of the ESG disclosures in our Annual Report and our Sustainability Report.
At the senior management level, our Executive Committee is accountable for the progress on CIBC’s ESG agenda, and the Executive Vice-
President and Chief Legal Officer (CLO) is the executive horizontal owner of ESG across the enterprise, which includes leading our ESG strategy
and ESG Governance Framework. In this capacity, the CLO also works closely with our CRO, who has overall responsibility for enterprise risk
management. Executive management of ESG is also facilitated through CIBC’s Senior Executive ESG Council, which is chaired by the Executive
Vice-President and Chief Legal Officer, and has representation from all SBUs and functional groups, enabling bank-wide input and coordination on
strategic ESG initiatives in response to CIBC’s environmental and social responsibilities. Our Enterprise ESG team, which reports to the CLO, works
alongside the SBUs, functional groups and ESG subject matter experts across the bank, such as the Environmental Risk team within Enterprise Risk
Management, to advance CIBC’s ESG agenda.
Understanding that environmental and social topics and related risks are evolving, we have regular, two-way engagement with our
stakeholders and continuously assess and engage on other environmental and social issues through partnerships and industry initiatives. This helps
to ensure that we have a common understanding of this risk area and are prepared to respond. Beyond the risks listed below, we are learning and
contributing to emerging topics such as biodiversity and the circular economy, through participation in the Taskforce on Nature-related Financial
Disclosures Forum and Circular Economy Leadership Canada, respectively, and helping to transform financial decision making to better integrate
risks posed by environmental and social issues through participation in A4S (Accounting for Sustainability).
Risk management
Within CIBC’s Risk Management function, the Enterprise Risk Management group provides independent oversight of the measurement, monitoring
and control of environmental risks. This group is led by the Senior Vice-President, Enterprise Risk Management, who has direct accountability to the
CRO for environmental risk oversight. This team works closely with the Enterprise ESG team, to ensure that climate and related social risks are
integrated into our ESG strategy, as well as with the SBUs and functional groups to ensure that best practices of environmental responsibility are
applied to the banking services that we provide to our clients, the relationships we have with our stakeholders, and to the way we manage our
facilities.
Our corporate environmental policy describes our approach to prudent environmental management, including climate-related issues, and
assigns responsibilities for managing our environmental impacts and is under the overall management of the Environmental Risk team. Our policy
states that CIBC will develop, implement and maintain standards and procedures to review, assess and manage the environmental risks inherent in
lending and investment activities and seek through such activities to promote sound environmental management practices among those with whom
business is conducted. For example, environmental and related social evaluations are integrated into our credit risk assessment processes, with
standards and procedures in place for all sectors. In addition, environmental and related social risk assessments in project finance, project-related
corporate loans and bridge loans are required, in accordance with our commitment to the Equator Principles (adopted in 2003), which are a
voluntary set of guidelines for financial institutions based on the screening criteria from the International Finance Corporation. An escalation process
is in place for transactions with the potential to have significant environmental and related social risk, with escalation up to the Reputation and Legal
Risks Committee for senior executive review, if required.
Social risks, which may not be related to environmental risks, such as child labour or human rights violations, are a component of reputation
and legal risks. Social risk is therefore assessed and mitigated according to the policies and related procedures followed for managing reputation
and legal risks, including through the Reputation Risk Management Framework, Global Reputation and Legal Risks Policy and business-specific
procedures. See the “Reputation and legal risks” section for additional information.
Climate change
Climate risk is integrated into our risk management processes, beginning with our climate-related risk appetite, which is defined based on
qualitative considerations and reflects our guiding principle of practicing sound risk management, as well as enabling us to address stakeholders’
expectations with respect to climate risk management. We are currently focused on defining quantitative climate-related risk appetite statement
measures, and to achieve this, we are developing different options to incorporate relevant risk appetite metrics and tolerance levels.
We are actively identifying and assessing climate-related risks and how they might impact business operations, cause physical damage,
disrupt supply chains and affect global economies, and ultimately impact credit and market risk. To do this, we are continuing to develop a suite of
tools including carbon risk scoring, heat maps, scenario analysis and measuring financed emissions to give us insights into the risks at a client,
sector and portfolio level, as there is not one individual tool that can adequately measure the risks that our clients face due to climate change.
84 CIBC 2022 ANNUAL REPORT

Management’s discussion and analysis
Our carbon risk scoring considers the short, medium and long-term impacts that a corporate or commercial client might face due to climate
change such as policy, technology and market shifts. It allows us to score each client on a scale of advanced to poor, referring those clients that
score poorly to our High Carbon Score Committee to develop appropriate action plans to mitigate the risk.
Our heat map approach also provides a visual representation of the business and government sectors that are vulnerable to climate-related
risks. Based on this heat map assessment, we assign a score to each industry and sector within our portfolio based on general exposure to physical
and transition risks. The combined weighted average score is used to infer potential credit migrations which is used as an input into scenario
analysis to estimate potential changes in PD, expected loss and RWA. The latter is based on the Bank of Canada and OSFI pilot scenario and
provides a useful “what-if” framework to explore how climate-related risks may manifest in the future.
These risk management tools provide us with a higher level of granularity to understand how our individual portfolios behave with regard to
climate-related risks and where to focus mitigation efforts, as well as informing business decisions towards potential opportunities and areas where
we can support our clients. We will continue expanding our knowledge and exploring and assessing climate-related risk impacts as industry
standards, the regulatory environment, data quality, tools and our approach mature.
Human rights and codes of conduct
CIBC is committed to respecting human rights and stands against slavery and human trafficking throughout our business and supply chains.
We uphold human rights by incorporating global best practices enterprise-wide, including those embodied by the United Nations Guiding
Principles on Business and Human Rights, and promoting a fair, diverse and inclusive work environment. We comply with all applicable human
rights laws and standards in the jurisdictions in which we operate, including laws addressing issues such as pay equity, employment equity, health
and safety, discrimination and harassment. We expect our team members, clients, suppliers and other third parties with whom we have a business
relationship to share our commitment to respect human rights. More information can be found in the CIBC on Human Rights: Modern Slavery and
Human Trafficking Statement, which is available on our website.
CIBC’s Code of Conduct is an important reference point in our culture and also lays out the standards we have in place for how team members
should behave and treat our clients, communities and fellow team members. The Code of Conduct sets out underlying policies that guide our
actions that are foundational to our purpose-led and inclusive culture as we grow in a sustainable way. This includes acting with honesty, integrity
and respect. To maintain appropriate conduct and address inappropriate conduct, we use an integrated framework of programs, standards,
policies, guidelines and procedures that all align with the high-level principles and ethical standards set out in our Code of Conduct. See the
“Conduct risk” section for additional information.
Our Supplier Code of Conduct sets out the principles, standards and behaviours that our suppliers must follow, as we expect that they act
ethically and adhere to all applicable laws, rules and regulations, such as maintaining responsible labour practices and human rights, in the
jurisdictions in which they operate. We have procedures in place to assess supplier risk and to govern our contracted supplier relationships. Due
diligence reviews of new, existing and prospective suppliers require consideration of applicable ESG factors in order to mitigate these potential
risks within our supply chain.
More information on our ESG governance, policy, management and performance can be found in our Sustainability Report, which is available
on our website.
Regulatory compliance risk
Regulatory compliance risk is the risk of CIBC’s potential non-conformance with applicable regulatory requirements.
Our regulatory compliance philosophy is to manage and mitigate regulatory compliance risk through the promotion of a strong risk culture
within the parameters established by CIBC’s Risk Appetite Statement. The foundation of this approach is a comprehensive Regulatory
Compliance Management (RCM) framework. The RCM framework, owned by the Senior Vice-President, Chief Compliance Officer and Global
Regulatory Affairs, and approved by the RMC, maps regulatory requirements to internal policies, procedures and/or controls that govern
regulatory compliance.
Our Compliance department is responsible for the development and maintenance of a comprehensive regulatory compliance program,
including oversight of the RCM framework. This department is independent of business management and regularly reports to the RMC.
Primary responsibility for compliance with all applicable regulatory requirements rests with senior management of the business and
functional groups, and extends to all employees. The Compliance department’s activities support those groups, with particular emphasis on
regulatory requirements that govern the relationship between CIBC and its clients.
See the “Regulatory developments” section for further details.
Insurance risk
Insurance risk is the risk of loss arising from the obligation to pay out benefits and expenses on insurance policies in excess of expected amounts.
Unfavourable actual experience could emerge due to adverse fluctuations in timing, size and frequency of actual claims (e.g., mortality, morbidity),
policyholder behaviour (e.g., cancellation of coverage), or associated expenses.
Insurance contracts provide financial compensation to the beneficiary in the event of an insured risk occurring in exchange for premiums. We
are exposed to insurance risk in our life insurance business and in our reinsurance business within the respective subsidiaries.
Senior management of the insurance and reinsurance subsidiaries have primary responsibility for managing insurance risk with oversight by Risk
Management. The insurance and reinsurance subsidiaries also have their own boards of directors, and an independent Appointed Actuary who provide
additional input to risk management oversight. Processes and oversight are in place to manage the risk to our insurance business. Underwriting risk on
business assumed is managed through risk policies that limit exposure to an individual life, to certain types of business and to regions.
Our risk governance practices ensure strong independent oversight and control of risk within the insurance businesses. The subsidiaries’ boards
outline the internal risk and control structure to manage insurance risk, which includes risk, capital and control policies, processes as well as limits and
governance. Senior management of the insurance and reinsurance subsidiaries and Risk Management attend the subsidiaries’ board meetings.
CIBC 2022 ANNUAL REPORT 85

Management’s discussion and analysis
Reputation and legal risks
Our reputation and financial soundness are of fundamental importance to us and to our clients, shareholders, third parties, regulators, team
members and communities.
Reputation risk is the risk of negative publicity regarding our business conduct or practices which, whether true or not, could significantly
harm our reputation as a leading financial institution, or could materially and adversely affect our business, operations or financial condition.
Legal risk is the risk of financial loss arising from one or more of the following factors: (a) civil, criminal or regulatory enforcement
proceedings against us; (b) our failure to correctly document, enforce or comply with contractual obligations; (c) failure to comply with our legal
obligations to clients, investors, team members, counterparties or other stakeholders; (d) failure to take appropriate legal measures to protect
our assets or security interests; or (e) misconduct by our team members or agents.
All team members at CIBC play an important role in protecting our reputation by ensuring that the highest ethical standards are followed in
how we act and what we do. Not only must we act with integrity at all times, we must also ensure that activities being conducted do not pose
undue risks to CIBC’s reputation for ethical, sound and responsible business practices. As a result, requirements for the management and
oversight of potential reputation risk are integrated throughout our framework of policies and related procedures. These processes include the
management of various risks as set out in CIBC’s Risk Appetite Statement, Risk Management Framework and Code of Conduct. Our Reputation
Risk Management Framework, Global Reputation and Legal Risks Policy and business-specific procedures outline how we safeguard our
reputation through identification, assessment, escalation and mitigation of potential reputation and legal risks. Proactive management of potential
reputation and legal risks is a key responsibility of CIBC and all our team members.
Overall governance and oversight of reputation risk is provided by the Board, primarily through the RMC of the Board. Senior management
oversight of reputation and legal risks is provided by the Reputation and Legal Risks Committee, which is a sub-committee of GRC and reports
its activities regularly to the GRC. Additionally, there are specific senior management committees across the enterprise that provide further
oversight to ensure required practices are followed and any material reputation and legal risks are identified, managed, and if required,
escalated, effectively.
Conduct risk
Conduct risk is the risk that the actions or omissions (i.e., behaviour) of CIBC, team members or third parties: do not align with our desired
culture and values; deliver poor or unfair outcomes for clients, team members or shareholders; result in adverse market practices and outcomes;
impact CIBC’s reputation as a leading financial institution; or materially and adversely affect our business, operations or financial condition.
Our Conduct and Culture Risk Framework applies enterprise-wide and outlines how we manage conduct risk through the proactive
identification, measurement and management of potential conduct risk. Every team member is accountable for the identification and
management of conduct risk. The overarching principles and requirements for maintaining appropriate conduct and addressing inappropriate
conduct are covered in the CIBC Code of Conduct (the Code) and other global, regional and business specific policies, frameworks, processes
and procedures. All team members must abide by the Code, and CIBC policies, frameworks, processes and procedures in carrying out the
accountabilities of their role. Overall governance of conduct risk is provided by the Board and its committees, including the CGC, as well as
senior management committees.
86 CIBC 2022 ANNUAL REPORT

Management’s discussion and analysis
Accounting and control matters
Critical accounting policies and estimates
The consolidated financial statements of CIBC have been prepared in accordance with IFRS as issued by the International Accounting Standards
Board (IASB). These consolidated financial statements also comply with Section 308(4) of the Bank Act (Canada) and the requirements of OSFI. A
summary of significant accounting policies is presented in Note 1 to the consolidated financial statements.
Certain accounting policies require us to make judgments and estimates, some of which relate to matters that are uncertain. As discussed in
the “Economic and market environment” section, there are elevated levels of uncertainty related to the impact that rising interest rates, inflation and
supply chain disruptions exacerbated by geopolitical events and the measures imposed in some countries to combat the spread of COVID-19, will
have on the macroeconomic environment. These challenges continue to give rise to heightened uncertainty as it relates to our critical accounting
estimates and increases the need to apply judgment in evaluating the economic and market environment and its impact on significant estimates.
Changes in the judgments and estimates required in the critical accounting policies discussed below could have a material impact on our financial
results. We have established control procedures to ensure accounting policies are applied consistently and processes for changing methodologies
are well controlled.
Use and classification of financial instruments
As a financial institution, our assets and liabilities primarily comprise financial instruments, which include deposits, securities, loans, derivatives,
acceptances, repurchase agreements, and subordinated indebtedness.
We use these financial instruments for both trading and non-trading activities. Trading activities primarily include the purchase and sale of
securities and metals, transacting in foreign exchange and derivative instruments in the course of facilitating client trades and taking proprietary
trading positions with the objective of income generation. Non-trading activities generally include the business of lending, investing, funding, and
ALM.
The use of financial instruments may either introduce or mitigate exposures to market, credit and/or liquidity risks. See the “Management of
risk” section for details on how these risks are managed.
Financial instruments are accounted for according to their classification. Judgment is applied in determining the appropriate classification of
financial instruments under IFRS 9, in particular as it relates to the assessment of whether debt financial assets meet the solely payment of principal
and interest (SPPI) test, and the assessment of the business model used to manage financial assets. For details on the accounting for these
instruments under IFRS 9, see Note 1 to the consolidated financial statements.
Determination of fair value of financial instruments
Under IFRS 9, debt and equity securities mandatorily measured and designated at FVTPL, business and government loans mandatorily measured
and designated at FVTPL, obligations related to securities sold short, derivative contracts, FVOCI securities and FVO financial instruments are
carried at fair value. FVO financial instruments include certain debt securities, certain secured borrowings, obligations related to securities sold
under repurchase agreements, structured deposits and business and government deposits. Retail mortgage interest rate commitments are also
designated as FVO financial instruments.
IFRS 13 defines fair value to be the price that would be received to sell an asset or paid to transfer a liability at the measurement date in an
orderly arm’s-length transaction between market participants in the principal market under current market conditions (i.e., the exit price). Fair value
measurements are categorized into levels within a fair value hierarchy based on the nature of the valuation inputs (Level 1, 2 or 3). We have an
established and documented process for determining fair value. Fair value is based on unadjusted quoted prices in an active market for the same
instrument, where available (Level 1). If active market prices or quotes are not available for an instrument, fair value is then based on valuation
models in which the significant inputs are observable (Level 2) or in which one or more of the significant inputs are non-observable (Level 3).
Estimating fair value requires the application of judgment. The type and level of judgment required is largely dependent on the amount of
observable market information available.
For instruments valued using internally developed models that use significant non-observable market inputs and are therefore classified within
Level 3 of the hierarchy, the judgment used to estimate fair value is more significant than when estimating the fair value of instruments classified
within Levels 1 and 2. To ensure that valuations are appropriate, a number of policies and controls are in place, including independent validation of
valuation inputs to external sources such as exchange quotes, broker quotes or other management-approved independent pricing sources.
The following table presents amounts, in each category of financial instruments, which are valued using valuation techniques based on Level 3
inputs.
For further details of the valuation of and sensitivity associated with Level 3 financial assets and liabilities, see Note 2 to the consolidated
financial statements.
$ millions, as at October 31 2022 2021
Level 3 Total
(1)
Level 3 Total
(1)
Assets
Securities mandatorily measured and designated at FVTPL and loans mandatorily measured at FVTPL $ 1,194 1.7 % $ 1,099 1.1 %
Debt securities measured at FVOCI and equity securities designated at FVOCI 161 0.3 392 0.7
Derivative instruments 67 0.2 97 0.3
$ 1,422 0.8 % $ 1,588 0.8 %
Liabilities
Deposits and other liabilities
(2)
$ 409 1.5 % $ 742 3.8 %
Derivative instruments 1,586 3.0 267 0.8
$ 1,995 2.0 % $ 1,009 1.3 %
(1) Represents the percentage of Level 3 assets and liabilities over total assets and liabilities for each reported category that are carried on the consolidated balance sheet at
fair value.
(2) Includes FVO deposits and bifurcated embedded derivatives.
Note 2 to the consolidated financial statements presents the valuation methods used to determine fair value showing separately those financial
instruments that are carried at fair value on the consolidated balance sheet and those that are not.
In order to reflect the observed market practice of pricing collateralized and uncollateralized derivatives, our valuation approach uses
overnight indexed swap curves as the discount rate in the valuation of collateralized derivatives and market cost of funding in the valuation of
CIBC 2022 ANNUAL REPORT 87

Management’s discussion and analysis
uncollateralized derivatives. The use of a market cost of funds curve reduces the fair value of uncollateralized derivative assets incremental to the
reduction in fair value for credit risk already reflected through the CVA. In contrast, the use of a market cost of funds curve reduces the fair value of
uncollateralized derivative liabilities in a manner that generally includes adjustments for our own credit. As market practices continue to evolve in
regard to derivative valuation, further adjustments may be required in the future.
Fair value adjustments
We apply judgment in establishing valuation adjustments that take into account various factors that may have an impact on the valuation of financial
instruments that are carried at fair value on the consolidated balance sheet. Such factors include, but are not limited to, the bid-offer spread,
illiquidity due to lack of market depth and other market risks, parameter uncertainty, model risk, and credit risk.
The establishment of fair value adjustments involves estimates that are based on accounting processes and judgments by management. We
evaluate the adequacy of the fair value adjustments on an ongoing basis. The level of fair value adjustments could change as events warrant and
may not reflect ultimate realizable amounts.
As at October 31, 2022, the total valuation adjustments related to financial instruments carried at fair value on the consolidated balance sheet
was $326 million (2021: $270 million), primarily related to credit risk, bid-offer spreads, and parameter uncertainty of our derivative assets and
liabilities, as well as adjustments recognized for valuing our uncollateralized derivative assets and liabilities based on an estimated market cost of
funds curve.
Impairment of financial assets
Under IFRS 9, we establish and maintain ECL allowances for all debt instrument financial assets classified as amortized cost or FVOCI. In addition,
the ECL allowances apply to loan commitments and financial guarantees that are not measured at FVTPL.
ECL allowances represent credit losses that reflect an unbiased and probability-weighted amount that is determined by evaluating a range of
possible outcomes, the time value of money and reasonable and supportable information about past events, current conditions and forecasts of
future economic conditions. One of the objectives of IFRS 9 is to record lifetime losses on all financial instruments that have experienced a
significant increase in credit risk since their initial recognition. As a result, ECL allowances are measured at amounts equal to either: (i) 12-month
ECL; or (ii) lifetime ECL for those financial instruments that have experienced a significant increase in credit risk since initial recognition or when
there is objective evidence of impairment.
Key drivers of expected credit loss
The ECL impairment requirements of IFRS 9 require that we make judgments and estimates related to matters that are uncertain. In particular, the
ECL requirements of IFRS 9 incorporate the following elements that are subject to a high level of judgment:
• Determining when a significant increase in credit risk of a loan has occurred;
• Measuring both 12-month and lifetime credit losses; and
• Forecasting forward-looking information for multiple scenarios and determining the probability weighting of each scenario.
In addition, the interrelationship between these elements is also subject to a high degree of judgment. Changes in the judgments and estimates
related to IFRS 9 can have a significant impact on the level of ECL allowance recognized and the period-over-period volatility of the provision for
credit losses. Changes in a particular period could have a material impact on our financial results.
We continue to operate in an uncertain macroeconomic environment. While improvements in our economic outlook resulted in a moderate
reduction in our stage 1 and stage 2 performing ECLs during the three months ended January 31, 2022, a worsening of our economic outlook during
the nine months ended October 31, 2022 resulted in a moderate increase in our stage 1 and stage 2 performing ECLs. There is inherent uncertainty
in estimating the impact that rising interest rates, inflation and supply chain disruptions exacerbated by the measures imposed in some countries to
combat the spread of COVID-19 and geopolitical events, will have on the macroeconomic environment. As a result, a heightened level of judgment in
estimating ECLs in respect of all these elements as discussed above, continued to be required. Actual results could differ from these estimates and
assumptions. See Note 5 to our consolidated financial statements for more information concerning the high level of judgment inherent in the
estimation of ECL allowance under IFRS 9.
Use of the regulatory framework
Our ECL model leverages the data, systems and processes that are used to calculate Basel expected losses regulatory adjustments for the portion
of our portfolios under the AIRB approach. Significant judgment is applied in making appropriate adjustments to the Basel parameters to meet
IFRS 9 requirements, including the conversion of through-the-cycle and downturn parameters used in the Basel regulatory calculations to
point-in-time parameters used under IFRS 9 that consider forward-looking information. In addition, credit losses under IFRS 9 are 12 months for
stage 1 financial instruments and lifetime for stage 2 and stage 3 financial instruments, compared to 12 months for AIRB portfolios under Basel.
The main adjustments necessary to Basel risk parameters are explained in the table below:
Regulatory Capital IFRS 9
PD
Through-the-cycle PD represents
long-run average PD
throughout a full economic cycle
Point-in-time 12-month or lifetime PD based on current conditions
and relevant forward-looking assumptions
LGD Downturn LGD based on losses that would be expected in an
economic downturn and subject to certain regulatory floors
Discounted using the cost of capital
Unbiased probability-weighted LGD based on estimated LGD
including impact of relevant forward-looking assumptions such as
changes in collateral value
Discounted using the original effective interest rate
EAD
Based on the
drawn balance plus expected utilization of any
undrawn portion prior to default, and cannot be lower than the
drawn balance
Amortization and repayment of principal and interest from the
balance sheet date to the default date is also captured
Other ECL is discounted from the default date to the reporting date
Attribution of provision for credit losses
We recognize provision for credit losses on both impaired (stage 3) and performing (stages 1 and 2) loans in the respective SBUs. Provision for
credit losses recognized directly on our consolidated statement of income is in respect to financial instruments classified as loans and bankers’
88 CIBC 2022 ANNUAL REPORT

Management’s discussion and analysis
acceptances. Provision for credit losses for FVOCI debt securities and amortized cost securities are recognized in Gains (losses) from debt
securities measured at FVOCI and amortized cost, net in the consolidated statement of income.
Hedge accounting
The IFRS 9 hedge accounting guidance is intended to better align the accounting with risk management activities. However, IFRS 9 allows the
existing hedge accounting requirements under IAS 39 to continue in place of the hedge accounting requirements under IFRS 9. As permitted, we
previously elected to not adopt the IFRS 9 hedge accounting requirements and instead retained the IAS 39 hedge accounting requirements. As
required, we have adopted the hedge accounting disclosure requirements under amendments to IFRS 7 that were effective in 2018. As a result of
interest rate benchmark reform, we have adopted “Interest Rate Benchmark Reform: Amendments to IFRS 9, IAS 39 and IFRS 7” (Phase 1
amendments) issued by the IASB as of November 1, 2019, and adopted “Interest Rate Benchmark Reform: Phase 2 Amendments to IFRS 9, IAS 39,
IFRS 7, IFRS 4, and IFRS 16” (Phase 2 amendments) as of November 1, 2020. See “Reforms to interest rate benchmarks” in the “Other regulatory
developments” section for more information.
Securitizations and structured entities
Securitization of our own assets
Under IFRS 10 “Consolidated Financial Statements” (IFRS 10), judgment is exercised in determining whether an investor controls an investee
including assessing whether the investor has: (i) power over the investee; (ii) exposure, or rights, to variable returns from its involvement with the
investee; and (iii) the ability to affect those returns through its power over the investee. Power may be exercised through voting or similar rights or, in
the case of SEs, through contractual arrangements that direct the relevant activities of the investee. When voting rights are not relevant in deciding
whether CIBC has power over an entity, particularly for complex SEs, the assessment of control considers all facts and circumstances, including the
purpose and design of the investee, its relationship with other parties and each party’s ability to make decisions over significant activities, and
whether CIBC is acting as a principal or as an agent.
We sponsor several SEs that have purchased and securitized our own assets including Cards II Trust, which we consolidate under IFRS 10.
We also securitize our own mortgage assets through a government-sponsored securitization program. We sell these securitized assets to a
government-sponsored securitization vehicle that we do not consolidate, as well as to other third parties. IFRS 9 provides guidance on when to
derecognize financial assets. A financial asset is derecognized when the contractual rights to receive cash flows from the asset have expired, or
when we have transferred the rights to receive cash flows from the asset such that:
• We have transferred substantially all the risks and rewards of the asset; or
• We have neither transferred nor retained substantially all the risks
and rewards of the asset, but have transferred control of the asset.
We have determined that our securitization activities related to residential mortgages and cards receivables are accounted for as secured
borrowing transactions because we have not met the aforementioned criteria.
Securities lending and repurchase transactions generally do not result in the transfer of substantially all the risks and rewards of the securities
and as a result do not result in derecognition of the securities.
We also sell certain U.S. commercial mortgages to third parties that qualify for derecognition because we have transferred substantially all the
risks and rewards of the mortgages and have no continuous
involvement after the transfer.
Securitization of third-party assets
We also sponsor several SEs that purchase pools of third-party assets. We consider a number of factors in determining whether CIBC controls these
SEs. We monitor the extent to which we support these SEs, through direct investment in the debt issued by the SEs and through the provision of
liquidity protection to the other debtholders, to assess whether we should consolidate these entities.
IFRS 10 also requires that we reconsider our consolidation assessment if facts and circumstances relevant to the entities indicate that there are
changes to one or
more of the three elements of control described above. Factors that trigger reassessment include, but are not limited to,
significant changes in ownership structure of the entities, changes in contractual or governance arrangements, provision of a liquidity facility beyond
the original terms, transactions with the entities that were not contemplated originally and changes in the financing structure of the entities.
Specifically, in relation to our multi-seller conduits, we would reconsider our consolidation assessment if our level of interest in the ABCP issued
by the conduits changes
significantly, or in the rare event that the liquidity facility that we provide to the conduits is drawn or amended.
A significant increase in our holdings of the outstanding commercial paper issued by the conduits would become more likely in a scenario in
which the market for bank-sponsored ABCP suffered a significant deterioration such that the conduits were unable to roll their ABCP.
For additional information on the securitizations of our own assets and third-party assets, see the “Off-balance sheet arrangements” section
and Note 6 to the consolidated financial statements.
Leases
As a lessee, we recognize a right-of-use asset and a corresponding lease liability based on the present value of future lease payments, less any
lease incentives receivable, when the lessor makes the leased asset available for use to CIBC. We apply judgment in determining the appropriate
lease term, which is based on the non-cancellable portion of the lease term, adjusted for any renewal or termination options that are reasonably
certain to be exercised. In accounting for the lease, we also determine the appropriate discount rates based on the rate implicit in the lease, if
determinable, or on CIBC’s incremental borrowing rate.
As an intermediate lessor, we apply judgment to classify a sublease as an operating or finance sublease based on whether substantially all of
the risks and rewards related to the underlying right-of-use asset are transferred to the sub-lessee. If classified as a finance sublease, the related
right-of-use asset is derecognized and an investment in sublease is recognized based on the head lease discount rate unless the rate implicit in the
sublease is determinable. Where a finance sublease includes lease and non-lease components, we allocate the total consideration in the contract to
each component based on our estimation of the standalone prices for each of these components. The investment in sublease is subsequently
measured using the effective interest rate method, with interest income recognized over the term of the sublease. Rental income from operating
subleases is recognized on a systematic basis over the lease term. For both finance and operating subleases, we apply similar judgments as when
we are acting as a lessee to determine the appropriate lease term.
CIBC 2022 ANNUAL REPORT 89

Management’s discussion and analysis
Asset impairment
Goodwill
As at October 31, 2022, we had goodwill of $5,348 million (2021: $4,954 million). Goodwill is not amortized, but is tested, at least annually, for
impairment by comparing the recoverable amount of the cash-generating unit (CGU) to which goodwill has been allocated, with the carrying amount
of the CGU including goodwill. Any deficiency is recognized as impairment of goodwill. The recoverable amount of a CGU is defined as the higher
of its estimated fair value less cost to sell and its value in use. Goodwill is also required to be tested for impairment whenever there are indicators
that it may be impaired.
Estimation of the recoverable amount is an area of significant judgment. Recoverable amounts are estimated using internally developed
models that require the use of significant assumptions including forecasted earnings, discount rates, growth rates, forecasted regulatory capital
requirements, and price-earnings multiples. Reductions in the estimated recoverable amount could arise from various factors, such as reductions in
forecasted cash flows, an increase in the assumed level of required capital, and any adverse changes to the discount rate or terminal growth rates
either in isolation or in any combination thereof. Where our estimated recoverable amount is not significantly in excess of the carrying amount of the
CGU, additional judgment is required, and reductions in the recoverable amount are more likely to result in an impairment charge.
In the fourth quarter of 2022, we performed our annual impairment test. We concluded that the recoverable amounts of our CGUs were in
excess of their carrying amounts.
For additional information, see Note 8 to the consolidated financial statements.
Other intangible assets and long-lived assets
As at October 31, 2022, we had other intangible assets with an indefinite life of $143 million (2021: $140 million) and with a definite life of
$358 million (2021: $195 million), including purchased credit card relationships with a carrying value of $218 million (2021: nil) that were acquired as
part of the acquisition of the Canadian Costco credit card portfolio. Acquired intangible assets are separately recognized if the benefits of the
intangible assets are obtained through contractual or other legal rights, or if the intangible assets can be sold, transferred, licensed, rented, or
exchanged. Determining the useful lives of intangible assets requires judgment and fact-based analysis.
Intangible assets with an indefinite life are not amortized but are assessed for impairment by comparing the recoverable amount to the
carrying amount. The recoverable amount is defined as the higher of the estimated fair value less cost to sell and value in use. An impairment test is
required at least annually, or whenever there are indicators that these assets may be impaired.
Long-lived assets and other identifiable intangible assets with a definite life are amortized over their estimated useful lives. These assets are
tested for impairment whenever events or changes in circumstances indicate that the carrying amount is higher than the recoverable amount.
Determining the recoverable amount of intangible assets and long-lived assets is an area of judgment as we estimate the future cash flows
expected to result from the use of the asset and, where appropriate, cash flows arising from the asset’s eventual disposition.
For additional information, see Note 8 to the consolidated financial statements.
Income taxes
We are committed to responsible tax practices. We execute active tax governance and tax compliance processes to meet the requirements of tax
laws in all countries where we operate. We seek to manage tax and reputational risk to ensure any financial exposure is well understood and
remains consistent with our strategy, risk appetite and financial goals.
We are subject to income tax laws in the various jurisdictions where we operate, and the tax laws in those jurisdictions are potentially subject to
different interpretations by us and the relevant taxation authority, which gives rise to uncertainty. We use judgment in the estimation of income taxes
and deferred tax assets and liabilities. As a result, management judgment is applied in the interpretation of the relevant tax laws and in estimating
the provision for current and deferred income taxes. For tax positions where there is uncertainty regarding the ultimate determination of the tax
impact, including positions which are under audit, dispute or appeal, we recognize provisions to consider this uncertainty based on our best
estimate of the amount expected to be paid based on an assessment of the relevant factors.
Current tax is calculated using tax rates enacted or substantively enacted as at the reporting date. For Canadian income taxes, substantively
enacted is generally interpreted to occur at the point of a third reading in a Canadian Parliament held by a minority government, or the first reading
in a Canadian Parliament held by a majority government.
Deferred tax assets or liabilities are determined for each temporary difference based on the tax rates that are expected to be in effect in the
period that the assets are realized or the liabilities are settled, based on the laws that have been enacted or substantively enacted as at the
reporting date.
Deferred tax liabilities are generally recognized for all taxable temporary differences unless the temporary differences relate to our NIFOs and
will not reverse in the foreseeable future.
We are required to assess whether it is probable that our deferred tax assets will be realized prior to their expiration and, based on all of the
available evidence, determine if any portion of our deferred tax assets should not be recognized. The factors used to assess the probability of
realization are based on our past experience of income and capital gains, forecasts of future net income before income taxes, available tax planning
strategies that could be implemented to realize the deferred tax assets, and the remaining expiration period of tax loss carryforwards. In addition, for
deductible temporary differences arising from our NIFOs, we must consider whether the temporary difference will reverse in the foreseeable future.
Although realization is not assured, we believe, based on all of the available evidence, it is probable that the recognized deferred tax assets will be
realized. Income tax accounting impacts all of our reporting segments. For further details on our income taxes, see Note 19 to the consolidated
financial statements.
Contingent liabilities and provisions
Legal proceedings and other contingencies
In the ordinary course of its business, CIBC is a party to a number of legal proceedings, including regulatory investigations, in which claims for
substantial monetary damages are asserted against CIBC and its subsidiaries. Legal provisions are established if, in the opinion of management, it
is both probable that an outflow of economic benefits will be required to resolve the matter, and a reliable estimate can be made of the amount of
the obligation. If the reliable estimate of probable loss involves a range of potential outcomes within which a specific amount appears to be a better
estimate, that amount is accrued. If no specific amount within the range of potential outcomes appears to be a better estimate than any other
amount, the mid-point in the range is accrued. In some instances, however, it is not possible to determine whether an obligation is probable or to
reliably estimate the amount of loss, in which case no accrual can be made.
While there is inherent difficulty in predicting the outcome of legal proceedings, based on current knowledge and in consultation with legal
counsel, we do not expect the outcome of these matters, individually or in aggregate, to have a material adverse effect on our consolidated financial
90 CIBC 2022 ANNUAL REPORT

Management’s discussion and analysis
statements. However, the outcome of these matters, individually or in aggregate, may be material to our operating results for a particular reporting
period. We regularly assess the adequacy of CIBC’s litigation accruals and make the necessary adjustments to incorporate new information as it
becomes available.
CIBC considers losses to be reasonably possible when they are neither probable nor remote. It is reasonably possible that CIBC may incur
losses in addition to the amounts recorded when the loss accrued is the mid-point of a range of reasonably possible losses, or the potential loss
pertains to a matter in which an unfavourable outcome is reasonably possible but not probable.
A description of significant ongoing matters to which CIBC is a party can be found in Note 22 to the consolidated financial statements. The
provisions disclosed in Note 22 include all of CIBC’s accruals for legal matters as at October 31, 2022, including amounts related to the significant
legal proceedings described in that note and to other legal matters.
CIBC believes the estimate of the aggregate range of reasonably possible losses, in excess of the amounts accrued, for its significant legal
proceedings,
where it is possible to make such an estimate, is from nil to approximately $1.5 billion as at October 31, 2022. This estimated
aggregate range of reasonably possible losses is based upon currently available information for those significant proceedings in which CIBC is
involved, taking into account CIBC’s best estimate of such losses for those cases for which an estimate can be made. CIBC’s estimate involves
significant judgment, given the varying stages of the proceedings and the existence of multiple defendants in many of such proceedings whose
share of the liability has yet to be determined. The range does not include potential punitive damages. The matters underlying the estimated range
as at October 31, 2022, consist of the significant legal matters disclosed in Note 22 to the consolidated financial statements. The matters underlying
the estimated range will change from time to time, and actual losses may vary significantly from the current estimate. For certain matters, CIBC does
not believe that an estimate can currently be made as many of them are in preliminary stages and certain matters have no specific amount claimed.
Consequently, these matters are not included in the range.
Post-employment and other long-term benefit plan assumptions
We sponsor a number of benefit plans to eligible employees, including registered and supplemental pension plans, and post-retirement medical
and dental plans (other post-employment benefit plans). We also continue to sponsor long-term disability medical and dental benefit plans
(collectively, other long-term benefit plans). The long-term disability income replacement plan that was previously closed to new claims as of June
2004, was settled effective December 2021.
The calculation of net defined benefit plan expense and obligations depends on various actuarial assumptions such as discount rates, health-
care cost trend rates, turnover of employees, projected salary increases, retirement age, and mortality rates. The actuarial assumptions used for
determining the net defined benefit plan expense for a fiscal year are set at the beginning of the annual reporting period, are reviewed in
accordance with accepted actuarial practice and are approved by management. We applied additional judgment in developing salary-related
assumptions for the year ended October 31, 2022 given the impact of inflationary pressures on employee compensation and our public
commitments to additional wage increases for certain employees.
The discount rate assumption used in measuring the net defined benefit plan expense and obligations reflects market yields, as of the
measurement date, on high-quality debt instruments with a currency and term to maturity that match the currency and expected timing of benefit
payments. Our discount rate is estimated by developing a yield curve based on high-quality corporate bonds. While there is a deep market of
high-quality corporate bonds denominated in Canadian dollars with short and medium terms to maturity, there is not a deep market in bonds with
terms to maturity that match the timing of all the expected benefit payments for all of our Canadian plans. As a result, for our Canadian pension,
other post-employment and other long-term benefit plans, we estimate the yields of high-quality corporate bonds with longer-term maturities by
extrapolating current yields on bonds with short- and medium-term durations along the yield curve. Judgment is required in constructing the yield
curve, and as a result, different methodologies applied in constructing the yield curve can give rise to different discount rates.
For further details of our annual pension and other post-employment expense and obligations, see Note 18 and Note 1 to the consolidated
financial statements.
Self-managed loyalty points program
We sponsor certain self-managed credit card loyalty points programs for which we recognize credit card loyalty point liabilities that are subject to
periodic remeasurement to reflect the expected cost of redemption as this expectation changes over time. The calculation of the expected cost of
redemption requires the use of judgment and depends on various assumptions, including estimation of the cost per point and the long-term
redemption rate.
For further details on our self-managed loyalty points programs, see Note 1 to the consolidated financial statements.
Accounting developments
Transition to IFRS 17
IFRS 17 “Insurance Contracts” (IFRS 17), issued in May 2017, replaces IFRS 4 “Insurance Contracts”. In June 2020, the IASB issued amendments to
IFRS 17 partly aimed at helping companies implement the standard. IFRS 17, incorporating the amendments, is effective for annual reporting
periods beginning on or after January 1, 2023, which for us, will be November 1, 2023. IFRS 17 provides comprehensive guidance on the
recognition, measurement, presentation and disclosure of insurance contracts we issue and reinsurance contracts we hold. IFRS 17 is to be applied
retrospectively unless impracticable. We expect changes in the timing of revenue recognition for our insurance contracts and changes to our
insurance contract liabilities as a result of IFRS 17.
We continue to prepare for the implementation of IFRS 17, which is overseen by an Executive Steering Committee. The Executive Steering
Committee includes stakeholders from the frontline business and functional groups including Finance, Technology and Risk Management as well as
our Appointed Actuary. We have evaluated the changes to our accounting and actuarial policies resulting from the adoption of IFRS 17 and are in
the process of implementing a technology solution to support the new accounting requirements.
We continue to evaluate the effect of this standard on our consolidated financial statements.
CIBC 2022 ANNUAL REPORT 91

Management’s discussion and analysis
Other regulatory developments
Reforms to interest rate benchmarks
Various interest rate and other indices that are deemed to be “benchmarks” (including LIBOR) are the subject of international regulatory guidance
and proposals for reform. Regulators in various jurisdictions have pushed for the transition from Interbank Offered Rates (IBORs) to alternative
benchmark rates (alternative rates), based upon risk-free rates determined using actual market transactions. Following the previous announcements
by various regulators, the publication of LIBOR settings for all sterling, Japanese yen, Swiss franc and euro, as well as 1-week and 2-month USD
LIBOR settings was discontinued on December 31, 2021. The remaining USD LIBOR settings will cease to be published after June 30, 2023. In
March 2022, the Adjustable Interest Rate (LIBOR) Act was enacted in the U.S., which allows for contracts that do not contain adequate fallback
provisions to automatically transition to Secured Overnight Financing Rate (SOFR) upon the cessation of USD LIBOR. The enactment of this
legislation is a positive step towards facilitating the remediation efforts for USD LIBOR exposures.
In December 2021, CARR recommended to Refinitiv Benchmark Services (UK) Limited (RBSL), the CDOR administrator, to cease the
calculation and publication of CDOR after June 30, 2024 and proposed a two-staged approach to the transition from CDOR to CORRA. Following
public consultation, on May 16, 2022, RBSL announced that it will permanently cease the publication and calculation of all remaining tenors of
CDOR after June 28, 2024. Following this announcement, OSFI published its expectations for CDOR transition which is consistent with the two-stage
transition approach proposed by CARR. OSFI expects all new derivatives and securities to transition to the alternative rates by June 30, 2023, with
no new CDOR exposures after that date, with limited exceptions. OSFI also expects all loan agreements referencing CDOR to be transitioned by
June 28, 2024, and FRFIs to prioritize system and model updates to accommodate the use of CORRA prior to June 28, 2024.
The transition from current reference rates to alternative rates may adversely affect the value of, return on, or trading market for contracts
linked to existing benchmarks. These developments may cause some LIBOR and other benchmarks to be discontinued. A significant number of
CIBC’s derivatives, securities, and lending and deposit contracts reference various interest rate benchmarks, including contracts with maturity dates
that extend beyond the cessation dates announced by the regulators.
In response to the reforms to interest rate benchmarks, CIBC established an Enterprise IBOR Transition Program (Program), to manage and
coordinate all aspects of the transition. The Program is supported by a formal governance structure and dedicated working groups that include
stakeholders from frontline businesses as well as functional groups such as Treasury, Technology and Operations, Risk Management, Legal, and
Finance, to facilitate the transition.
Our Enterprise IBOR Transition Program continues to manage and coordinate all aspects of the transition. Consistent with regulatory
expectations, we have completed the transition of our non-USD LIBOR and 1-week and 2-month USD LIBOR referenced contracts, and no new
USD LIBOR products were originated after December 31, 2021 with limited permitted exceptions. We are in the process of transitioning our
remaining USD LIBOR based contracts to the alternative rates and have developed business processes to support the transition. The Program is
also assessing the impact of the cessation of CDOR on our operations and is developing plans to facilitate the transition of CDOR to alternative
rates. As part of the Program, we continue to engage with industry associations on ongoing developments, and continue to incorporate these into
our project plan and make information available to our clients, advising them on recent developments. The Program provides regular updates to
senior management, including the Executive Committee, and the Board.
The IASB issued amendments to impacted accounting standards to provide relief to entities impacted by the transition to alternative rates. In
September 2019, the IASB issued “Interest Rate Benchmark Reform: Amendments to IFRS 9, IAS 39 and IFRS 7” (the Phase 1 amendments), which
provides relief for specific hedge accounting requirements to address uncertainties in the period before interest rate benchmark reform, and
provides certain disclosure requirements. In August 2020, the IASB issued “Interest Rate Benchmark Reform: Phase 2 Amendments to IFRS 9,
IAS 39, IFRS 7, IFRS 4 and IFRS 16” (the Phase 2 amendments), which addresses issues that affect financial reporting once an existing rate is
replaced with an alternative rate and provides for additional disclosure requirements. As we elected to continue to apply the hedge accounting
requirements of IAS 39 upon the adoption of IFRS 9, only the amendments to the classification and measurement sections of IFRS 9, the hedge
accounting sections of IAS 39 and IFRS 7, IFRS 4 and IFRS 16 apply to us. CIBC elected to early adopt the Phase 1 and Phase 2 amendments
effective November 1, 2019 and November 1, 2020, respectively. As a result, we have provided additional disclosures related to our exposures to
significant benchmark rates subject to the reform in Note 1 to our consolidated financial statements.
Client-focused reforms
In October 2019, the CSA published final amendments to National Instrument 31-103 “Registration Requirements, Exemptions, and Ongoing
Registrant Obligations” and its Companion Policy. The client-focused reforms are supported by new and/or amended requirements with respect to
know your client, enhanced suitability, product due diligence, know your product, conflicts of interest, relationship disclosure, referrals, and
misleading communications. The CSA expects that these requirements will result in a new, higher standard of conduct across all categories for
registered dealers, advisers and their representatives. In addition, the Investment Industry Regulatory Organization of Canada and the Mutual Fund
Dealers Association (MFDA) published rule amendments aligning to the CSA client-focused reforms.
Due to COVID-19, the original implementation dates scheduled for June 30, 2020 (conflicts of interest) and December 31, 2020 (all remaining
amendments) were deferred to 2021. Pursuant to the new timelines, the requirements related to conflicts of interest were effective June 30, 2021
and all other remaining requirements are effective December 31, 2021.
These requirements impact our Canadian Commercial Banking and Wealth Management and Canadian Personal and Business Banking SBUs,
as well as Direct Financial Services within our Capital Markets SBU. Relevant changes to our policies and procedures to comply with the conflicts of
interest requirements were implemented by June 30, 2021. The remaining changes to our policies and procedures to comply were implemented by
December 31, 2021.
CDIC – Deposit protection modernization
In April 2019, the Canadian Federal government approved changes to the Canada Deposit Insurance Corporation Act intended to strengthen and
modernize deposit protection. The changes occur in two phases. The first phase was effective on April 30, 2020, and included changes to extend
CDIC coverage to foreign currency deposits and deposits with terms greater than five years, and to eliminate coverage for travellers’ cheques. The
second phase was effective on April 30, 2022, and included additional changes such as providing separate coverage for certain registered plans
and introducing new requirements for deposits held in trust.
92 CIBC 2022 ANNUAL REPORT

Management’s discussion and analysis
OSFI Guideline B-13 – Technology and Cyber Risk Management
On July 13, 2022, OSFI issued the final Guideline B-13, which will become effective on January 1, 2024. This guideline sets out OSFI’s expectations
for how FRFIs should manage technology and cyber risks such as data breaches, technology outages and more. The Guideline is organized around
three “domains,” each of which sets out key components for sound risk management: Governance and Risk Management, Technology Operations
and Resilience, and Cyber Security. Efforts are underway to self-assess and ensure compliance with the Guideline.
OSFI Guideline – Assurance on Capital, Leverage and Liquidity Returns
On November 7, 2022, OSFI issued a Guideline on Assurance on Capital, Leverage and Liquidity Returns, which sets out OSFI’s three-step
approach to enhancing and aligning assurance expectations over regulatory capital, leverage and liquidity returns, including expectations
concerning the role of management, Internal Audit and the external auditors. The Guideline is effective in stages over a three year period beginning
in fiscal 2023, including the requirement for an external audit opinion on the numerator and denominator of key regulatory ratios in fiscal 2025.
Related-party transactions
We have various processes in place to ensure that the relevant related-party information is identified and reported to the CGC of the Board on a quarterly
basis, as required by the Bank Act (Canada). The CGC has the responsibility for reviewing our policies and practices in identifying transactions with our
related parties that may materially affect us, and reviewing the associated procedures for promoting compliance with the Bank Act (Canada).
In the ordinary course of business, we provide banking services and enter into transactions with related parties on terms similar to those
offered to unrelated parties. Related parties include key management personnel
(1)
, their close family members, and entities that they or their close
family members control or jointly control. Related parties also include associates and joint ventures accounted for under the equity method, and
post-employment benefit plans for CIBC employees. Loans to these related parties are made in the ordinary course of business and on substantially
the same terms as for comparable transactions with unrelated parties. We offer a subsidy on annual fees and preferential interest rates on credit
card balances to senior officers which is the same offer extended to all employees of CIBC. In addition, CIBC offers deferred share and other plans
to non-employee directors, executives, and certain other key employees. Details of our compensation of key management personnel
(1)
and our
investments in equity-accounted associates and joint ventures are disclosed in Notes 17, 18, 24 and 25 to the consolidated financial statements.
(1) Key management personnel are defined as those persons having authority and responsibility for planning, directing and controlling the activities of CIBC directly or
indirectly and comprise the members of the Board (referred to as directors), ExCo and certain named officers per the Bank Act (Canada) (collectively referred to as senior
officers). Board members who are also ExCo members are included as senior officers.
CIBC 2022 ANNUAL REPORT 93

Management’s discussion and analysis
Policy on the Scope of Services of the Shareholders’ Auditor
The “Policy on the Scope of Services of the Shareholders’ Auditor” sets out the parameters for the engagement of the shareholders’ auditor by CIBC
that are consistent with applicable law, including the U.S. Sarbanes-Oxley Act of 2002 and SEC rules. The policy requires the Audit Committee’s
pre-approval of all work performed by the shareholders’ auditor and prohibits CIBC from engaging the shareholders’ auditor for “prohibited”
services. The Audit Committee is accountable for the oversight of the work of the shareholders’ auditor and for an annual assessment of the
engagement team’s qualifications, performance and independence, including lead audit partner rotation. The Audit Committee is also responsible
for conducting a periodic comprehensive review of the external auditor at least every five years. The Audit Committee’s oversight activities over the
shareholders’ auditor are disclosed in our Management Proxy Circular.
Controls and procedures
Disclosure controls and procedures
CIBC’s disclosure controls and procedures are designed to provide reasonable assurance that relevant information is accumulated and
communicated to CIBC’s management, including the President and CEO and the Chief Financial Officer (CFO), to allow timely decisions regarding
required disclosure.
CIBC’s management, with the participation of the President and CEO and the CFO, has evaluated the effectiveness of CIBC’s disclosure controls
and procedures as at October 31, 2022, (as defined in the rules of the SEC and the CSA). Based on that evaluation, the President and CEO and the
CFO have concluded that such disclosure controls and procedures were effective.
Management’s annual report on internal control over financial reporting
CIBC’s management is responsible for establishing and maintaining adequate internal control over financial reporting for CIBC.
Internal control over financial reporting is a process designed by, or under the supervision of, the President and CEO and the CFO and effected
by the Board, management and other personnel to provide reasonable assurance regarding the reliability of financial reporting and the preparation of
financial statements for external purposes in accordance with IFRS as issued by the IASB. CIBC’s internal control over financial reporting includes
those policies and procedures that: (i) pertain to the maintenance of records, that, in reasonable detail, accurately and fairly reflect the transactions
and dispositions of the assets of CIBC; (ii) provide reasonable assurance that transactions are recorded as necessary to permit preparation of
financial statements in accordance with IFRS as issued by the IASB, and that receipts and expenditures of CIBC are being made only in accordance
with authorizations of CIBC’s management and directors; and (iii) provide reasonable assurance regarding prevention or timely detection of
unauthorized acquisition, use or disposition of CIBC’s assets that could have a material effect on the consolidated financial statements.
All internal control systems, no matter how well designed, have inherent limitations and may not prevent or detect misstatements on a timely
basis. Therefore, even those systems determined to be effective can provide only reasonable assurance with respect to financial statement
preparation and presentation.
CIBC’s management has used the Internal Control – Integrated Framework that was published in 2013 by the COSO as the basis to evaluate
the effectiveness of CIBC’s internal control over financial reporting.
As at October 31, 2022, management assessed the effectiveness of CIBC’s internal control over financial reporting and concluded that such
internal control was effective.
Ernst & Young LLP, the shareholders’ auditor, has audited the consolidated financial statements of CIBC for the year ended October 31, 2022, and
has also issued a report on internal control over financial reporting under standards of the Public Company Accounting Oversight Board (United States).
Changes in internal control over financial reporting
There have been no changes in CIBC’s internal control over financial reporting during the year ended October 31, 2022, that have materially
affected, or are reasonably likely to materially affect, its internal control.
94 CIBC 2022 ANNUAL REPORT

Management’s discussion and analysis
Supplementary annual financial information
Average balance sheet, net interest income and margin
$ millions, for the year ended October 31
Average balance
(1)
Interest Average rate
2022 2021 2020 2022 2021 2020 2022 2021 2020
Domestic assets
(2)
Cash and deposits with banks $ 24,833 $ 37,527 $ 30,232 $ 384 $ 95 $ 150 1.55 % 0.25 % 0.50 %
Securities 88,483 82,262 76,063 2,072 1,567 1,776 2.34 1.90 2.33
Securities borrowed or purchased under resale
agreements
29,606 27,203 26,498 509 154 290 1.72 0.57 1.09
Loans Residential mortgages 256,600 230,606 208,811 6,722 5,141 5,581 2.62 2.23 2.67
Personal
(3)
41,687 39,939 40,690 2,075 1,624 1,949 4.98 4.07 4.79
Credit card
(3)
13,236 10,171 11,258 1,687 1,338 1,484 12.75 13.16 13.18
Business and government 86,543 70,755 68,072 2,795 1,712 2,043 3.23 2.42 3.00
Total loans 398,066 351,471 328,831 13,279 9,815 11,057 3.34 2.79 3.36
Other interest-bearing assets 9,488 8,901 5,194 123 45 62 1.30 0.51 1.19
Derivative instruments 15,426 11,382 14,334 – – – – – –
Customers’ liability under acceptances 11,909 10,613 9,560 – – – – – –
Other non-interest-bearing assets 25,385 21,371 19,641 – – – – – –
Total domestic assets 603,196 550,730 510,353 16,367 11,676 13,335 2.71 2.12 2.61
Foreign assets
(2)
Cash and deposits with banks 34,703 30,270 20,050 324 36 99 0.93 0.12 0.49
Securities 88,234 72,870 62,014 1,350 574 792 1.53 0.79 1.28
Securities borrowed or purchased under resale
agreements
49,196 51,157 42,199 666 165 552 1.35 0.32 1.31
Loans Residential mortgages 4,941 4,501 4,429 187 157 176 3.78 3.49 3.97
Personal
(3)
1,347 1,192 1,156 65 55 62 4.83 4.61 5.36
Credit card
(3)
133 129 153 28 28 35 21.05 21.71 22.88
Business and government 84,337 66,677 66,015 3,103 1,995 2,416 3.68 2.99 3.66
Total loans 90,758 72,499 71,753 3,383 2,235 2,689 3.73 3.08 3.75
Other interest-bearing assets 2,522 923 701 89 55 55 3.53 5.96 7.85
Derivative instruments 24,127 24,186 20,629 – – – – – –
Customers’ liability under acceptances – 1 1 – – – – – –
Other non-interest-bearing assets 7,477 6,985 7,792 – – – – – –
Total foreign assets 297,017 258,891 225,139 5,812 3,065 4,187 1.96 1.18 1.86
Total assets $ 900,213 $ 809,621 $ 735,492 $ 22,179 $ 14,741 $ 17,522 2.46 % 1.82 % 2.38 %
Domestic liabilities
(2)
Deposits Personal $ 204,075 $ 189,599 $ 172,913 $ 1,535 $ 734 $ 1,405 0.75 % 0.39 % 0.81 %
Business and government 224,303 198,978 178,476 3,662 1,170 2,019 1.63 0.59 1.13
Bank 1,513 2,220 2,105 9 3 13 0.59 0.14 0.62
Secured borrowings 43,892 37,893 39,076 862 378 668 1.96 1.00 1.71
Total deposits 473,783 428,690 392,570 6,068 2,285 4,105 1.28 0.53 1.05
Derivative instruments 15,581 10,621 14,398 – – – – – –
Acceptances 11,910 10,614 9,563 – – – – – –
Obligations related to securities sold short 18,496 19,018 16,794 333 229 251 1.80 1.20 1.49
Obligations related to securities lent or sold under
repurchase agreements
18,594 26,349 27,374 301 151 220 1.62 0.57 0.80
Other liabilities 23,979 20,432 6,464 86 36 49 0.36 0.18 0.76
Subordinated indebtedness 5,901 5,340 4,891 200 120 152 3.39 2.25 3.11
Total domestic liabilities 568,244 521,064 472,054 6,988 2,821 4,777 1.23 0.54 1.01
Foreign liabilities
(2)
Deposits Personal 18,689 16,795 16,974 108 62 142 0.58 0.37 0.84
Business and government 157,085 134,038 113,877 1,535 268 964 0.98 0.20 0.85
Bank 20,842 16,848 13,891 121 20 100 0.58 0.12 0.72
Secured borrowings 3,290 1,883 1,322 55 16 15 1.67 0.85 1.13
Total deposits 199,906 169,564 146,064 1,819 366 1,221 0.91 0.22 0.84
Derivative instruments 24,369 22,571 20,718 – – – – – –
Acceptances – 1 1 – – – – – –
Obligations related to securities sold short 2,789 1,050 1,047 47 7 3 1.69 0.67 0.29
Obligations related to securities lent or sold under
repurchase agreements
53,750 50,142 41,881 642 57 436 1.19 0.11 1.04
Other liabilities 3,013 2,395 13,706 39 29 34 1.29 1.21 0.25
Subordinated indebtedness 97 96 152 3 2 7 3.09 2.08 4.61
Total foreign liabilities 283,924 245,819 223,569 2,550 461 1,701 0.90 0.19 0.76
Total liabilities 852,168 766,883 695,623 9,538 3,282 6,478 1.12 0.43 0.93
Shareholders’ equity 47,851
42,563 39,682 – – – – – –
Non-controlling interests 194 175 187 – – – – – –
Total liabilities and equity
$ 900,213 $ 809,621 $ 735,492 $ 9,538 $ 3,282 $ 6,478 1.06 % 0.41 % 0.88 %
Net interest income and net interest margin
(4)
$ 12,641 $ 11,459 $ 11,044 1.40 % 1.42 % 1.50 %
Additional disclosures: Non-interest-bearing deposit liabilities
Domestic $ 92,579 $ 76,224 $ 59,862
Foreign 25,950 22,396 18,430
(1) Average balances are calculated as a weighted average of daily closing balances.
(2) Classification as domestic or foreign is based on domicile of debtor or customer.
(3) Certain prior year information has been revised to conform to current year presentation.
(4) Net interest income as a percentage of average assets.
CIBC 2022 ANNUAL REPORT 95

Management’s discussion and analysis
Volume/rate analysis of changes in net interest income
$ millions 2022/2021 2021/2020
Increase (decrease) due to change in: Increase (decrease) due to change in:
Average
balance
Average
rate Total
Average
balance
Average
rate Total
Domestic assets
(1)
Cash and deposits with banks $ (32) $ 321 $ 289 $ 36 $ (91) $ (55)
Securities 119 386 505 145 (354) (209)
Securities borrowed or purchased under resale agreements 14 341 355 8 (144) (136)
Loans Residential mortgages 579 1,002 1,581 583 (1,023) (440)
Personal
(2)
71 380 451 (36) (289) (325)
Credit card
(2)
403 (54) 349 (143) (3) (146)
Business and government 382 701 1,083 81 (412) (331)
Total loans
(2)
1,435 2,029 3,464 485 (1,727) (1,242)
Other interest-bearing assets 3 75 78 44 (61) (17)
Change in domestic interest income
(2)
1,539 3,152 4,691 718 (2,377) (1,659)
Foreign assets
(1)
Cash and deposits with banks 5 283 288 50 (113) (63)
Securities 121 655 776 139 (357) (218)
Securities borrowed or purchased under resale agreements (6) 507 501 117 (504) (387)
Loans Residential mortgages 15 15 30 3 (22) (19)
Personal
(2)
7 3 10 2 (9) (7)
Credit card
(2)
1 (1) – (5) (2) (7)
Business and government 528 580 1,108 24 (445) (421)
Total loans
(2)
551 597 1,148 24 (478) (454)
Other interest-bearing assets 95 (61) 34 17 (17) –
Change in foreign interest income
(2)
766 1,981 2,747 347 (1,469) (1,122)
Total change in interest income
(2)
$ 2,305 $ 5,133 $ 7,438 $ 1,065 $ (3,846) $ (2,781)
Domestic liabilities
(1)
Deposits Personal $ 56 $ 745 $ 801 $ 136 $ (807) $ (671)
Business and government 149 2,343 2,492 232 (1,081) (849)
Bank (1) 7 6 1 (11) (10)
Secured borrowings 60 424 484 (20) (270) (290)
Total deposits 264 3,519 3,783 349 (2,169) (1,820)
Obligations related to securities sold short (6) 110 104 33 (55) (22)
Obligations related to securities lent or sold under repurchase
agreements (44) 194 150 (8) (61) (69)
Other liabilities 6 44 50 106 (119) (13)
Subordinated indebtedness 13 67 80 14 (46) (32)
Change in domestic interest expense 233 3,934 4,167 494 (2,450) (1,956)
Foreign liabilities
(1)
Deposits Personal 7 39 46 (1) (79) (80)
Business and government 46 1,221 1,267 171 (867) (696)
Bank 5 96 101 21 (101) (80)
Secured borrowings 12 27 39 6 (5) 1
Total deposits 70 1,383 1,453 197 (1,052) (855)
Obligations related to securities sold short 12 28 40 – 4 4
Obligations related to securities lent or sold under repurchase
agreements 4 581 585 86 (465) (379)
Other liabilities 7 3 10 (28) 23 (5)
Subordinated indebtedness – 1 1 (3) (2) (5)
Change in foreign interest expense 93 1,996 2,089 252 (1,492) (1,240)
Total change in interest expense $ 326 $ 5,930 $ 6,256 $ 746 $ (3,942) $ (3,196)
Change in total net interest income $ 1,979 $ (797) $ 1,182 $ 319 $ 96 $ 415
(1) Classification as domestic or foreign is based on domicile of debtor or customer.
(2) Certain prior year information has been revised to conform to current year presentation.
96 CIBC 2022 ANNUAL REPORT

Management’s discussion and analysis
Analysis of net loans and acceptances
$ millions, as at October 31
Canada
(1)
U.S.
(1)
Other
(1)
Total
2022 2021 2022 2021 2022 2021 2022 2021
Residential mortgages $ 264,089 $ 246,581 $ 2,439 $ 2,071 $ 2,885 $ 2,594 $ 269,413 $ 251,246
Personal 43,210 39,940 626 542 691 647 44,527 41,129
Credit card 15,523 10,362 26 22 146 125 15,695 10,509
Total net consumer loans 322,822 296,883 3,091 2,635 3,722 3,366 329,635 302,884
Non-residential mortgages 5,827 6,259 – 48 250 268 6,077 6,575
Financial institutions 13,593 11,407 20,045 13,705 6,805 3,896 40,443 29,008
Retail and wholesale 9,304 6,549 3,156 2,449 650 596 13,110 9,594
Business services 9,932 6,663 6,188 4,808 2,077 1,789 18,197 13,260
Manufacturing – capital goods 3,012 2,222 2,746 2,500 39 93 5,797 4,815
Manufacturing – consumer goods 5,014 3,430 1,610 1,283 133 91 6,757 4,804
Real estate and construction 29,486 25,151 22,705
18,138 1,218 1,264 53,409 44,553
Agriculture 7,901 7,242 242 129 32 36 8,175 7,407
Oil and gas 2,391 2,539 1,214 1,818 55 238 3,660 4,595
Mining 993 415 167 127 554 490 1,714 1,032
Forest products 442 283 111 165 – – 553 448
Hardware and software 940 589 3,056 2,275 412 130 4,408 2,994
Telecommunications and cable 1,066 238 1,348 1,196 141 130 2,555 1,564
Publishing, printing, and broadcasting 211 343 259 71 85 95 555 509
Transportation 2,673 2,526 2,176 1,255 2,406 2,909 7,255 6,690
Utilities 5,583 4,397 3,870 3,654 4,159 3,519 13,612 11,570
Education, health and social services 3,828 3,664 4,932 3,927 48 23 8,808 7,614
Governments 2,074 1,666 302 229 2,304
1,736 4,680 3,631
Others – – – – – – – –
Stage 1 and 2 allowance for credit losses
(2)(3)
(260) (245) (370) (282) (113) (141) (743) (668)
Total net business and government
loans, including acceptances 104,010 85,338 73,757 57,495 21,255 17,162 199,022 159,995
Total net loans and acceptances $ 426,832 $ 382,221 $ 76,848 $ 60,130 $ 24,977 $ 20,528 $ 528,657 $ 462,879
(1) Classification by country is primarily based on domicile of debtor or customer.
(2) Stage 3 allowance for credit losses is allocated to business and government loans, including acceptances, by category above.
(3) Includes the allocation of Stage 1 and 2 allowance based on the geographic location where they are recorded.
Summary of allowance for credit losses
$ millions, as at or for the year ended October 31 2022 2021
Balance at beginning of year $ 2,970 $ 3,722
Provision for credit losses 1,057 158
Write-offs
(1)
Residential mortgages 47 27
Personal 274 266
Credit card 397 414
Business and government 312 279
Total write-offs 1,030 986
Recoveries
(1)
Residential mortgages 2 3
Personal 69 70
Credit card 114 119
Business and government 33 14
Total recoveries 218 206
Net write-offs 812 780
Interest income on impaired loans (35) (41)
Foreign exchange and other 96 (89)
Balance at end of year $ 3,276 $ 2,970
Comprises:
Loans $ 3,073 $ 2,849
Undrawn credit facilities and other off-balance sheet exposures 203 121
Ratio of net write-offs during the year to average loans outstanding during the year
(1)
Residential mortgages 0.02 % 0.01 %
Personal 0.48 0.48
Credit card 2.12 2.86
Business and government 0.16 0.19
(1) Certain prior year information has been revised to conform to current year presentation.
CIBC 2022 ANNUAL REPORT 97

Management’s discussion and analysis
Net loans and acceptances by geographic location
(1)
$ millions, as at October 31 2022 2021
Canada
Atlantic provinces $ 16,108 $ 14,898
Quebec 41,703 35,092
Ontario 229,250 202,789
Prairie provinces 16,580 15,092
Alberta, Northwest Territories and Nunavut 49,666 46,816
British Columbia and Yukon 75,385 69,110
Stage 1 and 2 allowance allocated to Canada
(2)(3)
(1,860) (1,576)
Total Canada 426,832 382,221
U.S.
(2)(3)
76,848 60,130
Other countries
(2)(3)
24,977 20,528
Total net loans and acceptances $ 528,657 $ 462,879
(1) Classification by country is primarily based on domicile of debtor or customer.
(2) Includes the allocation of Stage 1 and 2 allowance based on the geographic location where they are recorded.
(3) For Canada, Stage 3 allowance for credit losses is allocated to provinces above, including acceptances. For U.S. and Other countries, amounts are net of Stage 3
allowances for credit losses.
Loans interest rate sensitivity
$ millions, as at October 31 2022 2021
Floating Fixed rate
(1)
Non-rate
sensitive Total
Floating Fixed rate
(1)
Non-rate
sensitive Total
Loans
Residential mortgages $ 104,379 $ 165,327 $ – $ 269,706 $ 72,507 $ 179,019 $ – $ 251,526
Personal 37,023 8,406 – 45,429 35,626 6,271 – 41,897
Credit card – – 16,479 16,479 – – 11,134 11,134
Business and government 137,478 50,842 222 188,542 104,724 45,336 153 150,213
Gross loans 278,880 224,575 16,701 520,156 212,857 230,626 11,287 454,770
Allowance for credit losses (3,073) (2,849)
$ 517,083 $ 451,921
(1) Bankers’ acceptances are included as part of fixed rate loans.
98 CIBC 2022 ANNUAL REPORT

Management’s discussion and analysis
Net impaired loans
$ millions, as at October 31
Canada
(1)
U.S.
(1)
Other
(1)
Total
2022 2021 2022 2021 2022 2021 2022 2021
Gross impaired loans
Residential mortgages $ 355 $ 425 $ 19 $ 18 $ 222 $ 195 $ 596 $ 638
Personal 155 104 18 3 54 55 227 162
Total gross impaired consumer loans 510 529 37 21 276 250 823 800
Non-residential mortgages 1 2 – – 23 11 24 13
Financial institutions 11 4 30 70 – 1 41 75
Retail, wholesale and business services 187 192 55 55 51 53 293 300
Manufacturing – consumer and capital goods 26 24 67 51 3 16 96 91
Real estate and construction 63 16 131 239 41 42 235 297
Agriculture 11 10 – – – – 11 10
Resource-based industries 12 50 23 7 – – 35 57
Telecommunications, media
and technology 6 4 15 6 – – 21 10
Transportation 4 6 – – 1 2 5 8
Utilities 28 93 – – – – 28 93
Other 129 71 2 8 – – 131 79
Total gross impaired – business and government loans 478 472 323 436 119 125 920 1,033
Total gross impaired loans 988 1,001 360 457 395 375 1,743 1,833
Other past due loans
(2)
122 64 – – 3 2 125 66
Total gross impaired and other past due loans 1,110 1,065 360 457 398 377 1,868 1,899
Allowance for credit losses
Residential mortgages 48 54 5 5 114 99 167 158
Personal 101 64 6 2 39 40 146 106
Total allowance – consumer loans 149 118 11 7 153 139 313 264
Non-residential mortgages – – – – 8 2 8 2
Financial institutions 1 1 – 15 – 1 1 17
Retail, wholesale and business services 161 177 17 19 34 33 212 229
Manufacturing – consumer and capital goods 9 9 – 3 1 4 10 16
Real estate and construction 10 8 8 62 18 22 36 92
Agriculture 7 7 – – – – 7 7
Resource-based industries 9 33 10 1 – – 19 34
Telecommunications, media
and technology 4 3 3 1 – – 7 4
Transportation 2 3 – – 1 1 3 4
Utilities 9 79 – – – – 9 79
Other 39 24 – – – – 39 24
Total allowance – business and government loans 251 344 38 101 62 63 351 508
Total allowance 400 462 49 108 215 202 664 772
Net impaired loans
Residential mortgages 307 371 14 13 108 96 429 480
Personal 54 40 12 1 15 15 81 56
Total net impaired consumer loans 361 411 26 14 123 111 510 536
Non-residential mortgages 1 2 – – 15 9 16 11
Financial institutions 10 3 30 55 – – 40 58
Retail, wholesale and business
services 26 15 38 36 17 20 81 71
Manufacturing – consumer and capital goods 17 15 67 48 2 12 86 75
Real estate and construction 53 8 123 177 23 20 199 205
Agriculture 4 3 – – – – 4 3
Resource-based industries 3 17 13 6 – – 16 23
Telecommunications, media and technology 2 1 12 5 – – 14 6
Transportation 2 3 – – – 1 2 4
Utilities 19 14 – – – – 19 14
Other 90 47 2 8 – – 92 55
Total net impaired –
business and government loans 227 128 285 335 57 62 569 525
Total net impaired loans $ 588 $ 539 $ 311 $ 349 $ 180 $ 173 $ 1,079 $ 1,061
(1) Classification by country is primarily based on domicile of debtor or customer.
(2) Represents loans where repayment of principal or payment of interest is contractually in arrears between 90 and 180 days.
CIBC 2022 ANNUAL REPORT 99

Management’s discussion and analysis
Deposits
$ millions, for the year ended October 31
Average balance
(1)
Interest Rate
2022 2021 2022 2021 2022 2021
Deposits in domestic bank offices
(2)
Payable on demand
Personal $ 14,123 $ 12,820 $ 5 $ 5 0.04 % 0.04 %
Business and government 77,567 67,233 731 164 0.94 0.24
Bank 11,076 8,881 2 – 0.02 –
Payable after notice
Personal 135,937 130,636 490 194 0.36 0.15
Business and government 68,671 64,661 1,115 390 1.62 0.60
Bank 129 351 2 2 1.55 0.57
Payable on a fixed date
Personal 58,700 50,479 1,075 552 1.83 1.09
Business and government 116,811 105,251 2,190 684 1.87 0.65
Bank 2,362 2,167 20 2 0.85 0.09
Secured borrowings 43,892 37,893 862 378 1.96 1.00
Total domestic 529,268 480,372 6,492 2,371 1.23 0.49
Deposits in
foreign bank offices
Payable on demand
Personal 2,650 2,213 2 1 0.08 0.05
Business and government 28,621 24,156 69 8 0.24 0.03
Bank 14 37 1 1 4.29 2.70
Payable after notice
Personal 9,333 8,305 57 33 0.61 0.40
Business and government 18,834 16,623 153 26 0.81 0.16
Payable on a fixed date
Personal 2,021 1,941 14 11 0.69 0.57
Business and government 70,884 55,092 939 166 1.32 0.30
Bank 8,774 7,632 105 18 1.20 0.24
Secured borrowings 3,290 1,883 55 16 1.67 0.85
Total foreign 144,421 117,882 1,395 280 0.97 0.24
Total deposits $
673,689 $ 598,254 $ 7,887 $ 2,651 1.17 % 0.44 %
(1) Average balances are calculated as a weighted average of daily closing balances.
(2) Deposits by foreign depositors in our domestic bank offices amounted to $55.8 billion (2021: $51.9 billion).
Fees paid to the shareholders’ auditor
$ millions, for the year ended October 31 2022 2021
Audit fees
(1)
$ 24.6 $ 23.1
Audit-related fees
(2)
2.2 2.3
Tax fees
(3)
1.9 1.3
All other fees
(4)
– –
Total $ 28.7 $ 26.7
(1) For the audit of CIBC’s annual financial statements and the audit of certain of our subsidiaries, as well as other services normally provided by the principal auditor in
connection with CIBC’s statutory and regulatory filings. Audit fees also include the audit of internal control over financial reporting under the standards of the Public
Company Accounting Oversight Board (United States).
(2) For the assurance and related services that are reasonably related to the performance of the audit or review of CIBC’s consolidated financial statements, including
accounting consultation, various agreed upon procedures and translation of financial reports.
(3) For tax compliance and advisory services.
(4) Includes fees for non-audit services.
100 CIBC 2022 ANNUAL REPORT

Management’s discussion and analysis
Glossary
Allowance for credit losses
Under International Financial Reporting Standard (IFRS) 9, allowance for credit losses represents 12 months of expected credit losses (ECL) for
instruments that have not been subject to a significant increase in credit risk since initial recognition, while allowance for credit losses represents
lifetime ECL for instruments that have been subject to a significant increase in credit risk, including impaired instruments. ECL allowances for loans
and acceptances are included in Allowance for credit losses on the consolidated balance sheet. ECL allowances for fair value through other
comprehensive income (FVOCI) debt securities are included as a component of the carrying value of the securities, which are measured at fair
value. ECL allowances for other financial assets are included in the carrying value of the instrument. ECL allowances for guarantees and loan
commitments are included in Other liabilities.
Allowance for credit losses are adjusted for provisions for (reversals of) credit losses and are reduced by write-offs, net of recoveries.
Amortized cost
The amount at which a financial asset or financial liability is measured at initial recognition minus repayments, plus or minus any unamortized
origination date premiums or discounts, plus or minus any basis adjustments resulting from a fair value hedge, and minus any reduction for
impairment (directly or through the use of an allowance account). The amount of a financial asset or liability measured at initial recognition is the
cost of the financial asset or liability including capitalized transaction costs and deferred fees.
Assets under administration (AUA)
Assets administered by CIBC that are beneficially owned by clients and are, therefore, not reported on the consolidated balance sheet. The services
provided by CIBC are of an administrative nature, such as safekeeping of securities, client reporting and record keeping, collection of investment
income, and the settlement of purchase and sale transactions. In addition, assets under management (AUM) amounts are included in the amounts
reported under AUA.
Assets under management (AUM)
Assets managed by CIBC that are beneficially owned by clients and are, therefore, not reported on the consolidated balance sheet. The service
provided in respect of these assets is discretionary portfolio management on behalf of the clients.
Average interest-earning assets
Average interest-earning assets include interest-bearing deposits with banks, interest-bearing demand deposits with the Bank of Canada,
securities, cash collateral on securities borrowed or securities purchased under resale agreements, loans net of allowance for credit losses, and
certain sublease-related assets.
Basis point
One-hundredth of a percentage point (0.01%).
Collateral
Assets pledged to secure loans or other obligations, which are forfeited if the obligations are not repaid.
Collateralized debt obligation (CDO)
Securitization of any combination of corporate debt, asset-backed securities (ABS), mortgage-backed securities or tranches of other CDOs to form
a pool of diverse assets that are tranched into securities that offer varying degrees of risk and return to meet investor demand.
Collateralized loan obligation (CLO)
Securitizations of diversified portfolios of corporate debt obligations and/or ABS that are tranched into securities that offer varying degrees of risk
and return to meet investor demand.
Common shareholders’ equity
Common shareholders’ equity includes common shares, contributed surplus, retained earnings and accumulated other comprehensive income
(AOCI).
Credit derivatives
A category of financial instruments that allow one party (the beneficiary) to separate and transfer the credit risk of nonpayment or partial payment of
an underlying financial instrument to another party (the guarantor).
Credit valuation adjustment (CVA)
A valuation adjustment that is required to be considered in measuring fair value of over-the-counter (OTC) derivatives to recognize the risk that any
given derivative counterparty may not ultimately be able to fulfill its obligations. In assessing the net counterparty credit risk (CCR) exposure, we
take into account credit mitigants such as collateral, master netting arrangements, and settlements through clearing houses.
Current replacement cost
The estimated cost of replacing an asset at the present time according to its current worth.
Derivatives
A financial contract that derives its value from the performance of an underlying instrument, index or financial rate.
Dividend payout ratio
Common share dividends paid as a percentage of net income after preferred share dividends, premium on preferred share redemptions, and
distributions on other equity instruments.
CIBC 2022 ANNUAL REPORT 101

Management’s discussion and analysis
Dividend yield
Dividends per common share divided by the closing common share price.
Effective interest rate method
A method of calculating the amortized cost of a financial asset or financial liability and of allocating the interest income or interest expense over the
relevant period. The effective interest rate is the rate that exactly discounts estimated future cash payments or receipts through the expected life of
the financial instrument or, when appropriate, a shorter period, to the net carrying amount of the financial asset or financial liability.
Efficiency ratio
Non-interest expenses as a percentage of total revenue (net interest income and non-interest income).
Exchange-traded derivative contracts
Standardized derivative contracts (e.g., futures contracts and options) that are transacted on an organized exchange and cleared through a central
clearing house, and are generally subject to standard margin requirements.
Fair value
The price that would be received to sell an asset, or paid to transfer a liability, between market participants in an orderly transaction in the principal
market at the measurement date under current market conditions.
Forward contracts
A non-standardized contract to buy or sell a specified asset at a specified price and specified date in the future.
Forward rate agreement
An OTC forward contract that determines an interest rate to be paid or received commencing on a specified date in the future for a specified period.
Full-time equivalent employees
A measure that normalizes the number of full-time and part-time employees, base salary plus commissioned employees, and 100% commissioned
employees into equivalent full-time units based on actual hours of paid work during a given period, for individuals whose compensation is included
in the Employee compensation and benefits line on the consolidated statement of income.
Futures
A standardized contract to buy or sell a specified commodity, currency or financial instrument of standardized quantity and quality at a specific
price and date in the future. Futures contracts are traded on an exchange.
Guarantees and standby letters of credit
Primarily represent CIBC’s obligation, subject to certain conditions, to make payments to third parties on behalf of clients, if these clients cannot
make those payments, or are unable to meet other specified contractual obligations.
Hedge
A transaction intended to offset potential losses/gains that may be incurred in a transaction or portfolio.
Loan loss ratio
The ratio is calculated as the provision for credit losses on impaired loans to average loans and acceptances, net of allowance for credit losses.
Mark-to-market
The fair value (as defined above) at which an asset can be sold or a liability can be transferred.
Net interest income
The difference between interest earned on assets (such as loans and securities) and interest incurred on liabilities (such as deposits and
subordinated indebtedness).
Net interest margin
Net interest income as a percentage of average assets.
Net interest margin on average interest-earning assets
Net interest income as a percentage of average interest-earning assets.
Normal course issuer bid (NCIB)
Involves a listed company buying its own shares for cancellation through a stock exchange or other published market, from time to time, and is
subject to the various rules of the exchanges and securities commissions.
Notional amount
Principal amount or face amount of a financial contract used for the calculation of payments made on that contract.
Off-balance sheet financial instruments
A financial contract that is based mainly on a notional amount and represents a contingent asset or liability of an institution. Such instruments
include credit-related arrangements.
102 CIBC 2022 ANNUAL REPORT

Management’s discussion and analysis
Office of the Superintendent of Financial Institutions (OSFI)
OSFI supervises and regulates all banks, all federally incorporated or registered trust and loan companies, insurance companies, cooperative credit
associations, fraternal benefit societies, and federal pension plans in Canada.
Operating leverage
Operating leverage is the difference between the year-over-year percentage change in revenue and year-over-year percentage change in
non-interest expenses.
Options
A financial contract under which the writer (seller) confers the right, but not the obligation, to the purchaser to either buy (call option) or sell (put
option) a specified amount of an underlying asset or instrument at a specified price either at or by a specified date.
Provision for (reversal of) credit losses
An amount charged or credited to income to adjust the allowance for credit losses to the appropriate level, for both performing and impaired
financial assets. Provision for (reversal of) credit losses for loans and acceptances and related off-balance sheet loan commitments is included in
the Provision for (reversal of) credit losses line on the consolidated statement of income. Provision for (reversal of) credit losses for debt securities
measured at FVOCI or amortized cost is included in Gains (losses) from debt securities measured at FVOCI and amortized cost, net.
Return on average assets or average interest-earning assets
Net income expressed as a percentage of average assets or average interest-earning assets.
Return on common shareholders’ equity
Net income attributable to equity shareholders expressed as a percentage of average common shareholders’ equity.
Securities borrowed
Securities are typically borrowed to cover short positions. Borrowing requires the pledging of collateral by the borrower to the lender. The collateral
may be cash or a highly rated security.
Securities lent
Securities are typically lent to a borrower to cover their short positions. Borrowing requires the pledging of collateral by the borrower to the lender.
The collateral provided may be cash or a highly rated security.
Securities purchased under resale agreements
A transaction where a security is purchased by the buyer and, at the same time, the buyer commits to resell the security to the original seller at a
specific price and date in the future.
Securities sold short
A transaction in which the seller sells securities that it does not own. Initially the seller typically borrows the securities in order to deliver them to the
purchaser. At a later date, the seller buys identical securities in the market to replace the borrowed securities.
Securities sold under repurchase agreements
A transaction where a security is sold by the seller and, at the same time, the seller commits to repurchase the security from the original purchaser
at a specific price and date in the future.
Structured entities (SEs)
Entities that have been designed so that voting or similar rights are not the dominant factor in deciding who controls the entity, such as when any
voting rights relate to administrative tasks only and the relevant activities are directed by means of contractual arrangements.
Swap contracts
A financial contract in which counterparties exchange a series of cash flows based on a specified notional amount over a specified period.
Taxable equivalent basis (TEB)
The gross-up of tax-exempt revenue on certain securities to a TEB. There is an equivalent offsetting adjustment to the income tax expense.
Total shareholder return
The total return earned on an investment in CIBC’s common shares. The return measures the change in shareholder value, assuming dividends paid
are reinvested in additional shares.
CIBC 2022 ANNUAL REPORT 103

Management’s discussion and analysis
Risk and capital glossary
Advanced internal ratings-based (AIRB) approach for credit risk
Internal models based on historical experience of key risk assumptions such as probability of default (PD), loss given default (LGD) and exposure at
default (EAD) are used to compute the capital requirements subject to OSFI approval. A capital floor based on the standardized approach is also
calculated by banks under the AIRB approach for credit risk and an adjustment to risk-weighted assets (RWA) may be required as prescribed by
OSFI.
Asset/liability management (ALM)
The practice of managing risks that arise from mismatches between the assets and liabilities, mainly in the non-trading areas of the bank.
Techniques are used to manage the relative duration of CIBC’s assets (such as loans) and liabilities (such as deposits), in order to minimize the
adverse impact of changes in interest rates.
Bail-in eligible liabilities
Bail-in eligible liabilities include long-term (i.e., original maturity over 400 days), unsecured senior debt issued on or after September 23, 2018 that is
tradable and transferrable, and any preferred shares and subordinated debt that are not considered non-viability contingent capital (NVCC).
Consumer deposits, secured liabilities (including covered bonds), certain financial contracts (including derivatives) and certain structured notes are
not bail-in eligible.
Bank exposures
All direct credit risk exposures to deposit-taking institutions and regulated securities firms, and exposures guaranteed by those entities.
Business and government portfolio
A category of exposures that includes lending to businesses and governments, where the primary basis of adjudication relies on the determination
and assignment of an appropriate risk rating that reflects the credit risk of the exposure.
Central counterparty (CCP)
A clearing house that interposes itself between counterparties to clear contracts traded in one or more financial markets, becoming the buyer to
every seller and the seller to every buyer and thereby ensuring the future performance of open contracts.
Comprehensive approach for securities financing transactions
A framework for the measurement of CCR with respect to securities financing transactions, which utilizes a volatility-adjusted collateral value to
reduce the amount of the exposure.
Common Equity Tier 1 (CET1), Tier 1 and Total capital ratios
CET1, Tier 1 and total regulatory capital, divided by RWA, as defined by OSFI’s Capital Adequacy Requirements (CAR) Guideline, which is based
on Basel Committee on Banking Supervision (BCBS) standards.
Corporate exposures
All direct credit risk exposures to corporations, partnerships and proprietorships, and exposures guaranteed by those entities.
Credit risk
The risk of financial loss due to a borrower or counterparty failing to meet its obligations in accordance with contractual terms.
Drawn exposure
The amount of credit risk exposure resulting from loans and other receivables advanced to the customer.
Economic capital
Economic capital provides a framework to evaluate the returns of each strategic business unit, commensurate with risk assumed. Economic capital
is a non-GAAP risk measure based upon an internal estimate of equity capital required by the businesses to absorb unexpected losses consistent
with our targeted risk rating over a one-year horizon. Economic capital comprises primarily credit, market, operational and strategic risk capital.
Economic profit
A non-GAAP risk-adjusted performance measure used for measuring economic value added. It is calculated as earnings of each business less a
charge for the cost of capital.
Exposure at default (EAD)
An estimate of the amount of exposure to a customer at the event of, and at the time of, default.
Incremental risk charge (IRC)
A capital charge applied in addition to market risk capital specifically to cover default and migration risk in unsecuritized credit assets of varying
liquidity held in the trading book.
Internal Capital Adequacy Assessment Process (ICAAP)
A framework and process designed to provide a comprehensive view on capital adequacy, as defined by Pillar II of the Basel Accord, wherein we
identify and measure our risks on an ongoing basis in order to ensure that the capital available is sufficient to cover all risks across CIBC.
Internal models approach (IMA) for market risk
Models, which have been developed by CIBC and approved by OSFI, for the measurement of risk and regulatory capital in the trading portfolio for
general market risk, debt specific risk, and equity specific risk.
104 CIBC 2022 ANNUAL REPORT

Management’s discussion and analysis
Internal model method (IMM) for counterparty credit risk
Models, which have been developed by CIBC and approved by OSFI, for the measurement of CCR with respect to OTC derivatives.
Internal ratings-based (IRB) approach for securitization exposures
This approach comprises two calculation methods available for securitization exposures that require OSFI approval: the Internal Ratings-Based
Approach (SEC-IRBA) is available to the banks approved to use the IRB approach for underlying exposures securitized and the Internal
Assessment Approach (SEC-IAA) available for certain securitization exposures extended to asset-backed commercial paper (ABCP) programs.
Leverage ratio exposure
The leverage ratio exposure is defined under the OSFI rules as on-balance sheet assets (unweighted) less Tier 1 capital regulatory adjustments plus
derivative exposures, securities financing transaction exposures with a limited form of netting under certain conditions, and other off-balance sheet
exposures (such as commitments, direct credit substitutes, forward asset purchases, standby/trade letters of credit and securitization exposures).
Leverage ratio
Defined as Tier 1 capital divided by the leverage ratio exposure determined in accordance with guidelines issued by OSFI, which are based on
BCBS standards.
Liquidity coverage ratio (LCR)
Derived from the BCBS’s Basel III framework and incorporated into OSFI’s Liquidity Adequacy Requirements (LAR) Guideline, the LCR is a liquidity
standard that aims to ensure that an institution has an adequate stock of unencumbered high-quality liquid assets (HQLA) that consists of cash or
assets that can be converted into cash at little or no loss of value in private markets, to meet its liquidity needs for a 30-calendar-day liquidity stress
scenario.
Liquidity risk
The risk of having insufficient cash or its equivalent in a timely and cost-effective manner to meet financial obligations as they come due.
Loss given default (LGD)
An estimate of the amount of exposure to a customer that will not be recovered following a default by that customer, expressed as a percentage of
the EAD. LGD is generally based on through-the-cycle assumptions for regulatory capital purposes, and generally based on point-in-time
assumptions reflecting forward-looking information for IFRS 9 ECL purposes.
Market risk
The risk of economic and/or financial loss in our trading and non-trading portfolios from adverse changes in underlying market factors, including
interest rates, foreign exchange rates, equity market prices, commodity prices, credit spreads and customer behaviour for retail products.
Master netting agreement
An industry standard agreement designed to reduce the credit risk of multiple transactions with a counterparty through the creation of a legal right
of offset of exposures in the event of a default by that counterparty and through the provision for net settlement of all contracts through a single
payment.
Net cumulative cash flow (NCCF)
The NCCF is a liquidity horizon metric defined under OSFI’s LAR Guideline as a monitoring and supervision tool for liquidity risk that measures an
institution’s detailed cash flows in order to capture the risk posed by funding mismatches between assets and liabilities.
Net stable funding ratio (NSFR)
Derived from the BCBS’s Basel III framework and incorporated into OSFI’s LAR Guideline, the NSFR standard aims to promote long-term resilience
of the financial sector by requiring banks to maintain a sustainable stable funding profile in relation to the composition of their assets and off-balance
sheet activities.
Non-viability contingent capital (NVCC)
Effective January 1, 2013, in order to qualify for inclusion in regulatory capital, all non-common Tier 1 and Tier 2 capital instruments must be capable
of absorbing losses at the point of non-viability of a financial institution. This will ensure that investors in such instruments bear losses before
taxpayers where the government determines that it is in the public interest to rescue a non-viable bank.
Operational risk
The risk of loss resulting from people, inadequate or failed internal processes and systems, or from external events.
Other off-balance sheet exposure
The amount of credit risk exposure resulting from the issuance of guarantees and letters of credit.
Other retail
This exposure class includes all loans other than qualifying revolving retail and real estate secured personal lending that are extended to individuals
and small businesses under the regulatory capital reporting framework.
Over-the-counter (OTC) derivatives exposure
The amount of credit risk exposure resulting from derivatives that trade directly between two counterparties, rather than through exchanges.
Probability of default (PD)
An estimate of the likelihood of default for any particular customer which occurs when that customer is not able to repay its obligations as they
become contractually due. PD is based on through-the-cycle assumptions for regulatory capital purposes, and based on point-in-time assumptions
reflecting forward-looking information for IFRS 9 ECL purposes.
CIBC 2022 ANNUAL REPORT 105

Management’s discussion and analysis
Qualifying central counterparty (QCCP)
An entity that is licensed to operate as a CCP and is permitted by the appropriate regulator or oversight body to operate as such with respect to the
products offered by that CCP.
Qualifying revolving retail
This exposure class includes credit cards, unsecured lines of credit and overdraft protection products extended to individuals. Under the
standardized approach, these exposures would be included under “other retail”.
Real estate secured personal lending
This exposure class includes residential mortgages and home equity loans and lines of credit extended to individuals.
Regulatory capital
Regulatory capital, as defined by OSFI’s CAR Guideline, is comprised of CET1, Additional Tier 1 (AT1) and Tier 2 capital. CET1 capital includes
common shares, retained earnings, AOCI (excluding AOCI relating to cash flow hedges and changes in fair value option liabilities attributable to
changes in own credit risk) and qualifying instruments issued by a consolidated banking subsidiary to third parties, less regulatory adjustments for
items such as goodwill and other intangible assets, certain deferred tax assets, net assets related to defined benefit pension plans, and certain
investments. On March 27, 2020, OSFI introduced transitional arrangements for the capital treatment of expected loss provisioning, such that part of
the allowances that would otherwise be included in Tier 2 capital will instead qualify for inclusion in CET1 capital subject to certain scalars and
limitations until the end of fiscal year 2022. AT1 capital primarily includes NVCC preferred shares, Limited Recourse Capital Notes, and qualifying
instruments issued by a consolidated subsidiary to third parties. Tier 1 capital is comprised of CET1 plus AT1. Tier 2 capital includes NVCC
subordinated indebtedness, eligible general allowances, and qualifying instruments issued by a consolidated subsidiary to third parties. Total
capital is comprised of Tier 1 capital plus Tier 2 capital. Qualifying regulatory capital instruments must be capable of absorbing loss at the point of
non-viability of the financial institution.
Repo-style transactions exposure
The amount of credit risk exposure resulting from our securities bought or sold under resale agreements, as well as securities borrowing and
lending activities.
Reputation risk
The risk of negative publicity regarding CIBC’s business conduct or practices which, whether true or not, could significantly harm CIBC’s reputation
as a leading financial institution, or could materially and adversely affect CIBC’s business, operations, or financial condition.
Resecuritization
A securitization exposure in which the risk associated with an underlying pool of exposures is tranched and at least one of the underlying exposures
is a securitization exposure.
Retail portfolios
A category of exposures that primarily includes consumer but also small business lending, where the primary basis of adjudication relies on credit-
scoring models.
Risk-weighted assets (RWA)
RWA consist of three components: (i) RWA for credit risk, which are calculated using the AIRB and standardized approaches, (ii) RWA for market
risk, and (iii) RWA for operational risk. The AIRB RWA are calculated using PDs, LGDs, EADs, and in some cases maturity adjustments, while the
standardized approach applies risk weighting factors specified in the OSFI guidelines to on- and off-balance sheet exposures. The RWA for market
risk in the trading portfolio are based on the internal models approved by OSFI with the exception of the RWA for traded securitization assets where
we are using the methodology defined by OSFI. The RWA for operational risk, which relate to the risk of losses resulting from people, inadequate or
failed internal processes, and systems or from external events, are calculated under a standardized approach.
Since the introduction of Basel II in 2008, OSFI has prescribed a capital floor requirement for institutions that use the AIRB approach for credit
risk. The capital floor is determined by comparing a capital requirement calculated by reference to the Basel II standardized approach against the
Basel III calculation, as specified by OSFI. Any shortfall in the Basel III capital requirement is added to RWA.
Securitization
The process of selling assets (normally financial assets such as loans, leases, trade receivables, credit card receivables or mortgages) to trusts or
other SEs. A SE normally issues securities or other forms of interests to investors and/or the asset transferor, and the SE uses the proceeds from the
issue of securities or other forms of interest to purchase the transferred assets. The SE will generally use the cash flows generated by the assets to
meet the obligations under the securities or other interests issued by the SE, which may carry a number of different risk profiles.
Sovereign exposures
All direct credit risk exposures to governments, central banks and certain public sector entities, and exposures guaranteed by those entities.
Standardized approach for credit risk
Applied to exposures when there is not sufficient information to allow for the use of the AIRB approach for credit risk. Credit risk capital requirements
are calculated based on a standardized set of risk weights as prescribed in the CAR Guideline. The standardized risk weights are based on
external credit assessments, where available, and other risk-related factors, including export credit agencies, exposure asset class, collateral, etc.
Standardized approach for operational risk
Capital is based on prescribed percentages that vary by business activity and is applied to the three-year average gross income.
Standardized approach for securitization exposures
This approach comprises the calculation methods available for securitization exposures that do not require OSFI approval: the External Ratings-
Based Approach (SEC-ERBA) and the Standardized Approach (SEC-SA).
106 CIBC 2022 ANNUAL REPORT

Management’s discussion and analysis
Strategic risk
The risk of ineffective or improper implementation of business strategies, including mergers and acquisitions. It includes the potential financial loss
and impact to resiliency due to the failure of organic growth initiatives or failure to respond appropriately to changes in the business or industry
environments.
Stressed Value-at-Risk (VaR)
A VaR calculation using a one-year observation period related to significant losses for the given portfolio at a specified level of confidence and time
horizon.
Structural foreign exchange risk
Structural foreign exchange risk is the risk primarily inherent in net investments in foreign operations due to changes in foreign exchange rates, and
foreign currency denominated RWA and foreign currency denominated capital deductions.
Structural interest rate risk
Structural interest rate risk primarily consists of the risk arising due to mismatches in assets and liabilities, which do not arise from trading and
trading-related businesses.
Total loss absorbing capacity (TLAC) measure
The sum of Total capital and bail-in eligible liabilities (as defined above) that have a residual maturity greater than one year.
Total loss absorbing capacity ratio
Defined as TLAC measure divided by RWA determined in accordance with guidelines issued by OSFI.
Total loss absorbing capacity leverage ratio
Defined as TLAC measure divided by leverage ratio exposure determined in accordance with guidelines issued by OSFI.
Transitional arrangements for capital treatment of expected loss provisioning
On March 27, 2020, OSFI introduced transitional arrangements for ECL provisioning. These arrangements result in a portion of allowances that
would otherwise be included in Tier 2 capital qualifying for inclusion in CET1 capital. The amount of ECL allowances eligible for inclusion in CET1
capital is determined based on the increase in stage 1 and stage 2 allowances relative to balances as at January 31, 2020 as a baseline. This
amount is then adjusted for tax effects and is subject to a scaling factor that will decrease over time. The scaling factor has been set at 70% for
fiscal 2020, 50% for fiscal 2021, and 25% for fiscal 2022. For exposures under the IRB approach, the lower of this amount and excess allowances
eligible for inclusion in Tier 2 capital is included as CET1 capital under the transitional arrangements.
Undrawn exposures
The amount of credit risk exposure resulting from loans that have not been advanced to a customer, but which a customer may be entitled to draw
in the future.
Value-at-Risk (VaR)
Generally accepted risk measure that uses statistical models to estimate the distribution of possible returns on a given portfolio at a specified level
of confidence and time horizon.
CIBC 2022 ANNUAL REPORT 107

Consolidated financial statements
Consolidated financial statements
109 Financial reporting responsibility
110 Independent auditor’s report – Canadian generally accepted auditing standards
113 Report of independent registered public accounting firm – Standards of the Public Company Accounting
Oversight Board (United States)
115 Report of independent registered public accounting firm – Internal control over financial reporting
116 Consolidated balance sheet
117 Consolidated statement of income
118 Consolidated statement of comprehensive income
119 Consolidated statement of changes in equity
120 Consolidated statement of cash flows
121 Notes to the consolidated financial statements
Details of the notes to the consolidated financial statements
121 Note 1 – Basis of preparation and summary of significant
accounting policies
133 Note 2 – Fair value measurement
141 Note 3 – Significant transactions
142 Note 4 –
Securities
143 Note 5 – Loans
150 Note 6 – Structured entities and derecognition of
financial assets
154 Note 7 – Property and equipment
154 Note 8 – Goodwill, software and other intangible
assets
156 Note 9 – Other assets
157 Note 10 – Deposits
157 Note 11 – Other liabilities
157 Note 12 – Derivative instruments
161 Note 13 – Designated accounting hedges
165 Note 14 – Subordinated indebtedness
166 Note 15 – Common and preferred shares and other equity
instruments
171 Note 16 – Capital Trust securities
171 Note 17 –
Share-based payments
173 Note 18 – Post-employment benefits
178 Note 19
– Income taxes
180 Note 20 – Earnings per share
180 Note 21 – Commitments, guarantees and pledged
assets
182 Note 22 – Contingent liabilities and provisions
185 Note 23 – Concentration of credit risk
186 Note 24 – Related-party transactions
187 Note 25 – Investments in equity-accounted
associates and joint ventures
188 Note 26 – Significant subsidiaries
189 Note 27 – Financial instruments – disclosures
190 Note 28 – Offsetting financial assets and liabilities
190 Note 29 – Interest income and expense
191 Note 30 – Segmented and geographic information
193 Note 31 – Future accounting policy changes
108 CIBC 2022 ANNUAL REPORT

Consolidated financial statements
Financial reporting responsibility
Management of Canadian Imperial Bank of Commerce (CIBC) is responsible for the preparation, presentation, accuracy and reliability of the Annual
Report, which includes the consolidated financial statements and management’s discussion and analysis (MD&A). The consolidated financial
statements have been prepared in accordance with Section 308(4) of the Bank Act (Canada), which requires that the financial statements be
prepared in accordance with International Financial Reporting Standards (IFRS) as issued by the International Accounting Standards Board (IASB).
The MD&A has been prepared in accordance with the requirements of applicable securities laws.
The consolidated financial statements and MD&A contain items that reflect the best estimates and judgments of the expected effects of current
events and transactions with appropriate consideration to materiality. Financial information appearing throughout the Annual Report is consistent
with the consolidated financial statements.
Management has developed and maintained effective systems, controls and procedures to ensure that information used internally and
disclosed externally is reliable and timely. CIBC’s system of internal controls and supporting procedures are designed to provide reasonable
assurance that transactions are authorized, assets are safeguarded and proper records are maintained. These internal controls and supporting
procedures include the communication of policies and guidelines, the establishment of an organizational structure that provides appropriate and
well-defined responsibilities and accountability, and the careful selection and training of qualified staff. Management has assessed the effectiveness
of CIBC’s internal control over financial reporting as at year-end using the Internal Control – Integrated Framework issued by the Committee of
Sponsoring Organizations of the Treadway Commission (2013 framework). Based upon this assessment, we have determined that internal control
over financial reporting is effective in all material respects and CIBC is in compliance with the requirements set by the U.S. Securities and Exchange
Commission (SEC) under the U.S. Sarbanes-Oxley Act.
CIBC’s Chief Executive Officer and Chief Financial Officer have certified CIBC’s annual filings with the SEC under the U.S. Sarbanes-Oxley Act
and with the Canadian Securities Administrators under Canadian securities laws.
The Internal Audit department reviews and reports on the effectiveness of CIBC’s internal control, risk management and governance systems
and processes, including accounting and financial controls, in accordance with the audit plan approved by the Audit Committee. Our Chief Auditor
has unfettered access to the Audit Committee.
The Board of Directors oversees management’s responsibilities for financial reporting through the Audit Committee, which is composed of
independent directors. The Audit Committee reviews CIBC’s interim and annual consolidated financial statements and MD&A and recommends
them for approval by the Board of Directors. Other key responsibilities of the Audit Committee include monitoring CIBC’s system of internal control,
and reviewing the qualifications, independence and service quality of the shareholders’ auditor and the performance of CIBC’s internal auditors.
Ernst & Young LLP, the shareholders’ auditor, obtains an understanding of CIBC’s internal controls and procedures for financial reporting to
plan and conduct such tests and other audit procedures as they consider necessary in the circumstances to express their opinions in the reports
that follow. Ernst & Young LLP has unrestricted access to the Audit Committee to discuss their audit and related matters.
The Office of the Superintendent of Financial Institutions (OSFI) Canada is mandated to protect the rights and interest of depositors and
creditors of CIBC. Accordingly, OSFI examines and enquires into the business and affairs of CIBC, as deemed necessary, to ensure that the
provisions of the Bank Act (Canada) are being complied with and that CIBC is in sound financial condition.
Victor G. Dodig
President and Chief Executive Officer
Hratch Panossian
Chief Financial Officer
November 30, 2022
CIBC 2022 ANNUAL REPORT 109

Consolidated financial statements
Independent auditor’s report
To the shareholders and directors of Canadian Imperial Bank of Commerce
Opinion
We have audited the consolidated financial statements of Canadian Imperial Bank of Commerce (CIBC), which comprise the consolidated balance
sheets as at October 31, 2022 and 2021, and the consolidated statements of income, consolidated statements of comprehensive income,
consolidated statements of changes in equity and the consolidated statements of cash flows for the years then ended, and notes to the consolidated
financial statements, including a summary of significant accounting policies (collectively referred to as the “consolidated financial statements”).
In our opinion, the accompanying consolidated financial statements present fairly, in all material respects, the consolidated financial position of
CIBC as at October 31, 2022 and 2021, and its consolidated financial performance and its consolidated cash flows for the years then ended in
accordance with International Financial Reporting Standards (IFRS) as issued by the International Accounting Standards Board.
Basis for opinion
We conducted our audit in accordance with Canadian generally accepted auditing standards. Our responsibilities under those standards are further
described in the Auditor’s responsibilities for the audit of the consolidated financial statements section of our report. We are independent of CIBC in
accordance with the ethical requirements that are relevant to our audit of the consolidated financial statements in Canada, and we have fulfilled our
other ethical responsibilities in accordance with these requirements. We believe that the audit evidence we have obtained is sufficient and
appropriate to provide a basis for our opinion.
Key audit matters
Key audit matters are those matters that, in our professional judgment, were of most significance in our audit of the consolidated financial
statements of the year ended October 31, 2022. These matters were addressed in the context of our audit of the consolidated financial statements
as a whole, and in forming our opinion thereon, and we do not provide a separate opinion on these matters. For each matter below, our description
of how our audit addressed the matter is provided in that context.
We have fulfilled the responsibilities described in the Auditor’s responsibilities for the audit of the consolidated financial statements section of our
report, including in relation to these matters. Accordingly, our audit included the performance of procedures designed to respond to our assessment
of the risks of material misstatement of the consolidated financial statements. The results of our audit procedures, including the procedures
performed to address the matters below, provide the basis for our audit opinion on the accompanying consolidated financial statements.
Allowance for credit losses
Key audit matter
As described in Note 1 and Note 5 to the consolidated financial statements, CIBC has recognized $3.3 billion in expected
credit loss (ECL) allowances on its consolidated balance sheet. ECL allowances represent an unbiased and probability-
weighted amount, which is determined by evaluating a range of possible outcomes and reasonable and supportable
information about past events, current conditions, and forecasts of future economic conditions. Forward-looking
information (FLI), which involves significant judgment, is explicitly incorporated into the estimation of ECL allowances. ECL
allowances are measured at amounts equal to either (i) 12-month ECL; or (ii) lifetime ECL for those financial instruments
that have experienced a significant increase in credit risk (SICR) since initial recognition or when there is objective
evidence of impairment.
Auditing the allowance for credit losses was complex, involved significant auditor judgment, and required the involvement
of specialists due to the inherent complexity of the models, the large volume of data used, assumptions, judgments, and
the interrelationship of these variables in measuring the ECL. Significant assumptions and judgments with respect to the
estimation of the allowance for credit losses include (i) the determination of when a loan has experienced a SICR; (ii) the
forecast of FLI for multiple economic scenarios and the probability weighting of those scenarios; (iii) the calculation of both
12-month and lifetime credit losses; and (iv) the application of expert credit judgment. Management has applied a
heightened use of judgment in the areas noted above, when assessing the impact of the uncertain macroeconomic
environment on the allowance for credit losses.
How our audit
addressed the key
audit matter
We obtained an understanding, evaluated the design and tested the operating effectiveness of management’s controls
over the allowance for credit losses, with the assistance of our internal specialists. The controls we tested included,
amongst others, controls over technology, model development, validation and monitoring, economic forecasting, data
completeness and accuracy, the determination of internal risk ratings for non-retail loans, and the governance and
oversight controls over the review of the overall ECL, including the application of expert credit judgment.
To test the allowance for credit losses, amongst other procedures, we assessed, with the assistance of our credit risk
specialists, whether the methodology and assumptions used in significant models that estimate ECL are consistent with the
requirements of IFRS and industry standards. For a sample of models, our credit risk specialists reperformed the model
validation and monitoring tests performed by management. This included an assessment of the thresholds used to
determine a SICR. For a sample of FLI variables, with the assistance of our economic specialists, we evaluated
management’s forecasting methodology and compared management’s FLI to independently derived forecasts and publicly
available information. We also evaluated the scenario probability weights used in the ECL models. With the assistance of our
credit risk specialists, we also evaluated management’s methodology and governance over the application of expert credit
judgment by evaluating that the amounts recorded were reflective of underlying credit and/or economic conditions. We
tested the completeness and accuracy of data used in the measurement of the ECL by agreeing to documents and systems
and evaluated a sample of non-retail borrower risk ratings against CIBC’s risk rating scale. On a sample basis, we
recalculated the ECL to test the mathematical accuracy of management’s models. We also assessed the adequacy of the
allowance for credit loss financial statement note disclosures.
Fair value measurement of derivatives
Key audit matter As described in Note 2 and Note 12 of the consolidated financial statements, CIBC has recognized $43.0 billion in
derivative assets and $52.3 billion in derivative liabilities. The portfolio of derivative instruments is presented by level within
the fair value hierarchy, with the majority of the portfolio classified as Level 2. While derivative instruments classified as
110 CIBC 2022 ANNUAL REPORT

Consolidated financial statements
Level 1 have quoted market prices, those classified as Level 2 and 3 require valuation techniques that use observable and
non-observable market inputs and involve the application of management judgment.
Auditing the valuation of certain derivatives was complex and required the application of significant auditor judgment and
involvement of valuation specialists where the fair value was determined based on complex models and/or significant
non-observable market inputs, including any significant valuation adjustments. The inputs and modelling assumptions
used to determine fair value that were subject to significant auditor judgment included, amongst others, correlations,
volatilities and credit spreads. The valuation of derivatives is sensitive to these inputs as they are forward-looking and
could be affected by future economic and market conditions.
How our audit
addressed the key
audit matter
We obtained an understanding, evaluated the design and tested the operating effectiveness of management’s controls
over the valuation of CIBC’s derivatives portfolio, with the assistance of our internal specialists. The controls we tested
included, amongst others, controls over technology, the development and validation of models used to determine the fair
value of derivatives, controls over the independent price verification process, including the integrity of significant inputs
described above, and controls over significant valuation adjustments applied.
To test the valuation of these derivatives, our audit procedures included, amongst others, an evaluation of the
methodologies and significant inputs used by CIBC. With the assistance of our valuation specialists, we performed an
independent valuation for a sample of derivatives and valuation adjustments to assess the modelling assumptions and
significant inputs used by CIBC to estimate the fair value. We independently obtained significant inputs and assumptions
from external market data in performing our independent valuation. For a sample of models, and with the assistance of our
valuation specialists, we assessed the valuation methodologies used by CIBC to determine fair value. We also assessed
the adequacy of the disclosures related to the fair value measurement of derivatives.
Measurement of uncertain tax provisions
Key audit matter As described in Note 1 and Note 19 of the consolidated financial statements, CIBC has disclosed its significant accounting
judgments, estimates and assumptions in relation to accounting for uncertainty in income taxes. CIBC operates in a tax
environment with constantly evolving and complex tax legislation for financial institutions. Uncertainty in tax positions may
arise as tax legislation is subject to interpretation. Estimating uncertain tax provisions requires management judgment to be
applied in the interpretation of tax laws across the various jurisdictions in which CIBC operates. This includes significant
judgment in the determination of whether it is probable that CIBC’s tax filing positions will be sustained relating to certain
complex tax positions and the measurement of such provision when recognized.
Auditing CIBC’s uncertain tax provisions required the involvement of our tax professionals and the application of judgment,
including the interpretation of applicable tax legislation and jurisprudence.
How our audit
addressed the key
audit matter
With the assistance of our tax professionals, we obtained an understanding, evaluated the design and tested the operating
effectiveness of management’s controls over CIBC’s uncertain tax provisions. This included, amongst others, controls over
management’s assessment of the technical merits of tax positions and the process related to the measurement of any
related income tax provisions.
With the assistance of our tax professionals, our audit procedures included, amongst others, an assessment of the
technical merits of income tax positions taken by CIBC and the measurement of any related uncertain tax provisions
recorded. We inspected and evaluated correspondence from the relevant income tax authorities, income tax advice
obtained by CIBC from external advisors including income tax opinions, CIBC’s interpretations of tax laws and the
assessment thereof with respect to uncertain tax positions. We evaluated the reasonability of CIBC’s treatment of any new
information received during the year relating to the amounts recorded. We also assessed the adequacy of the disclosures
related to uncertain tax positions.
Other information
Management is responsible for the other information. The other information comprises:
•
Management’s Discussion and Analysis; and
• The information, other than the consolidated financial statements and our auditor’s report thereon, in the Annual Report.
Our opinion on the consolidated
financial statements does not cover the other information and we do not express any form of assurance conclusion
thereon.
In connection with our audit of the consolidated financial statements, our responsibility is to read the other information and, in doing so, consider
whether the other information is materially inconsistent with the consolidated financial statements or our knowledge obtained in the audit or
otherwise appears to be materially misstated.
We obtained Management’s Discussion and Analysis and the Annual Report prior to the date of this auditor’s report. If, based on the work we
have performed, we conclude that there is a material misstatement of this other information, we are required to report that fact in this auditor’s report.
We have nothing to report in this regard.
Responsibilities of management and those charged with governance for the consolidated financial statements
Management is responsible for the preparation and fair presentation of the consolidated financial statements in accordance with IFRS, and for such
internal control as management determines is necessary to enable the preparation of consolidated financial statements that are free from material
misstatement, whether due to fraud or error.
CIBC 2022 ANNUAL REPORT 111

Consolidated financial statements
In preparing the consolidated financial statements, management is responsible for assessing CIBC’s ability to continue as a going concern,
disclosing, as applicable, matters related to going concern and using the going concern basis of accounting unless management either intends to
liquidate CIBC or to cease operations, or has no realistic alternative but to do so.
Those charged with governance are responsible for overseeing CIBC’s financial reporting process.
Auditor’s responsibilities for the audit of the consolidated financial statements
Our objectives are to obtain reasonable assurance about whether the consolidated financial statements as a whole are free from material
misstatement, whether due to fraud or error, and to issue an auditor’s report that includes our opinion. Reasonable assurance is a high level of
assurance but is not a guarantee that an audit conducted in accordance with Canadian generally accepted auditing standards will always detect a
material misstatement when it exists. Misstatements can arise from fraud or error and are considered material if, individually or in the aggregate,
they could reasonably be expected to influence the economic decisions of users taken on the basis of these consolidated financial statements.
As part of an audit in accordance with Canadian generally accepted auditing standards, we exercise professional judgment and maintain
professional skepticism throughout the audit. We also:
• Identify and assess the risks of material misstatement of the consolidated financial statements, whether due to fraud or error, design and
perform audit procedures responsive to those risks, and obtain audit evidence that is sufficient and appropriate to provide a basis for our
opinion. The risk of not detecting a material misstatement resulting from fraud is higher than for one resulting from error, as fraud may involve
collusion, forgery, intentional omissions, misrepresentations, or the override of internal control.
• Obtain an understanding
of internal control relevant to the audit in order to design audit procedures that are appropriate in the circumstances,
but not for the purpose of expressing an opinion on the effectiveness of CIBC’s internal control.
• Evaluate the appropriateness of accounting policies used and the reasonableness of accounting estimates and related disclosures made by
management.
• Conclude on the appropriateness of management’s use of the going concern basis of accounting and, based on the audit evidence obtained,
whether a material uncertainty exists related to events or conditions that may cast significant doubt on CIBC’s ability to continue as a going
concern. If we conclude that a material uncertainty exists, we are required to draw attention in our auditor’s report to the related disclosures in the
consolidated financial statements or, if such disclosures are inadequate, to modify our opinion. Our conclusions are based on the audit evidence
obtained up to the date of our auditor’s report. However, future events or conditions may cause CIBC to cease to continue as a going concern.
• Evaluate the overall presentation, structure and content of the consolidated financial statements, including the disclosures, and whether the
consolidated financial statements represent the underlying transactions and events in a manner that achieves fair presentation.
• Obtain sufficient appropriate audit evidence regarding the financial information of the entities or business activities within CIBC to express an
opinion on the consolidated financial statements. We are responsible for the direction, supervision and performance of the group audit. We
remain solely responsible for our audit opinion.
We communicate with those charged with governance regarding, among other matters, the planned scope and timing of the audit and significant
audit findings, including any significant deficiencies in internal control that we identify during our audit.
We also provide those charged with governance with a statement that we have complied with relevant ethical requirements regarding
independence, and to communicate with them all relationships and other matters that may reasonably be thought to bear on our independence, and
where applicable, related safeguards.
From the matters communicated with those charged with governance, we determine those matters that were of most significance in the audit of the
consolidated financial statements of the current period and are therefore the key audit matters. We describe these matters in our auditor’s report
unless law or regulation precludes public disclosure about the matter or when, in extremely rare circumstances, we determine that a matter should
not be communicated in our report because the adverse consequences of doing so would reasonably be expected to outweigh the public interest
benefits of such communication.
The engagement partner on the audit resulting in this independent auditor’s report is Humayun Jafrani.
/s/ Ernst & Young LLP
Chartered Professional Accountants
Licensed Public Accountants
Toronto, Canada
November 30, 2022
112 CIBC 2022 ANNUAL REPORT

Consolidated financial statements
Report of independent registered public accounting firm
To the shareholders and directors of Canadian Imperial Bank of Commerce
Opinion on the consolidated financial statements
We have audited the accompanying consolidated balance sheets of Canadian Imperial Bank of Commerce (CIBC) as of October 31, 2022 and
2021, the related consolidated statements of income, comprehensive income, changes in equity and cash flows for the years then ended, and the
related notes (collectively referred to as the “consolidated financial statements”).
In our opinion, the consolidated financial statements present fairly, in all material respects, the consolidated financial position of CIBC at October 31,
2022 and 2021, and its consolidated financial performance and its consolidated cash flows for the years then ended in accordance with
International Financial Reporting Standards (IFRS) as issued by the International Accounting Standards Board.
We also have audited, in accordance with the standards of the Public Company Accounting Oversight Board (United States) (PCAOB), CIBC’s
internal control over financial reporting as of October 31, 2022, based on criteria established in Internal Control – Integrated Framework issued by
the Committee of Sponsoring Organizations of the Treadway Commission (2013 framework) and our report dated November 30, 2022 expressed an
unqualified opinion thereon.
Basis for opinion
These consolidated financial statements are the responsibility of CIBC’s management. Our responsibility is to express an opinion on CIBC’s
consolidated financial statements based on our audits. We are a public accounting firm registered with the PCAOB and are required to be
independent with respect to CIBC in accordance with the U.S. federal securities laws and the applicable rules and regulations of the Securities and
Exchange Commission and the PCAOB.
We conducted our audits in accordance with the standards of the PCAOB. Those standards require that we plan and perform the audit to obtain
reasonable assurance about whether the consolidated financial statements are free of material misstatement, whether due to error or fraud. Our
audits included performing procedures to assess the risks of material misstatement of the consolidated financial statements, whether due to error or
fraud, and performing procedures that respond to those risks. Such procedures included examining, on a test basis, evidence regarding the
amounts and disclosures in the consolidated financial statements. Our audits also included evaluating the accounting principles used and
significant estimates made by management, as well as evaluating the overall presentation of the consolidated financial statements. We believe that
our audits provide a reasonable basis for our opinion.
Critical audit matters
The critical audit matters communicated below are matters arising from the current period audit of the consolidated financial statements that were
communicated or required to be communicated to the audit committee and that: (1) relate to accounts or disclosures that are material to the
consolidated financial statements and (2) involved our especially challenging, subjective, or complex judgments. The communication of critical
audit matters does not alter in any way our opinion on the consolidated financial statements, taken as a whole, and we are not, by communicating
the critical audit matters below, providing separate opinions on the critical audit matters or on the accounts or disclosures to which they relate.
Allowance for credit losses
Description of the
matter
As described in Note 1 and Note 5 to the consolidated financial statements, CIBC has recognized $3.3 billion in expected
credit loss (ECL) allowances on its consolidated balance sheet. ECL allowances represent an unbiased and probability-
weighted amount, which is determined by evaluating a range of possible outcomes and reasonable and supportable
information about past events, current conditions, and forecasts of future economic conditions. Forward-looking information
(FLI), which involves significant judgment, is explicitly incorporated into the estimation of ECL allowances. ECL allowances are
measured at amounts equal to either (i) 12-month ECL; or (ii) lifetime ECL for those financial instruments that have experienced
a significant increase in credit risk (SICR) since initial recognition or when there is objective evidence of impairment.
Auditing the allowance for credit losses was complex, involved significant auditor judgment, and required the involvement of
specialists due to the inherent complexity of the models, the large volume of data used, assumptions, judgments, and the
interrelationship of these variables in measuring the ECL. Significant assumptions and judgments with respect to the estimation
of the allowance for credit losses include (i) the determination of when a loan has experienced a SICR; (ii) the forecast of FLI for
multiple economic scenarios and the probability weighting of those scenarios; (iii) the calculation of both 12-month and lifetime
credit losses; and (iv) the application of expert credit judgment. Management has applied a heightened use of judgment in the
areas noted above, when assessing the impact of the uncertain macroeconomic environment on the allowance for credit
losses.
How we
addressed the
matter in our audit
We obtained an understanding, evaluated the design and tested the operating effectiveness of management’s controls over
the allowance for credit losses, with the assistance of our internal specialists. The controls we tested included, amongst others,
controls over technology, model development, validation and monitoring, economic forecasting, data completeness and
accuracy, the determination of internal risk ratings for non-retail loans, and the governance and oversight controls over the
review of the overall ECL, including the application of expert credit judgment.
To test the allowance for credit losses, amongst other procedures, we assessed, with the assistance of our credit risk specialists,
whether the methodology and assumptions used in significant models that estimate ECL are consistent with the requirements of
IFRS and industry standards. For a sample of models, our credit risk specialists reperformed the model validation and monitoring
tests performed by management. This included an assessment of the thresholds used to determine a SICR. For a sample of FLI
variables, with the assistance of our economic specialists, we evaluated management’s forecasting methodology and compared
management’s FLI to independently derived forecasts and publicly available information. We also evaluated the scenario
probability weights used in the ECL models. With the assistance of our credit risk specialists, we also evaluated management’s
methodology and governance over the application of expert credit judgment by evaluating that the amounts recorded were
reflective of underlying credit and/or economic conditions. We tested the completeness and accuracy of data used in the
measurement of the ECL by agreeing to documents and systems and evaluated a sample of non-retail borrower risk ratings
against CIBC’s risk rating scale. On a sample basis, we recalculated the ECL to test the mathematical accuracy of management’s
models. We also assessed the adequacy of the allowance for credit loss financial statement note disclosures.
CIBC 2022 ANNUAL REPORT 113

Consolidated financial statements
Fair value measurement of derivatives
Description of the
matter
As described in Note 2 and Note 12 of the consolidated financial statements, CIBC has recognized $43.0 billion in derivative
assets and $52.3 billion in derivative liabilities. The portfolio of derivative instruments is presented by level within the fair value
hierarchy, with the majority of the portfolio classified as Level 2. While derivative instruments classified as Level 1 have quoted
market prices, those classified as Level 2 and 3 require valuation techniques that use observable and non-observable market
inputs and involve the application of management judgment.
Auditing the valuation of certain derivatives was complex and required the application of significant auditor judgment and
involvement of valuation specialists where the fair value was determined based on complex models and/or significant
non-observable market inputs, including any significant valuation adjustments. The inputs and modelling assumptions used to
determine fair value that were subject to significant auditor judgment included, amongst others, correlations, volatilities and credit
spreads. The valuation of derivatives is sensitive to these inputs as they are forward-looking and could be affected by future
economic and market conditions.
How we
addressed the
matter in our audit
We obtained an understanding, evaluated the design and tested the operating effectiveness of management’s controls over
the valuation of CIBC’s derivatives portfolio, with the assistance of our internal specialists. The controls we tested included,
amongst others, controls over technology, the development and validation of models used to determine the fair value of
derivatives, controls over the independent price verification process, including the integrity of significant inputs described
above, and controls over significant valuation adjustments applied.
To test the valuation of these derivatives, our audit procedures included, amongst others, an evaluation of the methodologies and
significant inputs used by CIBC. With the assistance of our valuation specialists, we performed an independent valuation for a
sample of derivatives and valuation adjustments to assess the modelling assumptions and significant inputs used by CIBC to
estimate the fair value. We independently obtained significant inputs and assumptions from external market data in performing
our independent valuation. For a sample of models, and with the assistance of our valuation specialists, we assessed the
valuation methodologies used by CIBC to determine fair value. We also assessed the adequacy of the disclosures related to the
fair value measurement of derivatives.
Measurement of uncertain tax provisions
Description of the
matter
As described in Note 1 and Note 19 of the consolidated financial statements, CIBC has disclosed its significant accounting
judgments, estimates and assumptions in relation to accounting for uncertainty in income taxes. CIBC operates in a tax
environment with constantly evolving and complex tax legislation for financial institutions. Uncertainty in tax positions may arise
as tax legislation is subject to interpretation. Estimating uncertain tax provisions requires management judgment to be applied
in the interpretation of tax laws across the various jurisdictions in which CIBC operates. This includes significant judgment in
the determination of whether it is probable that CIBC’s tax filing positions will be sustained relating to certain complex tax
positions and the measurement of such provision when recognized.
Auditing CIBC’s uncertain tax provisions required the involvement of our tax professionals and the application of judgment,
including the interpretation of applicable tax legislation and jurisprudence.
How we
addressed the
matter in our audit
With the assistance of our tax professionals, we obtained an understanding, evaluated the design and tested the operating
effectiveness of management’s controls over CIBC’s uncertain tax provisions. This included, amongst others, controls over
management’s assessment of the technical merits of tax positions and the process related to the measurement of any related
income tax provisions.
With the assistance of our tax professionals, our audit procedures included, amongst others, an assessment of the technical
merits of income tax positions taken by CIBC and the measurement of any related uncertain tax provisions recorded. We
inspected and evaluated correspondence from the relevant income tax authorities, income tax advice obtained by CIBC from
external advisors including income tax opinions, CIBC’s interpretations of tax laws and the assessment thereof with respect to
uncertain tax positions. We evaluated the reasonability of CIBC’s treatment of any new information received during the year
relating to the amounts recorded. We also assessed the adequacy of the disclosures related to uncertain tax positions.
/s/ Ernst & Young LLP
Chartered Professional Accountants
Licensed Public Accountants
We have served as CIBC’s auditor since 2002.
Toronto, Canada
November 30, 2022
114 CIBC 2022 ANNUAL REPORT

Consolidated financial statements
Report of independent registered public accounting firm
To the shareholders and directors of Canadian Imperial Bank of Commerce
Opinion on internal control over financial reporting
We have audited Canadian Imperial Bank of Commerce’s (CIBC) internal control over financial reporting as of October 31, 2022, based on criteria
established in Internal Control – Integrated Framework issued by the Committee of Sponsoring Organizations of the Treadway Commission (2013
framework) (the COSO criteria). In our opinion, CIBC maintained, in all material respects, effective internal control over financial reporting as of
October 31, 2022, based on the COSO criteria.
We also have audited, in accordance with the standards of the Public Company Accounting Oversight Board (United States) (PCAOB), the
consolidated balance sheets of CIBC as of October 31, 2022 and 2021, and the related consolidated statements of income, comprehensive income,
changes in equity and cash flows for the years then ended, and the related notes and our report dated November 30, 2022 expressed an
unqualified opinion thereon.
Basis for opinion
CIBC’s management is responsible for maintaining effective internal control over financial reporting and for its assessment of the effectiveness of
internal control over financial reporting included in Management’s annual report on internal control over financial reporting section contained in the
accompanying Management’s Discussion and Analysis. Our responsibility is to express an opinion on CIBC’s internal control over financial reporting
based on our audit. We are a public accounting firm registered with the PCAOB and are required to be independent with respect to CIBC in
accordance with the U.S. federal securities laws and the applicable rules and regulations of the Securities and Exchange Commission and the
PCAOB.
We conducted our audit in accordance with the standards of the PCAOB. Those standards require that we plan and perform the audit to obtain
reasonable assurance about whether effective internal control over financial reporting was maintained in all material respects.
Our audit included obtaining an understanding of internal control over financial reporting, assessing the risk that a material weakness exists, testing
and evaluating the design and operating effectiveness of internal control based on the assessed risk, and performing such other procedures as we
considered necessary in the circumstances. We believe that our audit provides a reasonable basis for our opinion.
Definition and limitations of internal control over financial reporting
A company’s internal control over financial reporting is a process designed to provide reasonable assurance regarding the reliability of financial
reporting and the preparation of financial statements for external purposes in accordance with generally accepted accounting principles. A
company’s internal control over financial reporting includes those policies and procedures that (1) pertain to the maintenance of records that, in
reasonable detail, accurately and fairly reflect the transactions and dispositions of the assets of the company; (2) provide reasonable assurance that
transactions are recorded as necessary to permit preparation of financial statements in accordance with generally accepted accounting principles,
and that receipts and expenditures of the company are being made only in accordance with authorizations of management and directors of the
company; and (3) provide reasonable assurance regarding prevention or timely detection of unauthorized acquisition, use, or disposition of the
company’s assets that could have a material effect on the financial statements.
Because of its inherent limitations, internal control over financial reporting may not prevent or detect misstatements. Also, projections of any
evaluation of effectiveness to future periods are subject to the risk that controls may become inadequate because of changes in conditions, or that
the degree of compliance with the policies or procedures may deteriorate.
/s/ Ernst & Young LLP
Chartered Professional Accountants
Licensed Public Accountants
Toronto, Canada
November 30, 2022
CIBC 2022 ANNUAL REPORT 115

Consolidated financial statements
Consolidated balance sheet
Millions of Canadian dollars, as at October 31 2022 2021
ASSETS
Cash and non-interest-bearing deposits with banks $ 31,535 $ 34,573
Interest-bearing deposits with banks 32,326 22,424
Securities
(Note 4) 175,879 161,401
Cash collateral on securities borrowed 15,326 12,368
Securities purchased under resale agreements 69,213 67,572
Loans
(Note 5)
Residential mortgages 269,706 251,526
Personal 45,429 41,897
Credit card 16,479 11,134
Business and government 188,542 150,213
Allowance for credit losses (3,073) (2,849)
517,083 451,921
Other
Derivative instruments
(Note 12) 43,035 35,912
Customers’ liability under acceptances 11,574 10,958
Property and equipment
(Note 7) 3,377 3,286
Goodwill
(Note 8) 5,348 4,954
Software and other intangible assets
(Note 8) 2,592 2,029
Investments in equity-accounted associates and joint ventures
(Note 25) 632 658
Deferred tax assets
(Note 19) 480 402
Other assets
(Note 9) 35,197 29,225
102,235 87,424
$ 943,597 $ 837,683
LIABILITIES AND EQUITY
Deposits (Note 10)
Personal $ 232,095 $ 213,932
Business and government 397,188 344,388
Bank 22,523 20,246
Secured borrowings 45,766 42,592
697,572 621,158
Obligations related to securities sold short 15,284 22,790
Cash collateral on securities lent 4,853 2,463
Obligations related to securities sold under repurchase agreements 77,171 71,880
Other
Derivative instruments
(Note 12) 52,340 32,101
Acceptances 11,586 10,961
Deferred tax liabilities
(Note 19) 45 38
Other liabilities
(Note 11) 28,072 24,923
92,043 68,023
Subordinated indebtedness
(Note 14) 6,292 5,539
Equity
Preferred shares and other equity instruments
(Note 15) 4,923 4,325
Common shares
(Note 15) 14,726 14,351
Contributed surplus 115 110
Retained earnings 28,823 25,793
Accumulated other comprehensive income (AOCI) 1,594 1,069
Total shareholders’ equity 50,181 45,648
Non-controlling interests 201 182
Total equity 50,382 45,830
$ 943,597 $ 837,683
The accompanying notes and shaded sections in “MD&A – Management of risk” are an integral part of these consolidated financial statements.
Victor G. Dodig
President and Chief Executive Officer
Mary Lou Maher
Director
116 CIBC 2022 ANNUAL REPORT

Consolidated financial statements
Consolidated statement of income
Millions of Canadian dollars, except as noted, for the year ended October 31 2022 2021
Interest income
(Note 29)
(1)
Loans $ 16,874 $ 12,150
Securities 3,422 2,141
Securities borrowed or purchased under resale agreements 1,175 319
Deposits with banks 708 131
22,179 14,741
Interest expense
(Note 29)
Deposits 7,887 2,651
Securities sold short 380 236
Securities lent or sold under repurchase agreements 943 208
Subordinated indebtedness 203 122
Other 125 65
9,538 3,282
Net interest income 12,641 11,459
Non-interest income
Underwriting and advisory fees 557 713
Deposit and payment fees 880 797
Credit fees 1,286 1,152
Card fees 437 460
Investment management and custodial fees 1,760 1,621
Mutual fund fees 1,776 1,772
Insurance fees, net of claims 351 358
Commissions on securities transactions 378 426
Gains (losses) from financial instruments measured/designated at fair value through profit or loss (FVTPL), net 1,172 607
Gains (losses) from debt securities measured at fair value through other comprehensive income (FVOCI) and amortized cost, net
35 90
Foreign exchange other than trading (FXOTT) 242 276
Income from equity-accounted associates and joint ventures
(Note 25) 47 55
Other 271 229
9,192 8,556
Total revenue 21,833 20,015
Provision for credit losses
(Note 5) 1,057 158
Non-interest expenses
Employee compensation and benefits 7,157 6,450
Occupancy costs 853 916
Computer, software and office equipment 2,297 2,030
Communications 352 318
Advertising and business development 334 237
Professional fees 313 277
Business and capital taxes 123 111
Other
(Notes 3 and 8) 1,374 1,196
12,803 11,535
Income before income taxes 7,973 8,322
Income taxes
(Note 19) 1,730 1,876
Net income $ 6,243 $ 6,446
Net income attributable to non-controlling interests $23 $ 17
Preferred shareholders and other equity instrument holders $ 171 $ 158
Common shareholders 6,049 6,271
Net income attributable to equity shareholders $ 6,220 $ 6,429
Earnings per share (EPS) (in dollars)
(Note 20)
(2)
Basic $ 6.70 $ 6.98
Diluted 6.68 6.96
Dividends per common share (in dollars)
(Note 15)
(2)
3.270 2.920
(1) Interest income included $20.0 billion for the year ended October 31, 2022 (2021: $13.2 billion) calculated based on the effective interest rate method.
(2) On April 7, 2022, CIBC shareholders approved a two-for-one share split (Share Split) of CIBC’s issued and outstanding common shares. Each shareholder of record at the
close of business on May 6, 2022 (Record Date) received one additional share on May 13, 2022 (Payment Date) for every one share held on the Record Date. All common
share numbers and per common share amounts have been adjusted to reflect the Share Split as if it was retroactively applied to all periods presented.
The accompanying notes and shaded sections in “MD&A – Management of risk” are an integral part of these consolidated financial statements.
CIBC 2022 ANNUAL REPORT 117

Consolidated financial statements
Consolidated statement of comprehensive income
Millions of Canadian dollars, for the year ended October 31 2022 2021
Net income $ 6,243 $ 6,446
Other comprehensive income (loss) (OCI), net of income tax, that is subject to subsequent reclassification to net income
Net foreign currency translation adjustments
Net gains (losses) on investments in foreign operations 4,043 (2,610)
Net gains (losses) on hedges of investments in foreign operations (2,290) 1,495
1,753 (1,115)
Net change in debt securities measured at FVOCI
Net gains (losses) on securities measured at FVOCI (784) (50)
Net (gains) losses reclassified to net income (25) (66)
(809) (116)
Net change in cash flow hedges
Net gains (losses) on derivatives designated as cash flow hedges (1,351) 178
Net (gains) losses reclassified to net income 552 (315)
(799) (137)
OCI, net of income tax, that is not subject to subsequent reclassification to net income
Net gains (losses) on post-employment defined benefit plans 198 917
Net gains (losses) due to fair value change of fair value option (FVO) liabilities attributable to
changes in credit risk 262 12
Net gains (losses) on equity securities designated at FVOCI (35) 100
425 1,029
Total OCI
(1)
570 (339)
Comprehensive income $ 6,813 $ 6,107
Comprehensive income attributable to non-controlling interests $ 23 $ 17
Preferred shareholders and other equity instrument holders $ 171 $ 158
Common shareholders 6,619 5,932
Comprehensive income attributable to equity shareholders $ 6,790 $ 6,090
(1) Includes $218 million of losses for 2022 (2021: $43 million of losses) relating to our investments in equity-accounted associates and joint ventures.
Millions of Canadian dollars, for the year ended October 31 2022 2021
Income tax (expense) benefit allocated to each component of OCI
Subject to subsequent reclassification to net income
Net foreign currency translation adjustments
Net gains (losses) on investments in foreign operations $ (136) $ 45
Net gains (losses) on hedges of investments in foreign operations 131 (53)
(5) (8)
Net change in debt securities measured at FVOCI
Net gains (losses) on securities measured at FVOCI 160 (11)
Net (gains) losses reclassified to net income 9 23
169 12
Net change in cash flow hedges
Net gains (losses) on derivatives designated as cash flow hedges 482 (64)
Net (gains) losses reclassified to net income (197) 112
285 48
Not subject to subsequent reclassification to net income
Net gains (losses) on post-employment defined benefit plans (97) (311)
Net gains (losses) due to fair value change of FVO liabilities attributable to changes in credit risk (93) (4)
Net gains (losses) on equity securities designated at FVOCI 9 (34)
(181) (349)
$ 268 $ (297)
The accompanying notes and shaded sections in “MD&A – Management of risk” are an integral part of these consolidated financial statements.
118 CIBC 2022 ANNUAL REPORT

Consolidated financial statements
Consolidated statement of changes in equity
Millions of Canadian dollars, for the year ended October 31 2022 2021
Preferred shares and other equity instruments
(Note 15)
Balance at beginning of year $ 4,325 $ 3,575
Issue of preferred shares and limited recourse capital notes (LRCNs) 1,400 750
Redemption of preferred shares (800) –
Treasury shares (2) –
Balance at end of year $ 4,923 $ 4,325
Common shares
(Note 15)
Balance at beginning of year $ 14,351 $ 13,908
Issue of common shares 401 458
Purchase of common shares for cancellation (29) –
Treasury shares 3 (15)
Balance at end of year $ 14,726 $ 14,351
Contributed surplus
Balance at beginning of year $ 110 $ 117
Compensation expense arising from equity-settled share-based awards 24 19
Exercise of stock options and settlement of other equity-settled share-based awards (20) (43)
Other 1 17
Balance at end of year $ 115 $ 110
Retained earnings
Balance at beginning of year $ 25,793 $ 22,119
Net income attributable to equity shareholders 6,220 6,429
Dividends and distributions
(Note 15)
Preferred and other equity instruments (171) (158)
Common (2,954) (2,622)
Premium on purchase of common shares for cancellation (105) –
Realized gains (losses) on equity securities designated at FVOCI reclassified from AOCI 45 27
Other (5) (2)
Balance at end of year $ 28,823 $ 25,793
AOCI, net of income tax
AOCI, net of income tax, that is subject to subsequent reclassification to net income
Net foreign currency translation adjustments
Balance at beginning of year $ 58 $ 1,173
Net change in foreign currency translation adjustments 1,753 (1,115)
Balance at end of year $ 1,811 $ 58
Net gains (losses) on debt securities measured at FVOCI
Balance at beginning of year $ 193 $ 309
Net change in debt securities measured at FVOCI (809) (116)
Balance at end of year $ (616) $ 193
Net gains (losses) on cash flow hedges
Balance at beginning of year $ 137 $ 274
Net change in cash flow hedges (799) (137)
Balance at end of year $ (662) $ 137
AOCI, net of income tax, that is not subject to subsequent reclassification to net income
Net gains (losses) on post-employment defined benefit plans
Balance at beginning of year $ 634 $ (283)
Net change in post-employment defined benefit plans 198 917
Balance at end of year $ 832 $ 634
Net gains (losses) due to fair value change of FVO liabilities attributable to changes in credit risk
Balance at beginning of year $ (28) $ (40)
Net change attributable to changes in credit risk 262 12
Balance at end of year $ 234 $ (28)
Net gains (losses) on equity securities designated at FVOCI
Balance at beginning of year $ 75 $2
Net gains (losses) on equity securities designated at FVOCI (35) 100
Realized (gains) losses on equity securities designated at FVOCI reclassified to retained earnings (45) (27)
Balance at end of year $(
5) $ 75
Total AOCI, net of income tax $ 1,594 $ 1,069
Non-controlling interests
Balance at beginning of year $ 182 $ 181
Net income attributable to non-controlling interests 23 17
Dividends (8) (9)
Other 4 (7)
Balance at end of year $ 201 $ 182
Equity at end of year $ 50,382 $ 45,830
The accompanying notes and shaded sections in “MD&A – Management of risk” are an integral part of these consolidated financial statements.
CIBC 2022 ANNUAL REPORT 119

Consolidated financial statements
Consolidated statement of cash flows
Millions of Canadian dollars, for the year ended October 31 2022 2021
Cash flows provided by (used in) operating activities
Net income $ 6,243 $ 6,446
Adjustments to reconcile net income to cash flows provided by (used in) operating activities:
Provision for credit losses 1,057 158
Amortization and impairment
(1)
1,047 1,017
Stock options and restricted shares expense 24 19
Deferred income taxes (46) (41)
Losses (gains) from debt securities measured at FVOCI and amortized cost (35) (90)
Net losses (gains) on disposal of property and equipment (6) –
Other non-cash items, net (1,126) 927
Net changes in operating assets and liabilities
Interest-bearing deposits with banks (9,902) (3,437)
Loans, net of repayments (65,000) (46,883)
Deposits, net of withdrawals 74,511 47,521
Obligations related to securities sold short (7,506) 6,827
Accrued interest receivable (959) 46
Accrued interest payable 1,228 (419)
Derivative assets (7,073) (3,172)
Derivative liabilities 20,622 1,582
Securities measured at FVTPL 4,949 (9,552)
Other assets and liabilities measured/designated at FVTPL 9,404 7,277
Current income taxes (809) 543
Cash collateral on securities lent 2,390 639
Obligations related to securities sold under repurchase agreements 3,680 (2,248)
Cash collateral on securities borrowed (2,958) (3,821)
Securities purchased under resale agreements (1,641) (1,977)
Other, net (5,379) (4,694)
22,715 (3,332)
Cash flows provided by (used in) financing activities
Issue of subordinated indebtedness 1,000 1,000
Redemption/repurchase/maturity of subordinated indebtedness (2) (1,008)
Issue of preferred shares and limited recourse capital notes, net of issuance cost 1,395 748
Redemption of preferred shares (800) –
Issue of common shares for cash 228 284
Purchase of common shares for cancellation (134) –
Net sale (purchase) of treasury shares 1 (15)
Dividends and distributions paid (2,972) (2,649)
Repayment of lease liabilities (326)
(305)
(1,610) (1,945)
Cash flows provided
by (used in) investing activities
Purchase of securities measured/designated at FVOCI and amortized cost (70,954) (49,896)
Proceeds from sale of securities measured/designated at FVOCI and amortized cost 23,183 23,917
Proceeds from maturity of debt securities measured at FVOCI and amortized cost 27,574 23,312
Acquisition of Canadian Costco credit card portfolio
(Note 3) (3,085) –
Net sale (purchase) of property, equipment, software and other intangible assets (1,109) (839)
(24,391) (3,506)
Effect of exchange rate changes on cash and non-interest-bearing deposits with banks 248 (175)
Net increase (decrease) in cash and non-interest-bearing deposits with banks during the year (3,038) (8,958)
Cash and non-interest-bearing deposits with banks at beginning of year 34,573 43,531
Cash and non-interest-bearing deposits with banks at end of year
(2)
$ 31,535 $ 34,573
Cash interest paid $ 8,310 $ 3,701
Cash interest received 20,120 13,890
Cash dividends received 1,100 897
Cash income taxes paid 2,585 1,374
(1) Comprises amortization and impairment of buildings, right-of-use assets, furniture, equipment, leasehold improvements, software and other intangible assets, and goodwill.
(2) Includes restricted cash of $493 million (2021: $446 million) and interest-bearing demand deposits with Bank of Canada.
The accompanying notes and shaded sections in “MD&A – Management of risk” are an integral part of these consolidated financial statements.
120 CIBC 2022 ANNUAL REPORT

Consolidated financial statements
Notes to the consolidated financial statements
Canadian Imperial Bank of Commerce (CIBC) is a diversified financial institution governed by the Bank Act (Canada). CIBC was formed through the
amalgamation of the Canadian Bank of Commerce and Imperial Bank of Canada in 1961. Through our four strategic business units (SBUs) –
Canadian Personal and Business Banking, Canadian Commercial Banking and Wealth Management, U.S. Commercial Banking and Wealth
Management, and Capital Markets – CIBC provides a full range of financial products and services to 13 million personal banking, business, public
sector and institutional clients in Canada, the United States (U.S.) and around the world. Refer to Note 30 for further details on our business units.
CIBC is incorporated and domiciled in Canada, with our registered and principal business offices located at CIBC SQUARE, Toronto, Ontario.
Note 1 Basis of preparation and summary of significant accounting policies
Basis of preparation
The consolidated financial statements of CIBC have been prepared in accordance with International Financial Reporting Standards (IFRS) as issued
by the International Accounting Standards Board (IASB). These consolidated financial statements also comply with Section 308(4) of the Bank Act
(Canada) and the requirements of the Office of the Superintendent of Financial Institutions (OSFI).
CIBC has consistently applied the same accounting policies throughout all periods presented.
These consolidated financial statements are presented in millions of Canadian dollars, unless otherwise indicated.
These consolidated financial statements were authorized for issue by the Board of Directors (the Board) on November 30, 2022.
Summary of significant accounting policies
The following paragraphs describe our significant accounting policies.
Use of estimates and assumptions
The preparation of the consolidated financial statements in accordance with IFRS requires management to make estimates and assumptions that
affect the recognized and measured amounts of assets, liabilities, net income, comprehensive income and related disclosures. Significant estimates
and assumptions are made in the areas of the valuation of financial instruments, allowance for credit losses, the evaluation of whether to consolidate
structured entities (SEs), leases, asset impairment, income taxes, provisions and contingent liabilities, post-employment and other long-term benefit
plan assumptions and the valuation of self-managed loyalty points programs. Actual results could differ from these estimates and assumptions.
Basis of consolidation
We consolidate entities over which we have control. We have control over another entity when we have: (i) power to direct relevant activities of the
entity; (ii) exposure, or rights, to variable returns from our involvement with the entity; and (iii) the ability to affect those returns through our power
over the entity.
Subsidiaries
Subsidiaries are entities over which CIBC has control. Generally, CIBC has control of its subsidiaries through a shareholding of more than 50% of
the voting rights, and has significant exposure to the subsidiaries based on its ownership interests of more than 50%. The effects of potential voting
rights that CIBC has the practical ability to exercise are considered when assessing whether control exists. Subsidiaries are consolidated from the
date control is obtained by CIBC and are deconsolidated from the date control is lost. Consistent accounting policies are applied for all
consolidated subsidiaries. Details of our significant subsidiaries are provided in Note 26.
Structured entities
A SE is an entity that has been designed so that voting or similar rights are not the dominant factor in deciding who controls the entity, such as when
any voting rights relate to administrative tasks only and the significant relevant activities are directed by contractual arrangements. SEs often have
some or all of the following features or attributes: (i) restricted activities; (ii) a narrow and well-defined objective, such as to securitize our own
financial assets or third-party financial assets to provide sources of funding or to provide investment opportunities for investors by passing on risks
and rewards associated with the assets of the SE to investors; (iii) insufficient equity to permit the SE to finance its activities without subordinated
financial support; or (iv) financing in the form of multiple contractually linked instruments to investors that create concentrations of credit or other
risks. Examples of SEs include securitization vehicles, asset-backed financings, and investment funds.
When voting rights are not relevant in deciding whether CIBC has power over an entity, particularly for complex SEs, the assessment of control
considers all facts and circumstances, including the purpose and design of the investee, its relationship with other parties and each party’s ability to
make decisions over significant activities, and whether CIBC is acting as a principal or as an agent.
We do not have control over an investee when we are acting as the agent for a third-party. In assessing whether we are an agent we determine
(i) the scope of our decision-making authority, (ii) the rights held by other parties, (iii) the remuneration to which we are entitled and (iv) our exposure
to variability of returns from other interests that we hold in the investee.
Consolidation conclusions are reassessed whenever there is a change in the specific facts and circumstances relevant to one or more of the
three elements of control. Factors that trigger the reassessment include, but are not limited to, significant changes in ownership structure of the
entities, changes in contractual or governance arrangements, provision of a liquidity facility beyond the original terms, transactions with the entities
that were not contemplated originally and changes in the financing structure of the entities.
Transactions eliminated on consolidation
All intercompany transactions, balances and unrealized gains and losses on transactions are eliminated on consolidation.
Non-controlling interests
Non-controlling interests are presented on the consolidated balance sheet as a separate component of equity that is distinct from CIBC’s
shareholders’ equity. The net income attributable to non-controlling interests is presented separately in the consolidated statement of income.
CIBC 2022 ANNUAL REPORT 121

Consolidated financial statements
Associates and joint ventures
We classify investments in entities over which we have significant influence, and that are neither subsidiaries nor joint ventures, as associates.
Significant influence is presumed to exist where we hold, either directly or indirectly, between 20% and 50% of the voting rights of an entity, or, in the
case of a limited partnership, where CIBC is a co-general partner. Significant influence also may exist where we hold less than 20% of the voting
rights of an entity, for example if we have influence over policy-making processes through representation on the entity’s Board of Directors, or by
other means. Where we are a party to a contractual arrangement whereby we undertake an economic activity that is subject to joint control together
with one or more parties, we classify our interest in the venture as a joint venture.
Investments in associates and interests in joint ventures are accounted for using the equity method. Under the equity method, such
investments are initially measured at cost, including attributable goodwill and intangible assets, and are adjusted thereafter for the post-acquisition
change in our share of the net assets of the investment.
In applying the equity method for an investment that has a different reporting period from that of CIBC, adjustments are made for the effects of
any significant events or transactions that occur between the reporting date of the investment and CIBC’s reporting date.
Foreign currency translation
Monetary assets and liabilities and non-monetary assets and liabilities measured at fair value that are denominated in foreign currencies are
translated into the functional currencies of operations at prevailing exchange rates at the date of the consolidated balance sheet. Revenue and
expenses are translated using average monthly exchange rates. Realized and unrealized gains and losses arising from translation into functional
currencies are included in the consolidated statement of income, with the exception of unrealized foreign exchange gains and losses on FVOCI
equity securities, which are included in AOCI.
Assets and liabilities of foreign operations with a functional currency other than the Canadian dollar, including goodwill and fair value
adjustments arising on acquisition, are translated into Canadian dollars at the exchange rates prevailing as at the consolidated balance sheet date,
while revenue and expenses of these foreign operations are translated into Canadian dollars at the average monthly exchange rates. Exchange
gains and losses arising from the translation of these foreign operations and from the results of hedging the net investment in these foreign
operations, net of applicable taxes, are included in Net foreign currency translation adjustments, in AOCI.
Any accumulated exchange gains and losses, including the impact of hedging, and any applicable taxes in AOCI are reclassified into the
consolidated statement of income when there is a disposal of a foreign operation, including a partial disposal of a foreign operation that involves the
loss of control. On partial disposal of a foreign operation that does not involve the loss of control, the proportionate share of the accumulated
exchange gains and losses, including the impact of hedging, and any applicable taxes previously recognized in AOCI are reclassified into the
consolidated statement of income.
Accounting for financial instruments
Classification and measurement of financial instruments
All financial assets must be classified at initial recognition as financial instruments mandatorily measured at FVTPL (trading and non-trading),
financial instruments measured at amortized cost, debt financial instruments measured at FVOCI, equity financial instruments designated at FVOCI,
or financial instruments designated at FVTPL (fair value option), based on the contractual cash flow characteristics of the financial assets and the
business model under which the financial assets are managed. All financial assets and derivatives are required to be measured at fair value with the
exception of financial assets measured at amortized cost. Financial assets are required to be reclassified when and only when the business model
under which they are managed has changed. All reclassifications are to be applied prospectively from the reclassification date.
The classification and measurement model requires that all debt instrument financial assets that do not meet a “solely payment of principal and
interest” (SPPI) test, including those that contain embedded derivatives, be classified at initial recognition as FVTPL. The SPPI test is conducted to
identify whether the contractual cash flows of a financial instrument are “solely payments of principal and interest” such that any variability in the
contractual cash flows is consistent with a “basic lending arrangement”. “Principal” for the purpose of this test is defined as the fair value of the
financial asset at initial recognition and may change over the life of the financial asset, for example, due to repayments of principal or amortization of
the premium/discount. “Interest” for the purpose of this test is defined as the consideration for the time value of money and credit risk, which are the
most significant elements of interest within a lending arrangement. Contractual terms that introduce a more than de minimis exposure to risks or
volatility in the contractual cash flows that are unrelated to a basic lending arrangement do not give rise to contractual cash flows that are solely
payments of principal and interest on the amount outstanding. The intent of the SPPI test is to ensure that debt instruments that contain non-basic
lending features, such as conversion options and equity-linked payouts, are measured at FVTPL.
For debt instrument financial assets that meet the SPPI test, classification at initial recognition is determined based on the business model
under which these instruments are managed. Debt instruments that are managed on a “held for trading” or “fair value” basis are classified as
FVTPL. Debt instruments that are managed on a “hold to collect and for sale” basis are classified as FVOCI for debt. Debt instruments that are
managed on a “hold to collect” basis are classified as amortized cost. We consider the following in our determination of the applicable business
model for financial assets:
I) The business purpose of the portfolio;
II) The risks that are being managed and the type of business activities that are being carried out on a day-to-day basis to manage the risks;
III) The basis on which performance of the portfolio is being evaluated; and
IV) The frequency and significance of sales activity.
All equity instrument financial assets are classified at initial recognition as FVTPL unless they are not held with the intent for short-term profit-taking
and an irrevocable designation is made to classify the instrument as FVOCI for equities.
Financial liabilities, other than derivatives, obligations related to securities sold short and FVO liabilities, are measured at amortized cost.
Derivatives, obligations related to securities sold short and FVO financial liabilities are measured at fair value.
Derivatives are measured at FVTPL, except to the extent that they are designated in a hedging relationship, in which case the International
Accounting Standard (IAS) 39 “Financial Instruments: Recognition and Measurement” (IAS 39) hedge accounting requirements continue to apply.
Financial instruments mandatorily measured at FVTPL (trading and non-trading)
Trading financial instruments are mandatorily measured at FVTPL as they are held for trading purposes
or are part of a managed portfolio with a
pattern of short-term profit-taking. Non-trading financial assets are also mandatorily measured at fair value if their contractual cash flow
characteristics do not meet the SPPI test or if they are managed together with other financial instruments on a fair value basis.
122 CIBC 2022 ANNUAL REPORT

Consolidated financial statements
Trading and non-trading financial instruments mandatorily measured at FVTPL are remeasured at fair value as at the consolidated balance
sheet date. Gains and losses realized on disposition and unrealized gains and losses from changes in fair value are included in Non-interest income
as Gains (losses) from financial instruments measured/designated at FVTPL, net. Interest income and dividends earned on trading and non-trading
securities and dividends and interest expense incurred on securities sold short are included in Interest income and Interest expense, respectively.
Financial instruments designated at FVTPL (fair value option)
Financial instruments designated at FVTPL are those that we voluntarily designate at initial recognition as instruments that we will measure at fair
value through the consolidated statement of income that would otherwise fall into a different accounting category. The FVO designation, once made,
is irrevocable and can only be applied if reliable fair values are available, when doing so eliminates or significantly reduces the measurement
inconsistency that would otherwise arise from measuring assets or liabilities on a different basis and if certain OSFI requirements pertaining to
certain loans are met. Financial liabilities may also be designated at FVTPL when they are part of a portfolio which is managed on a fair value basis,
in accordance with our investment strategy, and are reported internally on that basis. Designation at FVTPL may also be applied to financial
liabilities that have one or more embedded derivatives that would otherwise require bifurcation. We apply the FVO to certain mortgage
commitments.
Gains and losses realized on dispositions and unrealized gains and losses from changes in the fair value of FVO financial instruments are
treated in the same manner as financial instruments which are mandatorily measured at FVTPL, except that changes in the fair value of FVO
liabilities that are attributable to changes in own credit risk are recognized in OCI. Dividends and interest earned, and interest expense incurred on
FVO assets and liabilities are included in Interest income and Interest expense, respectively.
Financial assets measured at amortized cost
Financial assets measured at amortized cost are debt financial instruments with contractual cash flows that meet the SPPI test and are managed on
a “hold to collect” basis. These financial assets are recognized initially at fair value plus or minus direct and incremental transaction costs, and are
subsequently measured at amortized cost, using the effective interest rate method, net of an allowance for expected credit losses (ECL).
Loans measured at amortized cost include residential mortgages, personal loans, credit cards and most business and government loans.
Certain portfolios of treasury securities that are managed on a “hold to collect” basis are also classified as amortized cost. Most deposits with
banks, securities purchased under resale agreements, cash collateral on securities borrowed and most customers’ liability under acceptances are
accounted for at amortized cost.
Debt financial assets measured at FVOCI
Debt financial instruments measured at FVOCI are non-derivative financial assets with contractual cash flows that meet the SPPI test and are
managed on a “hold to collect and for sale” basis.
FVOCI debt instruments are measured initially at fair value, plus direct and incremental transaction costs. Subsequent to initial recognition,
FVOCI debt instruments are remeasured at fair value, with the exception that changes in ECL allowances in addition to related foreign exchange
gains or losses are recognized in the consolidated statement of income. Cumulative gains and losses previously recognized in OCI are transferred
from AOCI to the consolidated statement of income when the debt instrument is sold. Realized gains and losses on sale, determined on an average
cost basis, and changes in ECL allowances, are included in Gains (losses) from debt securities measured at FVOCI and amortized cost, net in the
consolidated statement of income. Interest income from FVOCI debt instruments is included in Interest income. FVOCI debt instruments include our
treasury securities which are managed on a “hold to collect and for sale” basis.
A debt financial instrument is classified as impaired (stage 3) when one or more events that have a detrimental impact on the estimated future
cash flows of that financial instrument have occurred after its initial recognition. Evidence of impairment includes indications that the borrower is
experiencing significant financial difficulty, or a default or delinquency has occurred.
Equity financial instruments designated at FVOCI
Equity financial instruments are measured at FVTPL unless an irrevocable designation is made to measure them at FVOCI. Gains or losses from
changes in the fair value of equity instruments designated at FVOCI, including any related foreign exchange gains or losses, are recognized in OCI.
Amounts recognized in OCI will not be subsequently recycled to profit or loss, with the exception of dividends that are not considered a return of
capital, which are recognized as interest income when received in the consolidated statement of income. Instead, cumulative gains or losses upon
derecognition of the equity instrument will be transferred within equity from AOCI to retained earnings and presented in Realized gains (losses) on
equity securities designated at FVOCI reclassified to retained earnings in the consolidated statement of changes in equity. Financial assets
designated as FVOCI include non-trading equity securities, primarily related to our investment in private companies and certain limited partnerships.
Impairment of financial assets
ECL allowances are recognized on all financial assets that are debt instruments classified either as amortized cost or FVOCI and for all loan
commitments and financial guarantees that are not measured at FVTPL. ECL allowances represent credit losses that reflect an unbiased and
probability-weighted amount which is determined by evaluating a range of possible outcomes, the time value of money and reasonable and
supportable information about past events, current conditions and forecasts of future economic conditions. Forward-looking information is explicitly
incorporated into the estimation of ECL allowances, which involves significant judgment (see Note 5 for additional details).
ECL allowances for loans and acceptances are included in Allowance for credit losses on the consolidated balance sheet. ECL allowances for
FVOCI debt securities are included as a component of the carrying value of the securities, which are measured at fair value. ECL allowances for
other financial assets are included in the carrying value of the instrument. ECL allowances for guarantees and loan commitments are included in
Other liabilities.
ECL allowances are measured at amounts equal to either: (i) 12-month ECL; or (ii) lifetime ECL for those financial instruments which have
experienced a significant increase in credit risk (SICR) since initial recognition or when there is objective evidence of impairment.
The calculation of ECL allowances is based on the expected value of three probability-weighted scenarios to measure the expected cash
shortfalls, discounted at the effective interest rate. A cash shortfall is the difference between the contractual cash flows that are due and the cash
flows that we expect to receive. The key inputs in the measurement of ECL allowances are as follows:
• The probability of default (PD) is an estimate of the likelihood of default over a given time horizon;
• The loss given default
(LGD) is an estimate of the loss arising in the case where a default occurs at a given time; and
• The exposure at default (EAD) is an estimate of the exposure at a future default date.
CIBC 2022 ANNUAL REPORT 123

Consolidated financial statements
Lifetime ECL is the expected credit losses that result from all possible default events over the expected life of a financial instrument. 12-month ECL
is the portion of lifetime expected credit losses that represent the expected credit losses that result from default events on the financial instrument
that are possible within the 12 months after the reporting date.
Stage migration and significant increase in credit risk
As a result of the requirements above, financial instruments subject to ECL allowances are categorized into three stages.
For performing financial instruments:
Stage 1 is comprised of all performing financial instruments which have not experienced a SICR since initial recognition. We recognize
12 months of ECL for stage 1 financial instruments. In assessing whether credit risk has increased significantly, we compare the risk of a default
occurring on the financial instrument as at the reporting date with the risk of a default occurring on the financial instrument as at the date of its initial
recognition.
Stage 2 is comprised of all performing financial instruments which have experienced a SICR since initial recognition. We recognize lifetime
ECL for stage 2 financial instruments. In subsequent reporting periods, if the credit risk of the financial instrument improves such that there is no
longer a SICR since initial recognition, then we revert to recognizing 12 months of ECL as the financial instrument has migrated back to stage 1.
We determine whether a financial instrument has experienced a SICR since its initial recognition on an individual financial instrument basis.
Changes in the required ECL allowance, including the impact of financial instruments migrating between stage 1 and stage 2, are recorded in
Provision for credit losses in the consolidated statement of income. Significant judgment is required in the application of SICR (see Note 5 for
additional details).
Stage 3 financial instruments are those that we have classified as impaired. We recognize lifetime ECL for all stage 3 financial instruments. We
classify a financial instrument as impaired when one or more events that have a detrimental impact on the estimated future cash flows of that
financial instrument have occurred after its initial recognition. Evidence of impairment includes indications that the borrower is experiencing
significant financial difficulties, or a default or delinquency has occurred. All financial instruments on which repayment of principal or payment of
interest is contractually 90 days in arrears are automatically considered impaired, except for credit card loans, which are classified as impaired and
are fully written off when payments are contractually 180 days in arrears or at the earlier of the notice of bankruptcy, settlement proposal, or
enlistment of credit counselling services.
A financial instrument is no longer considered impaired when all past due amounts, including interest, have been recovered, and it is
determined that the principal and interest are fully collectable in accordance with the original contractual terms or revised market terms of the
financial instrument with all criteria for the impaired classification having been remedied.
Financial instruments are written off, either partially or in full, against the related allowance for credit losses when we judge that there is no
realistic prospect of future recovery in respect of those amounts. When financial instruments are secured, this is generally after all collateral has
been realized or transferred to CIBC, or in certain circumstances, when the net realizable value of any collateral and other available information
suggests that there is no reasonable expectation of further recovery. In subsequent periods, any recoveries of amounts previously written off are
credited to the provision for credit losses.
Purchased loans
Both
purchased performing and purchased credit-impaired loans are initially measured at their acquisition date fair values. As a result of recording
these loans at fair value, no allowance for credit losses is recognized in the purchase equation at the acquisition date. Fair value is determined by
estimating the principal and interest cash flows expected to be collected and discounting those cash flows at a market rate of interest. At the
acquisition date, we classify a loan as performing where we expect timely collection of all amounts in accordance with the original contractual terms
of the loan and as credit-impaired where it is probable that we will not be able to collect all contractually required payments.
For purchased performing loans, the acquisition date fair value adjustment on each loan is amortized to interest income over the expected
remaining life of the loan using the effective interest rate method. The remaining unamortized amounts relating to those loans are recorded in
income in the period that the loan is repaid. ECL allowances are established in Provision for credit losses in the consolidated statement of income
immediately after the acquisition date based on classifying each loan in stage 1, since the acquisition date is established as the initial recognition
date of purchased performing loans for the purpose of assessing whether a SICR has occurred. Subsequent to the acquisition date, ECL
allowances are estimated in a manner consistent with our SICR and impairment policies that we apply to loans that we originate.
For purchased credit-impaired loans, the acquisition date fair value adjustment on each loan consists of management’s estimate of the shortfall
of principal and interest cash flows expected to be collected and the time value of money. The time value of money component of the fair value
adjustment is amortized to interest income over the expected remaining life of the loan using the effective interest rate method. Subsequent to the
acquisition date, we regularly re-estimate the expected cash flows for purchased credit-impaired loans. Decreases in the expected cash flows will
result in an increase in our ECL allowance. Increases in the expected cash flows will result in a recovery of the ECL allowance. ECL allowances for
purchased credit-impaired loans are reported in stage 3.
Originated credit-impaired financial assets
The accounting for originated credit-impaired financial assets operates in a similar manner to the accounting for purchased credit-impaired loans in
that originated credit-impaired assets are initially recognized at fair value with no initial ECL allowance as concerns about the collection of future
cash flows are instead reflected in the origination date discount. The time value of money component of the discount is amortized to interest income
over the expected remaining life of the financial asset using the effective interest rate method. Changes in expectation regarding the contractual
cash flows for loans are recognized immediately in Provision for credit losses and for securities are recognized in Gains (losses) from debt
securities measured at FVOCI and amortized cost, net.
This accounting generally applies to financial assets that result from debt restructuring arrangements in which a previously impaired financial
asset is exchanged for
a new financial asset that is either recognized at a fair value that represents a deep discount to par or for which there are
significant concerns over the ability to collect the contractual cash flows.
Determination of fair value
Fair value is the price that would be received to sell an asset or paid to transfer a liability between market participants in an orderly transaction in the
principal market at the measurement date under current market conditions (i.e., the exit price). Fair value measurements are categorized into three
levels within a fair value hierarchy (Level 1, 2 or 3) based upon the market observability of the valuation inputs used in measuring the fair value. See
Note 2 for more details about fair value measurement subsequent to initial recognition by type of financial instrument.
124 CIBC 2022 ANNUAL REPORT

Consolidated financial statements
Transaction costs
Transaction costs relating to financial instruments mandatorily measured or designated at FVTPL are expensed as incurred. Transaction costs are
amortized over the expected life of the instrument using the effective interest rate method for instruments measured at amortized cost, and debt
instruments measured at FVOCI. For equity instruments designated at FVOCI, transaction costs are included in the instrument’s carrying value.
Date of recognition of securities
We account for all securities transactions on our consolidated balance sheet using settlement date accounting.
Effective interest rate
Interest income and expense for all financial instruments measured at amortized cost and for debt securities measured at FVOCI are recognized in
Interest income and Interest expense using the effective interest rate method. The effective interest rate is the rate that exactly discounts estimated
future cash receipts or payments through the expected life of the financial instrument to the net carrying value of the financial asset or liability upon
initial recognition. When calculating the effective interest rate, we estimate future cash flows considering all contractual terms of the financial
instrument, but not future credit losses.
Fees relating to loan origination, including commitment, restructuring and renegotiation fees, are considered an integral part of the yield
earned on the loan and are accounted for using the effective interest rate method. Fees received for commitments that are not expected to result in
a loan are included in Non-interest income over the commitment period. Loan syndication fees are included in Non-interest income on completion of
the syndication arrangement, provided that the yield on the portion of the loan we retain is at least equal to the average yield earned by the other
lenders involved in the financing; otherwise, an appropriate portion of the fee is deferred as unearned income and amortized to interest income
using the effective interest rate method.
Interest income is recognized on stage 1 and stage 2 financial assets measured at amortized cost by applying the effective interest rate to the
gross carrying amount of the financial instrument. For stage 3 financial instruments, interest income is recognized using the rate of interest used to
discount the estimated future cash flows for the purpose of measuring the impairment loss and applied to the net carrying value of the financial
instrument.
Securitizations and derecognition of financial assets
Securitization of our own assets provides us with an additional source of liquidity. As we generally retain substantially all of the risks and rewards of
the transferred assets, assets remain on the consolidated balance sheet and funding from these transactions is accounted for as Deposits –
secured borrowings.
Securitizations to non-consolidated SEs are accounted for as sales, with the related assets being derecognized, only where:
• Our contractual right to receive cash flows from the assets has expired;
• We transfer our contractual rights to receive the cash flows of the financial asset, and have: (i) transferred substantially all the risks and
rewards of ownership, or (ii) neither retained nor transferred substantially all the risks and rewards, but have not retained control; or
• The transfer meets the criteria of a qualifying pass-through arrangement.
Derecognition of financial liabilities
A financial liability is derecognized when the obligation under the liability is discharged, cancelled or expires. If an existing financial liability is
replaced by another liability from the same lender on substantially different terms, or the terms of the existing liability are substantially modified, such
an exchange or modification is treated as a derecognition of the original liability and a recognition of a new liability, and the difference in the
respective carrying values is recognized in the consolidated statement of income. The repurchase of a debt instrument is considered an
extinguishment of that debt instrument even if we intend to resell the instrument in the near term.
Financial guarantees
Financial guarantees are financial contracts that require the issuer to make specified payments to reimburse the holder for a loss it incurs because a
specified debtor fails to make payment when due in accordance with the original or modified terms of a debt instrument.
Financial guarantee contracts issued by CIBC that are not classified as insurance contracts are initially recognized as a liability at fair value,
adjusted for transaction costs that are directly attributable to the issuance of the guarantees, which is generally the premium received or receivable
on the date the guarantee was given. Subsequently, financial guarantee liabilities are measured at the higher of the initial fair value, less cumulative
amortization, and the applicable ECL allowances. A financial guarantee that qualifies as a derivative is remeasured at fair value as at each reporting
date and reported as Derivative instruments in assets or liabilities, as appropriate.
Mortgage commitments
Mortgage interest rate commitments are extended to our retail clients in contemplation of borrowing to finance the purchase of homes under
mortgages to be funded by CIBC in the future. These commitments are usually for periods of up to 120 days and generally entitle the borrower to
receive funding at the lower of the interest rate at the time of the commitment and the rate applicable at the funding date. We use financial
instruments, such as interest rate derivatives, to economically hedge our exposure to an increase in interest rates. Based on our estimate of the
commitments expected to be exercised, a financial liability would be recognized on our consolidated balance sheet, to which we apply the FVO. We
also carry the associated economic hedges at fair value on the consolidated balance sheet. Changes in the fair value of the FVO commitment liability
and the associated economic hedges are included in Gains (losses) from financial instruments measured/designated at FVTPL, net. In addition, since
the fair value of the commitments is priced into the mortgage, the difference between the mortgage amount and its fair value at funding is recognized
in the consolidated statement of income to offset the carrying value of the mortgage commitment that is released upon its expiry.
Offsetting of financial assets and financial liabilities
Financial assets and financial liabilities are offset, and the amount presented net, when we have a legally enforceable right to set off the recognized
amounts and intend to settle on a net basis or to realize the asset and settle the liability simultaneously.
CIBC 2022 ANNUAL REPORT 125

Consolidated financial statements
Acceptances and customers’ liability under acceptances
Acceptances constitute a liability of CIBC on negotiable instruments issued to third parties by our customers. We earn a fee for guaranteeing and
then making the payment to the third parties. The amounts owed to us by our customers in respect of these guaranteed amounts are reflected in
assets as Customers’ liability under acceptances.
Securities purchased under resale agreements and obligations related to securities sold under repurchase agreements
Securities purchased under resale agreements are treated as collateralized lending transactions as they represent the purchase of securities
affected with a simultaneous agreement to sell them back at a future date at a fixed price, which is generally near term. Securities subject to these
transactions include certain loans that are readily securitizable. The agreements include certain total return swap arrangements that are
economically equivalent to resale agreements. These transactions are classified and measured at amortized cost, as they meet the SPPI criteria and
are managed under a hold to collect business model, unless they were classified at FVTPL or designated under the FVO. For Securities purchased
under resale agreements that are classified at amortized cost, an ECL is applied. Interest income is accrued using the effective interest rate method
and is included in Interest income – Securities borrowed or purchased under resale agreements in the consolidated statement of income.
Similarly, securities sold under agreements to repurchase are treated as collateralized borrowing transactions at amortized cost with interest
expense accrued using the effective interest rate method and are included in Interest expense – Securities lent or sold under repurchase
agreements in the consolidated statement of income. Certain obligations related to securities sold under repurchase agreements are designated at
FVTPL under the FVO.
Cash collateral on securities borrowed and securities lent
The right to receive back cash collateral paid and the obligation to return cash collateral received on borrowing and lending of securities, which is
generally near term, is recognized as cash collateral on securities borrowed and securities lent, respectively. These transactions are classified and
measured at amortized cost as they meet the SPPI criteria and are managed under a hold to collect business model. For Cash collateral on
securities borrowed classified at amortized cost, an ECL is applied. Interest income on cash collateral paid and interest expense on cash collateral
received together with the security borrowing fees and security lending income are included in Interest income – Securities borrowed or purchased
under resale agreements and Interest expense – Securities lent or sold under repurchase agreements, respectively. For securities borrowing and
lending transactions where securities are pledged or received as collateral, securities pledged by CIBC remain on the consolidated balance sheet
and securities received by CIBC are not recognized on the consolidated balance sheet.
Derivatives
We use derivative instruments for both asset/liability management (ALM) and trading purposes. The derivatives used for ALM purposes allow us to
manage financial risks, such as movements in interest and foreign exchange rates, while our derivative trading activities are primarily driven by
client activities. We may also take proprietary trading positions within prescribed risk limits with the objective of earning income.
All derivative instruments are recognized initially, and are measured subsequently, at fair value and are reported as assets where they have a
positive fair value and as liabilities where they have a negative fair value, in both cases as derivative instruments. Any realized and unrealized gains
or losses on derivatives used for trading purposes are recognized immediately in Gains (losses) from financial instruments measured/designated at
FVTPL, net. The accounting for derivatives used for ALM purposes depends on whether they qualify for hedge accounting as discussed below.
Fair values of exchange-traded derivatives are based on quoted market prices. Fair values of over-the-counter (OTC) derivatives, including
OTC derivatives that are centrally cleared, are obtained using valuation techniques, including discounted cash flow models and option pricing
models. See Note 12 for further information on the valuation of derivatives.
Derivatives used for ALM purposes that qualify for hedge accounting
As permitted at the time of transition to IFRS 9 “Financial Instruments” (IFRS 9), we previously elected to continue to apply the hedge accounting
requirements of IAS 39.
We apply hedge accounting for derivatives held for ALM purposes that meet specified criteria. There are three types of hedges: fair value,
cash flow and hedges of net investments in foreign operations (NIFOs). When hedge accounting is not applied, the change in the fair value of the
derivative is recognized in the consolidated statement of income (see “Derivatives used for ALM purposes that are not designated for hedge
accounting” below).
In order for derivatives to qualify for hedge accounting, the hedge relationship must be designated and formally documented at its inception in
accordance with IAS 39. The particular risk management objective and strategy, the specific asset, liability or cash flow being hedged, as well as
how hedge effectiveness is assessed, are documented. Hedge effectiveness requires a high correlation of changes in fair values or cash flows
between the hedged and hedging items.
We assess the effectiveness of derivatives in hedging relationships, both at inception and on an ongoing basis. Ineffectiveness results to the
extent that the change in the fair value of the hedging derivative differs from the change in the fair value of the hedged risk in the hedged item, or
the cumulative change in the fair value of the hedging derivative exceeds the cumulative change in the fair value of expected future cash flows of
the hedged item. The amount of ineffectiveness of hedging instruments is recognized immediately in the consolidated statement of income.
Interest Rate Benchmark Reform
In response to interest rate benchmark reform, the IASB issued “Interest Rate Benchmark Reform: Amendments to IFRS 9, IAS 39 and IFRS 7”
(Phase 1 amendments) in September 2019, and “Interest Rate Benchmark Reform: Phase 2 Amendments to IFRS 9, IAS 39, IFRS 7, IFRS 4, and
IFRS 16” (Phase 2 amendments) in August 2020. Only the amendments to the classification and measurement sections of IFRS 9, the hedge
accounting sections of IAS 39 “Financial Instruments: Recognition and Measurement” (IAS 39), IFRS 7 “Financial Instruments: Disclosures”, IFRS 4
“Insurance Contracts”, and IFRS 16 “Leases” apply to us since we elected to continue to apply the hedge accounting requirements of IAS 39 upon
the adoption of IFRS 9 “Financial Instruments” (IFRS 9). We adopted the Phase 1 and Phase 2 amendments effective November 1, 2019 and
November 1, 2020, respectively.
During the period prior to the replacement of Interbank Offered Rates (IBORs), the Phase 1 amendments allow us to continue hedge accounting
by assuming that the interest rate benchmarks which are the basis for the hedged risk, the cash flows of the hedged item or the hedging instrument
are not altered as a result of the reform. For the bank’s cash flow hedges of forecast transactions that are directly impacted by IBOR reform, for the
purpose of assessing whether a forecast transaction is highly probable or expected to occur, the amendments allow us to assume that the
benchmark interest rate on which the hedged cash flows are based is not altered as a result of IBOR reform. Phase 1 amendments also provide
temporary exceptions to allow hedge accounting to continue if a hedge relationship does not meet certain hedge effectiveness assessment solely as
a result of IBOR reform.
The Phase 2 amendments address issues once an existing rate is replaced with an alternative rate. The amendments provide temporary relief
that allows for hedging relationships to continue upon the replacement of an existing interest rate benchmark with an alternative rate under certain
126 CIBC 2022 ANNUAL REPORT

Consolidated financial statements
qualifying conditions. The amendments also allow us to redefine the hedged risk to an alternative rate, and to amend the description of the hedged
item and the hedging instrument, and the description of how we will assess hedge effectiveness to reflect changes required by the reform without
discontinuing the hedge relationship. The amendments also provide temporary relief that allows us to designate an alternative rate as a risk
component to hedge provided that we reasonably expect that the alternative rate will become separately identifiable within 24 months of its first
designation.
See the “Interest Rate Benchmark Reform” section below for further detail.
Fair value hedges
We designate fair value hedges primarily as part of interest rate risk management strategies that use derivatives to hedge changes in the fair value
of financial instruments with fixed interest rates. Changes in fair value attributed to the hedged interest rate risk are accounted for as basis
adjustments to the hedged financial instruments and are included in Net interest income. Changes in fair value from the hedging derivatives are also
included in Net interest income. Any differences between the two represent hedge ineffectiveness that is included in Net interest income.
Similarly, for hedges of foreign exchange risk, changes in the fair value from the hedging derivatives and non-derivatives are included in
FXOTT. Changes in the fair value of the hedged item from the hedged foreign exchange risk are accounted for as basis adjustments and are also
included in FXOTT. Any difference between the two represents hedge ineffectiveness.
If the hedging instrument expires or is sold, terminated or exercised, or where the hedge no longer meets the criteria for hedge accounting, the
hedge relationship is terminated and the basis adjustment applied to the hedged item is amortized over the remaining term of the hedged item. If
the hedged item is derecognized, the unamortized basis adjustment is recognized immediately in the consolidated statement of income.
Cash flow hedges
We designate cash flow hedges as part of interest rate risk management strategies that use derivatives to mitigate our risk from variable cash flows
by effectively converting certain variable-rate financial instruments to fixed-rate financial instruments, and as part of foreign exchange rate risk
management strategies to hedge forecasted foreign currency denominated cash flows. We also designate cash flow hedges to hedge changes in
CIBC’s share price in respect of certain cash-settled share-based payment awards.
The effective portion of the change in fair value of the derivative instrument is recognized in OCI until the variability in cash flows being hedged
is recognized in the consolidated statement of income in future accounting periods, at which time an appropriate portion of the amount that was in
AOCI is reclassified into the consolidated statement of income. The ineffective portion of the change in fair value of the hedging derivative is
included in Net interest income, FXOTT, or Non-interest expenses immediately as it arises.
If the hedging instrument expires or is sold, terminated or exercised, or where the hedge no longer meets the criteria for hedge accounting, the
hedge relationship is terminated. Upon termination of the hedge relationship, any remaining amount in AOCI remains therein until it is recognized in
the consolidated statement of income when the variability in cash flows hedged or the hedged forecast transaction is ultimately recognized in the
consolidated statement of income. When the forecasted transaction is no longer expected to occur, the related cumulative gain or loss in AOCI is
recognized immediately in the consolidated statement of income.
Hedges of NIFOs with a functional currency other than the Canadian dollar
We may designate NIFO hedges to mitigate the foreign exchange risk on our NIFOs with a functional currency other than the Canadian dollar.
These hedges are accounted for in a similar manner to cash flow hedges. The change in fair value of the hedging instrument relating to the
effective portion is recognized in OCI. The change in fair value of the hedging instrument attributable to the forward points and relating to the
ineffective portion is recognized immediately in FXOTT. Gains and losses in AOCI are reclassified to the consolidated statement of income upon the
disposal or partial disposal of the investment in the foreign operation that involves the loss of control, as explained in the “Foreign currency
translation” policy above.
Derivatives used for ALM purposes that are not designated for hedge accounting
The change in fair value of the derivatives not designated as accounting hedges but used to economically hedge FVO assets or liabilities is
included in Gains (losses) from financial instruments measured/designated at FVTPL, net. The change in fair value of other derivatives not
designated as accounting hedges but used for other economic hedging purposes is included in Non-interest income as FXOTT or Other, as
appropriate, or in the case of economic hedges of cash-settled share-based payment obligations, in compensation expense.
Embedded derivatives
Derivatives embedded in financial liabilities are accounted for as separate derivatives when their economic characteristics and risks are not closely
related to those of the host instrument and the terms of the embedded derivative represent those of a freestanding derivative in situations where the
combined instrument is not classified as FVTPL or FVO. These embedded derivatives, which are classified together with the host instrument on the
consolidated balance sheet, are measured at fair value, with changes therein included in the consolidated statement of income. The residual
amount of the host liability is accreted to its maturity value through Interest income and Interest expense, respectively, using the effective interest
rate method.
Gains at inception on derivatives embedded in financial instruments bifurcated for accounting purposes are not recognized at inception;
instead they are recognized over the life of the residual host instrument. Where an embedded derivative is separable from the host instrument but
the fair value, as at the acquisition or reporting date, cannot be reliably measured separately or is otherwise not bifurcated, the entire combined
contract is measured at FVTPL.
Financial assets with embedded derivatives are classified in their entirety into the appropriate classification at initial recognition through an
assessment of the contractual cash flow characteristics of the asset and the business model under which it is managed.
Accumulated other comprehensive income
AOCI is included on the consolidated balance sheet as a separate component of total equity, net of income tax. It includes net unrealized gains and
losses on FVOCI debt and equity securities, the effective portion of gains and losses on derivative instruments designated within effective cash flow
hedges under IAS 39, unrealized foreign currency translation gains and losses on foreign operations with a functional currency other than the
Canadian dollar net of gains or losses on related hedges, net gains (losses) related to fair value changes of FVO liabilities attributable to changes in
own credit risk, and net gains (losses) on post-employment defined benefit plans.
Treasury shares
Where we repurchase our own equity instruments, these instruments are treated as treasury shares and are deducted from equity at their cost with
any gain or loss recognized in Contributed surplus or Retained earnings as appropriate. No gain or loss is recognized in the consolidated statement
CIBC 2022 ANNUAL REPORT 127

Consolidated financial statements
of income on the purchase, sale, issue or cancellation of our own equity instruments. Any difference between the carrying value and the
consideration, if reissued, is also included in Contributed surplus.
Liabilities and equity
We classify financial instruments as a liability or equity based on the substance of the contractual arrangement. An instrument is classified as a
liability if it is a contractual obligation to deliver cash or another financial asset, or to exchange financial assets or financial liabilities at potentially
unfavourable terms. A contract is also classified as a liability if it is a non-derivative and could obligate us to deliver a variable number of our own
shares or it is a derivative other than one that can be settled by the delivery of a fixed amount of cash or another financial asset for a fixed number of
our own equity instruments. An instrument is classified as equity if it evidences a residual interest in our assets after deducting all liabilities. The
components of a compound financial instrument are classified and accounted for separately as assets, liabilities, or equity as appropriate.
Incremental costs directly attributable to the issuance of equity instruments are shown in equity, net of income tax.
Property and equipment
Land is recognized initially at cost and is subsequently measured at cost less any accumulated impairment losses. Buildings, furniture, equipment
and leasehold improvements are recognized initially at cost and are subsequently measured at cost less accumulated depreciation and any
accumulated impairment losses.
Depreciation commences when the assets are available for use and is recognized on a straight-line basis to depreciate the cost of these
assets to their estimated residual value over their estimated useful lives. The estimated useful lives are as follows:
• Buildings – 40 years
• Computer equipment – 3 to 7 years
• Office furniture, equipment and other – 4 to 15 years
• Leasehold improvements – over the lesser of the estimated useful life of the asset and the lease term, including reasonably assured renewal
periods
Depreciation methods, useful lives and residual values are reviewed at each annual reporting date and are adjusted if appropriate.
Gains and losses on disposal are included in Non-interest income – Other.
Leases
As a lessee, we recognize a right-of-use asset and a corresponding lease liability based on the present value of future lease payments, less any
lease incentives receivable, when the lessor makes the leased asset available for use to CIBC, based on the non-cancellable portion of the lease
term, adjusted for any renewal or termination options that are reasonably certain to be exercised. Measurement of the right-of-use asset also
includes any initial direct costs of procuring the lease, any lease payments made or lease incentives received prior to lease commencement, and
the estimated cost of remediating the underlying asset at the end of the lease term. Discount rates are based on the rate implicit in the lease, if
determinable, or on CIBC’s incremental borrowing rate. Where a property lease contains both a lease and non-lease component, we have elected
not to allocate the consideration in the contract to each of the components. Subsequent to initial measurement, CIBC measures the lease liability by
increasing the carrying amount to reflect interest on the lease liability based on the discount rate at the time of recognition and reducing the carrying
amount to reflect lease payments made during the period, net of any remeasurements for lease reassessment or modifications. The right-of-use
asset is measured using the cost model, and amortized on a straight-line basis over the lease term. Right-of-use assets and the corresponding
lease liabilities, including asset retirement obligations, are recognized in Property and equipment and Other liabilities, respectively, on our
consolidated balance sheet.
The right-of-use asset and the corresponding lease liability are remeasured when there is a change in lease term, a change in the assessment
of an option to purchase a leased asset, a change in the expected residual value guarantee (if any), or a change in future lease payments due to a
change in the index or rate applicable to the payment. Right-of-use assets are tested for impairment as required under IAS 36 “Impairment of
Assets” (IAS 36). Refer to the “Impairment of non-financial assets” policy below. In addition, the evaluation of the useful life for depreciation is
assessed under IAS 16 “Property, Plant and Equipment” (IAS 16).
Lease payments for low-value assets, short-term leases and variable leases are systematically recognized in Non-interest expenses based on
the nature of the expense.
As an intermediate lessor, we classify a sublease as an operating or finance sublease based on whether substantially all of the risks and
rewards related to the underlying right-of-use asset are transferred to the sub-lessee. If classified as a finance sublease, the related right-of-use
asset is derecognized and an investment in sublease is recognized, with the difference recognized in the consolidated statement of income as a
gain or loss. In measuring the investment in sublease, we apply the head lease discount rate unless the rate implicit in the sublease is determinable.
Where a finance sublease includes lease and non-lease components, we allocate the total consideration in the contract to each component based
on the standalone prices for each of these components. The investment in sublease is recognized in Other assets on our consolidated balance
sheet, and is subsequently measured using the effective interest rate method, with interest income recognized over the term of the sublease. Rental
income from operating subleases is recognized on a systematic basis over the lease term.
Goodwill, software and other intangible assets
Goodwill represents the excess of the purchase price over the fair value of the net identifiable assets, liabilities and contingent liabilities acquired in
business combinations. Identifiable intangible assets are recognized separately from goodwill when they are separable or arise from contractual or
other legal rights, and have fair values that can be reliably measured.
Goodwill is not amortized, but is subject to impairment review at least annually or more frequently if there are indicators that the goodwill may
be impaired. Refer to the “Impairment of non-financial assets” policy below.
Intangible assets represent software and customer relationships, core deposit intangibles, investment management contracts, and brand
names recognized as part of past acquisitions. Intangible assets with definite useful lives are measured at cost less accumulated amortization and
accumulated impairment losses. Each intangible asset is assessed for legal, regulatory, contractual, competitive or other factors to determine if the
useful life is definite. Intangible assets with definite useful lives are amortized over their estimated useful lives, which are as follows:
• Software – 5 to 10 years
• Contract-based intangibles – 8 to 15 years
• Core deposit and customer relationship intangibles – 3 to 16 years
128 CIBC 2022 ANNUAL REPORT

Consolidated financial statements
Intangible assets with indefinite useful lives are measured at cost less any accumulated impairment losses. Indefinite-life intangible assets are
tested for impairment at least annually and whenever there is an indication that the asset may be impaired. Refer to the “Impairment of non-financial
assets” policy below.
Impairment of non-financial assets
The carrying values of non-financial assets with definite useful lives, including right-of-use assets, buildings and equipment, and intangible assets
with definite useful lives are reviewed to determine whether there is any indication of impairment. Goodwill and intangible assets with indefinite
useful lives are tested for impairment at least annually, and whenever there is an indication that the asset may be impaired. If any such indication of
impairment exists, the recoverable amount of the asset is estimated in order to determine the extent of the impairment loss, if any.
For the purpose of reviewing non-financial assets with definite useful lives for impairment, asset groups are reviewed at their lowest level for
which identifiable cash inflows are largely independent of cash inflows of other assets or groups of assets. This grouping is referred to as a cash-
generating unit (CGU).
Corporate assets do not generate separate cash inflows. Corporate assets are tested for impairment at the minimum collection of CGUs to
which the corporate asset can be allocated reasonably and consistently.
The recoverable amount is the greater of fair value less costs to sell and value in use. Value in use is the present value of the future cash flows
expected to be derived from the asset or CGU. When the carrying value exceeds its recoverable amount, an impairment loss equal to the difference
between the two amounts is recognized in the consolidated statement of income. If an impairment subsequently reverses, the carrying value of the
asset is increased to the extent that the carrying value of the underlying assets does not exceed the carrying value that would have been
determined, net of depreciation or amortization, if no impairment had been recognized. Any impairment reversal is recognized in the consolidated
statement of income in the period in which it occurs.
Goodwill is assessed for impairment based on the group of CGUs expected to benefit from the synergies of the business combination, and the
lowest level at which management monitors the goodwill. Any potential goodwill impairment is identified by comparing the recoverable amount of
the CGU grouping to which the goodwill is allocated to its carrying value including the allocated goodwill. If the recoverable amount is less than its
carrying value, an impairment loss is recognized in the consolidated statement of income in the period in which it occurs. Impairment losses on
goodwill are not subsequently reversed if conditions change.
Income taxes
Income tax comprises current tax and deferred tax. Income tax is recognized in the consolidated statement of income, except to the extent that it
relates to items recognized in OCI or directly in equity, in which case it is recognized accordingly.
Current tax is the tax expected to be payable on the taxable profit for the year, calculated using tax rates enacted or substantively enacted as
at the reporting date, and any adjustment to tax payable in respect of previous years. Current tax assets and liabilities are offset when CIBC intends
to settle on a net basis and the legal right to offset exists.
Deferred tax is recognized on temporary differences between the carrying value of assets and liabilities on the consolidated balance sheet
and the corresponding amounts attributed to such assets and liabilities for tax purposes. Deferred tax liabilities are generally recognized for all
taxable temporary differences unless the temporary differences relate to our NIFOs and will not reverse in the foreseeable future. Deferred tax
assets, other than those arising from our NIFOs, are recognized to the extent that it is probable that future taxable profits will be available against
which deductible temporary differences can be utilized. Deferred tax assets arising from our NIFOs are recognized for deductible temporary
differences which are expected to reverse in the foreseeable future to the extent that it is probable that future taxable profits will be available against
which these deductible temporary differences can be utilized. Deferred tax is not recognized for temporary differences on the initial recognition of
assets or liabilities in a transaction that is not a business combination and that affects neither accounting nor taxable income, or for taxable
temporary differences arising on the initial recognition of goodwill.
Deferred tax is measured at the tax rates that are expected to be applied to the temporary differences when they reverse, based on the laws
that have been enacted or substantively enacted as at the reporting date.
Deferred tax assets and liabilities are offset when there is a legally enforceable right to offset current tax assets and liabilities and they relate to
income taxes levied by the same tax authority on the same taxable entity, or on different taxable entities which intend to settle current tax liabilities
and assets on a net basis or to realize the asset and settle the liability simultaneously.
We are subject to income tax laws in the various jurisdictions where we operate, and the tax laws in those jurisdictions are potentially subject to
different interpretations by us and the relevant taxation authority, which gives rise to uncertainty. For tax positions where there is uncertainty
regarding the ultimate determination of the tax impact, including positions which are under audit, dispute or appeal, we recognize provisions to
consider this uncertainty based on our best estimate of the amount expected to be paid based on an assessment of the relevant factors.
Pension and other post-employment benefits
We are the sponsor of a number of employee benefit plans. These plans include both defined benefit and defined contribution pension plans, and
various other post-employment benefit plans including post-retirement medical and dental benefits.
Defined benefit plans
The cost of pensions and other post-employment benefits earned by employees is actuarially determined separately for each plan using the
projected unit credit method and our best estimate of salary escalation, retirement ages of employees, mortality and expected health-care costs.
This represents CIBC’s defined benefit obligation, which is measured as at the reporting date. The discount rate used to measure the defined
benefit obligation is based on the yield of a portfolio of high-quality corporate bonds denominated in the same currency in which the benefits are
expected to be paid and with terms to maturity that, on average, match the terms of the defined benefit obligation.
Plan assets are measured at fair value as at the reporting date.
The net defined benefit asset (liability) represents the present value of the defined benefit obligation less the fair value of plan assets. The net
defined benefit asset (liability) is included in Other assets and Other liabilities, respectively.
Current service cost reflects the cost of providing post-employment benefits earned by employees in the current period. Current service cost is
calculated as the present value of the benefits attributed to the current year of service and is recognized in the consolidated statement of income.
The current service cost is calculated using a separate discount rate to reflect the longer duration of future benefit payments associated with the
additional year of service to be earned by the plan’s active participants.
Past service costs arising from plan amendments or curtailments are recognized in net income in the period in which they arise.
Net interest income or expense comprises interest income on plan assets and interest expense on the defined benefit obligation. Interest
income is calculated by applying the discount rate to the plan assets, and interest expense is calculated by applying the discount rate to the
defined benefit obligation. Net interest income or expense is recognized in the consolidated statement of income.
CIBC 2022 ANNUAL REPORT 129

Consolidated financial statements
Actuarial gains and losses represent changes in the present value of the defined benefit obligation which result from changes in actuarial
assumptions and differences between previous actuarial assumptions and actual experience, and from differences between the actual return on
plan assets and assumed interest income on plan assets. Net actuarial gains and losses are recognized in OCI in the period in which they arise and
are not subject to subsequent reclassification to net income. Cumulative net actuarial gains and losses are included in AOCI.
When the calculation results in a net defined benefit asset, the recognized asset is limited to the present value of economic benefits available in the
form of future refunds from the plan or reductions in future contributions to the plan (the asset ceiling). For plans where we do not have an unconditional
right to a refund of surplus, we determine the asset ceiling by reference to future economic benefits available in the form of reductions in future
contributions to the plan, in which case the present value of economic benefits is calculated giving consideration to minimum funding requirements for
future service that apply to the plan. Where a reduction in future contributions to the plan is not currently realizable at the reporting date, we estimate
whether we will have the ability to reduce contributions for future service at some point during the life of the plan by taking into account, among other
things, expected future returns on plan assets. If it is anticipated that we will not be able to recover the value of the net defined benefit asset, after
considering minimum funding requirements for future service, the net defined benefit asset is reduced to the amount of the asset ceiling.
When the payment in the future of minimum funding requirements related to past service would result in a net defined benefit surplus, or an
increase in a net defined benefit surplus, the minimum funding requirements are recognized as a liability to the extent that the surplus would not be
fully available as a refund or a reduction in future contributions. Any funded status surplus is limited to the present value of future economic benefits
available in the form of refunds from the plan or reductions in future contributions to the plan.
Defined contribution plans
Costs for defined contribution plans are recognized during the year in which the service is provided.
Other long-term employee benefits
CIBC previously sponsored a closed long-term disability income replacement plan that was classified as a long-term defined benefit arrangement
before it was settled effective December 2021. CIBC also offers other medical and dental benefits to employees while on long-term disability.
The amount of other long-term employee benefits is actuarially calculated using the projected unit credit method. Under this method, the
benefit is discounted to determine its present value. The methodology used to determine the discount rate used to value the long-term employee
benefit obligation is consistent with that for pension and other post-employment benefit plans. Actuarial gains and losses and past service costs are
recognized in the consolidated statement of income in the period in which they arise.
Share-based payments
We provide compensation to certain employees and directors in the form of share-based awards.
Compensation expense for share-based awards is recognized from the service commencement date to the earlier of the contractual vesting date
or the employee’s retirement eligible date. For grants regularly awarded in the annual incentive compensation cycle (annual incentive grant), the service
commencement date is considered to be the start of the fiscal year that precedes the fiscal year in which the grant is made. The service commencement
date in respect of special awards granted outside of the annual cycle is the grant date. The amount of compensation expense recognized is based on
management’s best estimate of the number of share-based awards expected to vest, including estimates of expected forfeitures, which are revised
periodically as appropriate. For the annual incentive grant, compensation expense is recognized from the service commencement date based on the
estimated fair value of the forthcoming grant with the estimated fair value adjusted to the actual fair value at the grant date.
Under the Restricted Share Award (RSA) plan, where grants are settled in the cash equivalent of common shares, changes in the obligation
which arise from fluctuations in the market price of common shares, net of related hedges, are recognized in the consolidated statement of income
as compensation expense in proportion to the award recognized.
Under the Performance Share Unit (PSU) plan, where grants are settled in the cash equivalent of common shares, changes in the obligation
which arise from fluctuations in the market price of common shares, and revised estimates of the performance factor, net of related hedges, are
recognized in the consolidated statement of income as compensation expense in proportion to the award recognized. The performance factor
ranges from 75% to 125% of the initial number of units awarded based on CIBC’s performance relative to the other major Canadian banks.
Compensation expense in respect of the Employee Stock Option Plan (ESOP) is based on the grant date fair value. Where the service
commencement date precedes the grant date, compensation expense is recognized from the service commencement date based on the estimated
fair value of the award at the grant date, with the estimated fair value adjusted to the actual fair value at the grant date. Compensation expense
results in a corresponding increase to contributed surplus. If the ESOP award is exercised, the proceeds we receive, together with the amount
recognized in Contributed surplus, are credited to common share capital. If the ESOP award expires unexercised, the compensation expense
remains in Contributed surplus.
As part of our acquisition of Wellington Financial Fund V LP (Wellington Financial) in the first quarter of 2018, equity-settled awards in the form
of exchangeable shares with specific service and non-market performance vesting conditions were issued to selected employees. Compensation
expense in respect of the exchangeable shares is based on the grant date fair value, adjusted for changes in the estimated impact of the
non-market performance conditions.
Compensation in the form of Deferred Share Units (DSUs) issued pursuant to the Deferred Share Unit Plan, the Deferred Compensation Plan
(DCP), and the Directors’ Plan entitles the holder to receive the cash equivalent of a CIBC common share. At the time DSUs are granted, the related
expense in respect of the cash compensation that an employee or director would otherwise receive would have been fully recognized. Changes in
the obligations which arise from fluctuations in the market price of common shares, net of related hedges, are recognized in the consolidated
statement of income as compensation expense for employee DSUs and as Non-interest expense – Other for Directors’ DSUs.
Our contributions under the Employee Share Purchase Plan (ESPP) are expensed as incurred.
The impact due to our changes in common share price in respect of cash-settled share-based compensation under the RSA and PSU plans is
hedged through the use of derivatives. We designate these derivatives within cash flow hedge accounting relationships. The effective portion of the
change in fair value of these derivatives is recognized in OCI and is reclassified into compensation expense, within the consolidated statement of
income, over the period that the hedged awards impact the consolidated statement of income. The ineffective portion of the change in fair value of
the hedging derivatives is recognized in the consolidated statement of income immediately as it arises.
Provisions and contingent liabilities
Provisions are liabilities of uncertain timing or amount. A provision is recognized when we have a present legal or constructive obligation as a result
of a past event, it is probable that an outflow of economic benefits will be required to settle the obligation, and a reliable estimate can be made of
the amount of the obligation. The provision is recognized as the best estimate of the amount required to settle the obligation at the reporting date,
130 CIBC 2022 ANNUAL REPORT

Consolidated financial statements
taking into account the risk and uncertainties related to the obligation. Where material, provisions are discounted to reflect the time value of money,
and the increase in the obligation due to the passage of time is presented as Interest expense in the consolidated statement of income.
Contingent liabilities are possible obligations that arise from past events whose existence will be confirmed only by the occurrence, or
non-occurrence, of one or more uncertain future events not wholly within the control of CIBC, or are present obligations that have arisen from past
events but are not recognized because it is not probable that settlement will require the outflow of economic benefits.
Provisions and contingent liabilities are disclosed in the consolidated financial statements.
Earnings per share
We present basic and diluted EPS for our common shares.
Basic EPS is computed by dividing net income for the period attributable to CIBC common shareholders by the weighted-average number of
common shares outstanding during the period. The net income attributable to CIBC common shareholders is determined after deducting the
after-tax amount of dividends on preferred shares and distributions on other equity instruments, which are accounted for in retained earnings, from
the net income attributable to equity shareholders.
Diluted EPS is computed by dividing net income for the period attributable to CIBC common shareholders by the weighted-average number of
diluted common shares outstanding for the period. Diluted common shares reflect the potential dilutive effect of the exercise of stock options based
on the treasury stock method. For stock options, the treasury stock method determines the number of incremental common shares by assuming that
outstanding stock options, whose exercise price is less than the average market price of common shares during the period, are exercised and then
reduced by the number of common shares assumed to be repurchased with the exercise proceeds from the assumed exercise of the options.
Instruments determined to have an antidilutive effect for the period are excluded from the calculation of diluted EPS.
Fee and commission income
The recognition of fee and commission income is determined by the purpose of the fee or commission and the terms specified in the contract with
the customer. Revenue is recognized when, or as, a performance obligation is satisfied by transferring control of the service to the customer, in the
amount of the consideration to which we expect to be entitled. Revenue may therefore be recognized at a point in time upon completion of the
service or over time as the services are provided. When revenue is recognized over time, we are generally required to provide the services each
period, such that control of the services is transferred evenly to the customer, and we therefore measure our progress towards completion of the
service based upon the time elapsed. For contracts where the transaction price includes variable consideration, revenue is only recognized to the
extent that it is highly probable that a significant reversal in the amount of cumulative revenue recognized will not occur when the uncertainty
associated with the variable consideration is resolved, which typically occurs by the end of the reporting period. When another party is involved in
providing a service to a customer, we determine whether the nature of our performance obligation is that of a principal or an agent. If we control the
service before it is transferred to the customer, we are acting as the principal and present revenue separately from the amount paid to the other
party; otherwise we are the agent and present revenue net of the amount paid to the other party. Consideration payable to a customer, including
cash amounts payable to a customer, credits or other items that can be applied against amounts owing to us, is recognized as a reduction of
revenue unless the payment to the customer is in exchange for a distinct good or service, in which case the purchase of the good or service is
accounted for in the same way as for other purchases from suppliers. Our performance obligations typically have a term of one year or less, with
payment received upon satisfaction of the performance obligation or shortly afterwards, and as a result there is no significant financing component
and we do not typically capitalize the costs of obtaining contracts with our customers. Income which forms an integral part of the effective interest
rate of a financial instrument is recognized as an adjustment to the effective interest rate.
In addition to these general principles, the following specific policies are also applied:
Underwriting and advisory fees are earned on debt and equity securities placements and transaction-based advisory services. Underwriting
fees are typically recognized at the point in time when the transaction is completed. Advisory fees are generally recognized as revenue over the
period of the engagement as the related services are provided or at the point in time when the transaction is completed.
Deposit and payment fees arise from personal and business deposit accounts and cash management services. Monthly and annual fees are
recognized over the period that the related services are provided. Transactional fees are recognized at the point in time when the related services
are provided.
Credit fees consist of loan syndication fees, loan commitment fees, letter of credit fees, banker’s acceptance stamping fees, and securitization
fees. Credit fees are generally recognized over the period that the related services are provided, except for loan syndication fees, which are
typically recognized at the point in time that the financing placement is completed.
Card fees primarily include interchange income, overlimit fees, cash advance fees, and annual fees. Card fees are recognized at the point in
time that the related services are provided, except for annual fees, which are recognized over the 12-month period to which they relate. The cost of
credit card loyalty points is recognized as a reduction of interchange income when the loyalty points are issued for both self-managed and third-
party loyalty points programs. Credit card loyalty point liabilities are recognized for self-managed loyalty point programs and are subject to periodic
remeasurement to reflect the expected cost of redemption as this expectation changes over time.
Commissions on securities transactions include brokerage commissions for transactions executed on behalf of clients, trailer fees and mutual
fund sales commissions. Brokerage commissions and mutual fund sales commissions are generally recognized at the point in time that the related
transaction is executed. Trailer fees are typically calculated based upon the average daily net asset value of the mutual fund units held by clients
and are recognized over time as the related services are provided.
Investment management fees are primarily based on the respective value of the assets under management (AUM) or assets under
administration (AUA) and are recognized over the period that the related services are provided. Investment management fees relating to our asset
management and private wealth management business are generally calculated based on point-in-time AUM balances, and investment
management fees relating to our retail brokerage business are generally calculated based on point-in-time AUM or AUA balances. Custodial fees
are recognized as revenue over the applicable service period, which is generally the contract term.
Mutual fund fees include management fees and administration fees, which are earned on fund management services and are recognized over
the period that the mutual funds are managed based upon a specified percentage of the daily net asset values of the respective mutual funds. In
certain circumstances, CIBC may, on a discretionary basis, elect to absorb certain expenses that would otherwise be payable by the mutual funds
directly. These expenses are recognized in Non-interest expenses on the consolidated statement of income.
Interest Rate Benchmark Reform
Various interest rate and other indices that are deemed to be “benchmarks” including the London Interbank Offered Rate (LIBOR) are the subject of
international regulatory guidance and proposals for reform. Regulators in various jurisdictions have advocated for the transition from Interbank
Offered Rates (IBORs) to alternative benchmark rates (alternative rates), based upon risk-free rates determined using actual market transactions.
CIBC 2022 ANNUAL REPORT 131

Consolidated financial statements
Following the previous announcements by various regulators, the publication of LIBOR settings for all sterling, Japanese yen, Swiss franc and euro,
as well as 1-week and 2-month USD LIBOR settings was discontinued on December 31, 2021. The remaining USD LIBOR settings will cease to be
published after June 30, 2023. In March 2022, the Adjustable Interest Rate (LIBOR) Act was enacted in the U.S., which allows for contracts that do
not contain adequate fallback provisions to automatically transition to Secured Overnight Financing Rate (SOFR) upon the cessation of USD LIBOR.
The enactment of this legislation is a positive step towards facilitating the remediation efforts for USD LIBOR exposures.
In December 2021, the Canadian Alternative Reference Rate working group (CARR) recommended to Refinitiv Benchmark Services (UK)
Limited (RBSL), the Canadian Dollar Offered Rate (CDOR) administrator, to cease the calculation and publication of CDOR after June 30, 2024 and
proposed a two-staged approach to the transition from CDOR to Canadian Overnight Repo Rate Average (CORRA). Following public consultation, on
May 16, 2022, RBSL announced that it will permanently cease the publication and calculation of all remaining tenors of CDOR after June 28, 2024.
Following this announcement, OSFI published its expectations for CDOR transition which is consistent with the two-stage transition approach
proposed by CARR. OSFI expects all new derivatives and securities to transition to the alternative rates by June 30, 2023, with no new CDOR
exposures after that date, with limited exceptions. OSFI also expects all loan agreements referencing CDOR to be transitioned by June 28, 2024, and
federally regulated financial institutions to prioritize system and model updates to accommodate the use of CORRA prior to June 28, 2024.
IASB has addressed the impact of IBOR reform on financial reporting by issuing Phase 1 and Phase 2 amendments. We have adopted
Phase 1 and Phase 2 amendments effective November 1, 2019 and November 1, 2020, respectively. Phase 1 amendments provide temporary relief
for specific hedge accounting requirements to address uncertainties in the period prior to replacement of IBORs, and provide specific disclosure
requirements for the affected hedging relationships. Phase 2 amendments address issues that affect financial reporting once an existing rate is
replaced with an alternative rate and conclude the IASB’s amendments to financial reporting standards due to the effects of interest rate benchmark
reform. The Phase 2 amendments permit modifications of amortized cost financial assets and financial liabilities that are made as a direct
consequence of IBOR reform and on an economically equivalent basis to be accounted for by updating the effective interest rate prospectively with
no immediate gain or loss recognition. See “Derivatives used for ALM purposes that qualify for hedge accounting” for further details on temporary
relief provided by IASB.
As IBORs are widely referenced by large volumes of derivative, loan and cash products, the transition presents a number of risks to us, and
the
industry as a whole. These transition risks include market risk (as new basis risks emerge), model risk, operational risk (as processes are
changed or newly introduced), legal risk (as contracts are revised) and conduct risk (in ensuring clients are adequately informed/prepared). In
response to the reforms to interest rate benchmarks, we have established an Enterprise IBOR Transition Program (Program), which is supported by
a formal governance structure and dedicated working groups that include stakeholders from frontline businesses as well as functional groups such
as Treasury, Technology and Operations, Risk Management, Legal and Finance, to manage and coordinate all aspects of the transition, including
the identification and mitigation of the risks. An IBOR Steering Committee has been established with responsibility for oversight and execution of the
Program. The IBOR Steering Committee manages the impact of the transition risks through appropriate mitigating actions. We also continue to
engage with industry associations to incorporate recent developments into our project plan. The Program provides regular updates to the senior
management including the Executive Committee, and the Board.
As a part of the Program and consistent with regulatory expectations, we have completed the transition of our non-USD LIBOR and 1-week and
2-month USD LIBOR referenced contracts, and no new USD LIBOR products were originated after December 31, 2021 with limited permitted
exceptions. We are in the process of transitioning our remaining USD LIBOR based contracts to the alternative rates by incorporating appropriate
fallback provisions or making amendments to contracts to reference alternative rates, and have developed business processes to support the transition.
We are also working with clearing houses to prepare for the transition of our USD LIBOR referenced derivatives to alternative rates, ahead of the
expected cessation of USD LIBOR. The Program is also assessing the impact of the cessation of CDOR on our operations and is developing plans to
facilitate the transition of CDOR to alternative rates. As part of the Program, we continue to engage with industry associations on ongoing developments,
and continue to incorporate these into our project plan and make information available to our clients, advising them on recent developments.
The following table presents the approximate notional amounts of our derivatives and the gross outstanding balances of our non-derivative
financial assets and financial liabilities that are indexed to USD LIBOR and CDOR with a maturity date beyond June 30, 2023 for USD LIBOR, and
June 28, 2024 for CDOR, that are expected to be affected by IBOR reform.
(billions of Canadian dollars)
Notional/gross outstanding amounts
(1)(2)
October 31, 2022 October 31, 2021
USD LIBOR CDOR USD LIBOR CDOR
Maturing after
June 30, 2023
Maturing after
June 28, 2024
Maturing after
June 30, 2023
Maturing after
June 28, 2024
Non-derivative financial assets
Securities $ 1.6 $ 3.4 $ 1.6 $ 2.7
Loans and customers’ liability under acceptances
(3)
33.6 20.0 36.9 10.3
35.2 23.4 38.5 13.0
Non-derivative financial liabilities
Secured borrowing deposits and subordinated indebtedness
(4)
0.1 6.5 0.1 6.3
Other deposits and acceptances
(3)
1.1 7.1 1.0 3.8
1.2 13.6 1.1 10.1
Derivatives
(5)
866.9 1,757.9 735.7 1,341.6
(1) The table excludes undrawn loan commitments. As at October 31, 2022, the total outstanding undrawn loan commitments that are denominated in U.S. dollars and are
potentially subject to USD LIBOR transition with a maturity date beyond June 30, 2023 are estimated to be $22.6 billion, and the total outstanding undrawn loan
commitments that are denominated in Canadian dollars and are potentially subject to CDOR transition with a maturity date beyond June 28, 2024 are estimated to be
$24.7 billion. A portion of these commitments can also be drawn in other benchmark rates.
(2) Includes exposures for which fallback provisions have been incorporated.
(3) Includes exposures referenced to the 1-month and 3-month Bankers’ Acceptance rates.
(4) Includes subordinated indebtedness with redemption dates either prior to or after June 28, 2024, which will be repriced based on CDOR and mature after June 28, 2024 to
the extent that they are not redeemed.
(5) As at October 31, 2022, the notional amount of our derivatives in designated hedge accounting relationships that are indexed to USD LIBOR with a maturity date beyond
June 30, 2023 was approximately $46.2 billion and CDOR with a maturity date beyond June 28, 2024, was approximately $151.9 billion. For cross-currency swaps and
basis swaps for which either leg is indexed to USD LIBOR or CDOR, the notional amount of each leg has been included in the table above and in the notional amount of
our derivatives in designated hedge accounting relationships that are indexed to USD LIBOR or CDOR, respectively.
Conceptual Framework for Financial Reporting (Conceptual Framework)
The Conceptual Framework sets out the fundamental concepts that underlie the preparation and presentation of financial statements and serves to
guide the IASB in developing IFRS standards. The Conceptual Framework is effective for annual periods beginning on or after January 1, 2020. As a
result, CIBC adopted the Conceptual Framework as at November 1, 2020.
There was no impact to our consolidated financial statements and no changes in our accounting policies as a result of adopting the
Conceptual Framework.
132 CIBC 2022 ANNUAL REPORT

Consolidated financial statements
Note 2 Fair value measurement
This note presents the fair values of financial instruments and explains how we determine those values. Note 1, “Basis of preparation and summary
of significant accounting policies”, sets out the accounting treatment for each measurement category of financial instruments.
Fair value is defined as the price that would be received to sell an asset, or paid to transfer a liability, between market participants in an orderly
transaction in the principal market at the measurement date under current market conditions (i.e., the exit price). The determination of fair value
requires judgment and is based on market information, where available and appropriate. Fair value measurements are categorized into three levels
within a fair value hierarchy (Level 1, 2 or 3) based on the valuation inputs used in measuring the fair value, as outlined below.
• Level 1 – Unadjusted quoted market prices in active markets for identical assets or liabilities we can access at the measurement date. Bid
prices, ask prices or prices within the bid and ask, which are the most representative of the fair value, are used as appropriate to measure fair
value. Fair value is best evidenced by an independent quoted market price for the same instrument in an active market. An active market is
one where transactions are occurring with sufficient frequency and volume to provide quoted prices on an ongoing basis.
• Level 2 – Quoted prices for identical assets or liabilities in markets that are inactive or observable market quotes for similar instruments, or use
of valuation techniques where all significant inputs are observable. Inactive markets may be characterized by a significant decline in the
volume and level of observed trading activity or through large or erratic bid/offer spreads. In instances where traded markets do not exist or
are not considered sufficiently active, we measure fair value using valuation models.
• Level 3 – Non-observable or indicative prices or use of valuation techniques where one or more significant inputs are non-observable.
For a significant portion of our financial instruments, quoted market prices are not available because of
the lack of traded markets, and even where
such markets do exist, they may not be considered sufficiently active to be used as a final determinant of fair value. When quoted market prices in
active markets are not available, we would consider using valuation models. The valuation model and technique we select maximizes the use of
observable market inputs to the extent possible and appropriate in order to estimate the price at which an orderly transaction would take place at
the measurement date. In an inactive market, we consider all reasonably available information, including any available pricing for similar
instruments, recent arm’s-length market transactions, any relevant observable market inputs, indicative dealer or broker quotations, and our own
internal model-based estimates.
Valuation adjustments are an integral component of our fair valuation process. We apply judgment in establishing valuation adjustments that
take into account various factors that
may have an impact on the valuation. Such factors primarily include, but are not limited to, the bid-offer
spreads, illiquidity due to lack of market depth, parameter uncertainty and other market risk, model risk and credit risk of our derivative assets and
liabilities, as well as adjustments for valuing our uncollateralized derivative assets and liabilities based on an estimated market cost of funds curve.
Generally, the unit of account for a financial instrument is the individual instrument, and valuation adjustments are applied at an individual
instrument level, consistent with that unit of account. In cases where we manage a group of financial assets and liabilities that consist of substantially
similar and offsetting risk exposures, the fair value of the group of financial assets and liabilities is measured on the basis of the net open risks.
We apply judgment in determining the most appropriate inputs and the weighting we ascribe to each such input as well as in our selection of
valuation methodologies. Regardless of the valuation technique we use, we incorporate assumptions
that we believe market participants would
make for credit, funding, and liquidity considerations. When the fair value of a financial instrument at inception is determined using a valuation
technique that incorporates one or more significant inputs that are non-observable, no inception profit or loss (the difference between the
determined fair value and the transaction price) is recognized at the time the asset or liability is initially recorded. Any gains or losses at inception
are deferred and recognized only in future periods over the term of the instruments or when the inputs become significantly observable.
We have an ongoing process for evaluating and enhancing our valuation techniques and models. Where enhancements are made, they are
applied prospectively, so that fair values
reported in prior periods are not recalculated on the new basis. Valuation models used, including analytics
for the construction of yield curves and volatility surfaces, are vetted and approved, consistent with our model risk policy.
To ensure that valuations are appropriate, we have established internal guidance on fair value measurement, which is reviewed periodically in
recognition of the dynamic
nature of markets and the constantly evolving pricing practices in the market. A number of policies and controls are put
in place to ensure that the internal guidance on fair value measurement is being applied consistently and appropriately, including independent
validation of valuation inputs to external sources such as exchange quotes, broker quotes or other management-approved independent pricing
sources. Key model inputs, such as yield curves and volatilities, are independently verified. The results from the independent price validation and
any valuation adjustments are reviewed by the Independent Price Verification Committee on a monthly basis. This includes, but is not limited to,
reviewing fair value adjustments and methodologies, independent price verification results, limits and valuation uncertainty.
Due to the judgment used in applying a wide variety of acceptable valuation techniques and models, as well as the use of estimates inherent
in this process, estimates of
fair value for the same or similar assets may differ among financial institutions. The calculation of fair value is based on
market conditions as at each consolidated balance sheet date and may not be reflective of ultimate realizable value.
Methods and assumptions
Financial instruments with fair value equal to carrying value
For financial instruments that are not carried on the consolidated balance sheet at fair value and where we consider the carrying value to be a
reasonable approximation of fair value due to their short-term nature and generally negligible credit risk, the fair values disclosed for these financial
instruments are assumed to equal their carrying values. These financial instruments are: cash and non-interest-bearing deposits with banks; short-
term interest-bearing deposits with banks; cash collateral on securities borrowed; securities purchased under resale agreements; customers’
liability under acceptances; cash collateral on securities lent; obligations related to securities sold under repurchase agreements; acceptances;
deposits with demand features; and certain other financial assets and liabilities.
CIBC 2022 ANNUAL REPORT 133

Consolidated financial statements
Securities
The fair value of debt or equity securities and obligations related to securities sold short is based on quoted bid or ask market prices where
available in an active market.
Securities for which quotes in an active market are not available are valued using all reasonably available market information as described below.
The fair value of government issued or guaranteed securities that are not traded in an active market is calculated by applying valuation
techniques such as discounted cash flow
models using implied yields derived from the prices of actively traded government securities and most
recently observable spread differentials.
The fair value of corporate debt securities is determined using the most recently executed transaction prices, and where appropriate, adjusted
to the price
of these securities obtained from independent dealers, brokers, and third-party multi-contributor consensus pricing sources. When
observable price quotations are not available, fair value is determined based on discounted cash flow models using observable discounting curves
such as benchmark and government yield curves and spread differentials observed through independent dealers, brokers, and third-party multi-
contributor consensus pricing sources.
Asset-backed securities (ABS) and mortgage-backed securities (MBS) not issued or guaranteed by a government are valued using
discounted cash flow models making maximum use of
market observable inputs, such as broker quotes on identical or similar securities and other
pricing information obtained from third-party pricing sources adjusted for the characteristics and the performance of the underlying collateral. Other
key inputs used include prepayment and liquidation rates, credit spreads, and discount rates commensurate with the risks involved. These
assumptions factor in information that is derived from actual transactions, underlying reference asset performance, external market research, and
market indices, where appropriate.
Privately issued debt and equity securities are valued using recent market transactions, where available. Otherwise, fair values are derived
from valuation models using a market or income approach. These models consider various factors, including projected cash flows, earnings,
revenue or other third-party evidence as available. The fair value of limited partnership investments is based upon net asset values published by
third-party fund managers and is adjusted for more recent information where available and appropriate. The carrying value of Community
Reinvestment Act equity investments and Federal Home Loan Bank (FHLB) stock approximates fair value.
Loans
The fair value of variable-rate loans and loans for which interest rates are repriced or reset frequently is assumed to be equal to their carrying value.
The fair value for fixed-rate loans is estimated using a discounted cash flow calculation that uses market interest rates.
The ultimate fair value of loans disclosed is net of the associated allowance for credit losses. The fair value of loans is not adjusted for the
value of any credit derivatives used to manage the credit risk associated with them. The fair value of these credit derivatives is disclosed separately.
Securities purchased under resale agreements or sold under repurchase agreements
The fair values of these contracts are determined using valuation techniques such as the discounted cash flow method using interest rate curves as
inputs.
Other assets and other liabilities
Other assets and other liabilities mainly comprise accrued interest receivable or payable, brokers’ client accounts receivable or payable, derivative
collateral receivable or payable, precious metals and accounts receivable or payable.
The fair values of other assets and other liabilities are primarily assumed to be at cost or amortized cost as we consider the carrying value to be a
reasonable approximation of fair value, except for the fair value of precious metals, which is quoted in an active market. Other assets also include
investment in bank-owned life insurance carried at the cash surrender value, which is assumed to be a reasonable approximation of fair value.
Deposits
The fair values of floating-rate deposits and demand deposits are assumed to be equal to their amortized cost. The fair value of fixed-rate deposits is
determined by discounting the contractual cash flows using either current market interest rates with similar remaining terms or rates estimated using
internal models and broker quotes. The fair value of deposit notes issued to CIBC Capital Trust is determined by reference to the quoted market prices
of CIBC Tier 1 Notes – Series B issued by CIBC Capital Trust. The fair value of deposit liabilities with embedded optionality includes the fair value of
those options. The fair value of equity- and commodity-linked notes includes the fair value of embedded equity and commodity derivatives.
Certain deposits designated at FVTPL are structured notes that have coupons or repayment terms linked to the performance of commodities,
debt
or equity securities or specific market indices. The fair value of these structured notes is estimated using internally vetted valuation models for
the debt and embedded derivative portions of the notes by incorporating market observable prices of the referenced securities or comparable
securities, and other inputs such as interest rate yield curves, equity prices or indices, market volatility levels, foreign exchange rates and changes
in our own credit risk, where appropriate. Where observable prices or inputs are not available, management judgment is required to determine fair
values by assessing other relevant sources of information such as historical data, proxy information from similar transactions, and through
extrapolation and interpolation techniques. Appropriate market risk valuation adjustments for such inputs are assessed in all such instances.
The fair value of secured borrowings, which comprises liabilities issued by or as a result of activities associated with the securitization of
residential
mortgages, the Covered Bond Programme, and consolidated securitization vehicles, is based on identical or proxy market observable
quoted bond prices or determined by discounting the contractual cash flows using maximum market observable inputs, such as market interest
rates, or credit spreads implied by debt instruments of similar credit quality, as appropriate.
Subordinated indebtedness
The fair value of subordinated indebtedness is determined by reference to market prices for the same or similar debt instruments.
134 CIBC 2022 ANNUAL REPORT

Consolidated financial statements
Derivative instruments
The fair value of exchange-traded derivatives such as options and futures is based on quoted market prices. OTC derivatives primarily consist of interest
rate swaps, foreign exchange forwards, equity and commodity derivatives, interest rate and currency derivatives, and credit derivatives. For such
instruments, where quoted market prices or third-party consensus pricing information are not available, valuation techniques are employed to estimate
fair value on the basis of pricing models. Such vetted pricing models incorporate current market measures for interest rates, foreign exchange rates,
equity and commodity prices and indices, credit spreads, corresponding market volatility levels, and other market-based pricing factors.
In order to reflect the observed market practice of pricing collateralized and uncollateralized derivatives, our valuation approach uses
overnight indexed swap (OIS) curves
as the discount rate for valuing collateralized derivatives and uses an estimated market cost of funds curve as
the discount rate for valuing uncollateralized derivatives. Uncollateralized derivatives are valued based on an estimated market cost of funds curve,
which reduces the fair value of uncollateralized derivative assets incremental to the reduction in fair value for credit risk already reflected through
the credit valuation adjustment (CVA). In contrast, the use of a market cost of funds curve reduces the fair value of uncollateralized derivative
liabilities in a manner that generally includes adjustments for our own credit. As market practices continue to evolve in regard to derivative valuation,
further adjustments may be required in the future.
In addition to reflecting estimated market funding costs in our valuation of uncollateralized derivative receivables, we also consider whether a CVA is
required to recognize the risk that any given derivative counterparty may not ultimately be able to fulfill its obligations. The CVA is driven off market-
observed credit spreads or proxy credit spreads and our assessment of the net counterparty credit risk (CCR) exposure. In assessing this exposure, we
also take into account credit mitigants such as collateral, master netting arrangements, and settlements through clearing houses. As noted above, the fair
value of uncollateralized derivative liabilities based on market cost of funding generally includes adjustments for our own credit.
In determining the fair value of complex and customized derivatives, such as equity, credit, and commodity derivatives written in reference to indices
or baskets of reference, we consider all reasonably available info
rmation including any relevant observable market inputs, third-party consensus pricing
inputs, indicative dealer and broker quotations, and our own internal model-based estimates, which are vetted and approved in accordance with our
model risk policy, and are regularly and periodically calibrated. The model calculates fair value based on inputs specific to the type of contract, which
may include stock prices, correlation for multiple assets, interest rates, foreign exchange rates, yield curves, volatility surfaces, and the probability of early
termination. Where observable prices or inputs are not available, management judgment is required to determine fair values by assessing other relevant
sources of information such as historical data, proxy information from similar transactions, and through extrapolation and interpolation techniques.
Appropriate parameter uncertainty and market risk valuation adjustments for such inputs and other model risk valuation adjustments are assessed in all
such instances.
Mortgage commitments
The fair value of mortgage commitments designated at FVTPL is for fixed-rate residential mortgage commitments and is based on changes in
market interest rates for the loans between the commitment and the consolidated balance sheet dates. The valuation model takes into account the
expected probability that outstanding commitments will be exercised as well as the length of time the commitment is offered.
CIBC 2022 ANNUAL REPORT 135

Consolidated financial statements
Fair value of financial instruments
$ millions, as at October 31
Carrying value
Fair
value
Fair value
over (under)
carrying value
Amortized
cost
Mandatorily
measured
at FVTPL
Designated
at FVTPL
Fair value
through
OCI Total
2022 Financial assets
Cash and deposits with banks $ 62,193 $ 1,668 $ – $ – $ 63,861 $ 63,861 $ –
Securities 52,484 67,296 – 56,099 175,879 173,663 (2,216)
Cash collateral on securities borrowed 15,326 – – – 15,326 15,326 –
Securities purchased under resale agreements 53,626 15,587 – – 69,213 69,213 –
Loans
Residential mortgages 269,409 4 – – 269,413 262,865 (6,548)
Personal 44,527 – – – 44,527 44,394 (133)
Credit card 15,695 – – – 15,695 15,775 80
Business and government 186,485 758 205 – 187,448 186,967 (481)
Derivative instruments – 43,035 – – 43,035 43,035 –
Customers’ liability under acceptances 11,574 – – – 11,574 11,574 –
Other assets 26,387 – – – 26,387 26,387 –
Financial liabilities
Deposits
Personal $ 220,244 $ – $ 11,851 $ – $ 232,095 $ 231,532 $ (563)
Business and government 383,502 – 13,686 – 397,188 397,145 (43)
Bank 22,523 – – – 22,523 22,523 –
Secured borrowings 44,110 – 1,656 – 45,766 45,507 (259)
Derivative instruments – 52,340 – – 52,340 52,340 –
Acceptances 11,586 – – – 11,586 11,586 –
Obligations related to securities sold short – 15,284 – – 15,284 15,284 –
Cash collateral on securities lent 4,853 – – – 4,853 4,853 –
Obligations related to securities sold under
repurchase agreements 73,084 – 4,087 – 77,171 77,171 –
Other liabilities 19,830 102 22 – 19,954 19,954 –
Subordinated indebtedness 6,292 – – – 6,292 6,329 37
2021 Financial assets
Cash and deposits with banks $ 56,701 $ 296 $ – $ – $ 56,997 $ 56,997 $ –
Securities 35,159 72,192 53 53,997 161,401 161,712 311
Cash collateral on securities borrowed 12,368 – – – 12,368 12,368 –
Securities purchased under resale agreements 60,482 7,090 – – 67,572 67,572 –
Loans
Residential mortgages 251,230 16 – – 251,246 249,786 (1,460)
Personal 41,129 – – – 41,129 41,114 (15)
Credit card 10,509 – – – 10,509 10,509 –
Business and government
(1)
123,054 25,651 332 – 149,037 148,960 (77)
Derivative instruments – 35,912 – – 35,912 35,912 –
Customers’ liability under acceptances 10,958 – – – 10,958 10,958 –
Other assets 21,054 – – – 21,054 21,054 –
Financial liabilities
Deposits
Personal $ 205,461 $ – $ 8,471 $ – $ 213,932 $ 213,949 $ 17
Business and government 334,632 – 9,756 – 344,388 345,533 1,145
Bank 20,246 – – – 20,246 20,246 –
Secured borrowings 41,539 – 1,053 – 42,592 42,838 246
Derivative instruments – 32,101 – – 32,101 32,101 –
Acceptances 10,961 – – – 10,961 10,961 –
Obligations related to securities sold short –
22,790
– – 22,790 22,790 –
Cash collateral on securities lent 2,463 – – – 2,463 2,463 –
Obligations related to securities sold under
repurchase agreements 67,905 – 3,975 – 71,880 71,880 –
Other liabilities 16,854 113 51 – 17,018 17,018 –
Subordinated indebtedness 5,539 – – – 5,539 5,820 281
(1) Includes $24.8 billion of FVTPL loans that matured in 2022.
136 CIBC 2022 ANNUAL REPORT

Consolidated financial statements
Fair value of derivative instruments
$ millions, as at October 31 2022 2021
Positive Negative Net Positive Negative Net
Held for trading
Interest rate derivatives
Over-the-counter – Forward rate agreements $ –$ 1$ (1)$ 127 $ 79 $ 48
– Swap contracts 6,688 12,762 (6,074) 8,365 7,928 437
– Purchased options 491 – 491 101 – 101
– Written options – 354 (354) – 177 (177)
7,179 13,117 (5,938) 8,593 8,184 409
Exchange-traded – Futures contracts 3 1 2 – – –
– Purchased options 3 – 3 3 – 3
6 1 5 3 – 3
Total interest rate derivatives 7,185 13,118 (5,933) 8,596 8,184 412
Foreign exchange derivatives
Over-the-counter – Forward contracts 10,650 11,798 (1,148) 5,373 5,555 (182)
– Swap contracts 8,252 10,198 (1,946) 5,214 3,600 1,614
– Purchased options 561 – 561 293 – 293
– Written options – 481 (481) – 203 (203)
Total foreign exchange derivatives 19,463 22,477 (3,014) 10,880 9,358 1,522
Credit derivatives
Over-the-counter – Credit default swap contracts – protection purchased 53 12 41 50 58 (8)
– Credit default swap contracts – protection sold 6 51 (45) 3 45 (42)
Total credit derivatives 59 63 (4) 53 103 (50)
Equity derivatives
Over-the-counter 2,338 3,110 (772) 1,842 5,356 (3,514)
Exchange-traded 2,775 3,220 (445) 4,650 3,422 1,228
Total equity derivatives 5,113 6,330 (1,217) 6,492 8,778 (2,286)
Precious metal and other commodity derivatives
(1)
Over-the-counter 8,163 2,989 5,174 8,283 2,495 5,788
Exchange-traded 118 1,301 (1,183) 343 1,122 (779)
Total precious metal and other commodity derivatives 8,281 4,290 3,991 8,626 3,617 5,009
Total held for trading 40,101 46,278 (6,177) 34,647 30,040 4,607
Held for ALM
Interest rate derivatives
Over-the-counter – Forward rate agreements 696 62 634 148 37 111
– Swap contracts 391 1,194 (803) 236 341 (105)
– Purchased options 1 – 1 6 – 6
– Written options – 10 (10) – – –
Total interest rate derivatives 1,088 1,266 (178) 390 378 12
Foreign exchange derivatives
Over-the-counter – Forward contracts 29 129 (100) 22 40 (18)
– Swap contracts 1,805 4,623 (2,818) 805 1,641 (836)
Total foreign exchange derivatives 1,834 4,752 (2,918) 827 1,681 (854)
Credit derivatives
Over-the-counter – Credit default swap contracts – protection purchased – – – – 1 (1)
Total credit derivatives – – – – 1 (1)
Equity derivatives
Over-the-counter 12 44 (32) 48 1 47
Total equity derivatives 12 44 (32) 48 1 47
Total held for ALM 2,934 6,062 (3,128) 1,265 2,061 (796)
Total fair value 43,035 52,340 (9,305) 35,912 32,101 3,811
Less: effect of netting (25,999) (25,999) – (16,585) (16,585) –
$ 17,036 $ 26,341 $ (9,305) $ 19,327 $ 15,516 $ 3,811
(1) Certain prior year information has been revised to conform to current year presentation.
Financial assets and liabilities not carried on the consolidated balance sheet at fair value
The table below presents the fair values by level within the fair value hierarchy for those financial instruments in which fair value is not assumed to
equal the carrying value:
$ millions, as at October 31
Level 1 Level 2 Level 3
Total
2022
Total
2021
Quoted market price
Valuation technique –
observable market inputs
Valuation technique –
non-observable market inputs
2022 2021 2022 2021 2022 2021
Financial assets
Amortized cost securities $– $– $ 49,576 $ 34,878 $ 692 $ 592 $ 50,268 $ 35,470
Loans
Residential mortgages – – – – 262,861 249,770 262,861 249,770
Personal – – – – 44,394 41,114 44,394 41,114
Credit card – – – – 15,775 10,509 15,775 10,509
Business and government – – – – 186,004 122,977 186,004 122,977
Financial liabilities
Deposits
Personal $– $–
$ 62,636 $ 42,015 $ 1,899 $ 1,107 $ 64,535 $ 43,122
Business and government – – 179,182 146,442 1,766 2,222 180,948 148,664
Bank – – 10,724 9,751 – – 10,724 9,751
Secured borrowings – – 40,913 40,050 2,938 1,735 43,851 41,785
Subordinated indebtedness – – 6,329 5,820 – – 6,329 5,820
CIBC 2022 ANNUAL REPORT 137

Consolidated financial statements
Financial instruments carried on the consolidated balance sheet at fair value
The table below presents the fair values of financial instruments by level within the fair value hierarchy:
$ millions, as at October 31
Level 1 Level 2 Level 3
Total
2022
Total
2021
Quoted market price
Valuation technique –
observable market inputs
Valuation technique –
non-observable market inputs
2022 2021
2022 2021 2022 2021
Financial assets
Deposits with banks $– $– $ 1,668 $ 296 $– $– $ 1,668 $ 296
Debt securities mandatorily measured and
designated at FVTPL
Government issued or guaranteed 2,611 3,015 25,539
(1)
24,737
(1)
– – 28,150 27,752
Corporate debt – – 3,609 3,997 2 2 3,611 3,999
Mortgage- and asset-backed – – 3,656
(2)
2,235
(2)
207 55 3,863 2,290
2,611 3,015 32,804 30,969 209 57 35,624 34,041
Loans mandatorily measured at FVTPL
Business and government – – 276 24,945 687
(3)
1,038
(3)
963 25,983
Residential mortgages – – 4 16 – – 4 16
– – 280 24,961 687 1,038 967 25,999
Debt securities measured at FVOCI
Government issued or guaranteed 4,888 5,309 42,200 38,122 – – 47,088 43,431
Corporate debt – – 6,967 7,833 – – 6,967 7,833
Mortgage- and asset-backed – – 1,522 1,897 – – 1,522 1,897
4,888 5,309 50,689 47,852 – – 55,577 53,161
Corporate equity mandatorily measured at FVTPL
and designated at FVOCI
(4)
30,962 38,106 773 538 459 396 32,194 39,040
Securities purchased under resale agreements
measured at FVTPL – – 15,587 7,090 – – 15,587 7,090
Derivative instruments
Interest rate 6 3 8,249 8,948 18 35 8,273 8,986
Foreign exchange – – 21,297 11,707 – – 21,297 11,707
Credit – – 14 4 45 49 59 53
Equity 2,776 4,650 2,345 1,877 4 13 5,125 6,540
Precious metal and other commodity
(4)
94 343 8,187 8,283 – – 8,281 8,626
2,876 4,996 40,092 30,819 67 97 43,035 35,912
Total financial assets $ 41,337 $ 51,426 $ 141,893 $ 142,525 $ 1,422 $ 1,588 $ 184,652 $ 195,539
Financial liabilities
Deposits and other liabilities
(5)
$– $– $ (26,908) $ (18,702) $ (409) $ (742) $ (27,317) $ (19,444)
Obligations related to securities sold short (5,499) (11,226) (9,785) (11,564) – – (15,284) (22,790)
Obligations related to securities sold under
repurchase agreements – – (4,087) (3,975) – – (4,087) (3,975)
Derivative instruments
Interest rate (1) – (12,850) (8,426) (1,533) (136) (14,384) (8,562)
Foreign exchange – – (27,229) (11,039) – – (27,229) (11,039)
Credit – – (13) (50) (50) (54) (63) (104)
Equity (3,220) (3,422) (3,151) (5,280) (3) (77) (6,374) (8,779)
Precious metal and other commodity
(4)
(365) (1,122) (3,925) (2,495) – – (4,290) (3,617)
(3,586) (4,544) (47,168) (27,290) (1,586) (267) (52,340) (32,101)
Total financial liabilities $ (9,085) $ (15,770) $ (87,948) $ (61,531) $ (1,995) $ (1,009) $ (99,028) $ (78,310)
(1) Includes nil related to securities designated at FVTPL (2021: $49 million).
(2) Includes nil related to ABS designated at FVTPL (2021: $4 million).
(3) Includes $205 million related to loans designated at FVTPL (2021: $332 million).
(4) Certain prior year information has been reclassified to conform to the current year presentation.
(5) Comprises deposits designated at FVTPL of $26,802 million (2021: $18,530 million), net bifurcated embedded derivative liabilities of $391 million (2021: net bifurcated
embedded derivative liabilities of $750 million), other liabilities designated at FVTPL of $22 million (2021: $51 million), and other financial liabilities measured at fair value of
$102 million (2021: $113 million).
Transfers between levels in the fair value hierarchy are deemed to have occurred at the beginning of the year in which the transfer occurred.
Transfers between levels can occur as a result of additional or new information regarding valuation inputs and changes in their observability. During
the year, we transferred $1,287 million of securities mandatorily measured at FVTPL (2021: $19 million) from Level 1 to Level 2 and nil (2021:
$2 million) from Level 2 to Level 1, $4,532 million of securities sold short (2021: nil) from Level 1 to Level 2 and nil of securities sold short (2021: nil)
from Level 2 to Level 1 due to changes in the observability of the inputs used to value these securities. In addition, transfers between Level 2 and
Level 3 were made during 2022 and 2021, primarily due to changes in the assessment of the observability of certain correlation, market volatility
and probability inputs that were used in measuring the fair value of our fair value option liabilities and derivatives.
138 CIBC 2022 ANNUAL REPORT

Consolidated financial statements
The following table presents the changes in fair value of financial assets and liabilities in Level 3. These instruments are measured at fair value
utilizing non-observable market inputs. We often hedge positions with offsetting positions that may be classified in a different level. As a result, the
gains and losses for assets and liabilities in the Level 3 category presented in the table below do not reflect the effect of offsetting gains and losses
on the related hedging instruments that are classified in Level 1 and Level 2.
$ millions, for the year ended October 31
Net gains (losses)
included in income
(1)
Net
gains (losses)
included in OCI
(4)
Transfer
in to
Level 3
Transfer
out of
Level 3
Purchases/
Issuances
Sales/
Settlements
Closing
balance
Opening
balance Realized
(2)
Unrealized
(2)(3)
2022
Debt securities mandatorily measured and
designated at FVTPL
Corporate debt $ 2 $ – $ – $ – $ – $ – $ – $ – $ 2
Mortgage- and asset-backed 55 – – – – – 205 (53) 207
Loans mandatorily measured at FVTPL
Business and government 1,038 – (15) 59 – – 58 (453) 687
Corporate equity mandatorily measured at
FVTPL and designated at FVOCI
(5)
396 11 53 (21) – – 102 (82) 459
Derivative instruments
Interest rate 35 – (46) – 27 – 1 1 18
Credit 49 (8) 4 – – – – – 45
Equity 13 1 (2) – 12 (21) 3 (2) 4
Total assets $ 1,588 $ 4 $ (6) $ 38 $ 39 $ (21) $ 369 $ (589) $ 1,422
Deposits and other liabilities
(6)
$ (742) $ (68) $ 58 $ – $ – $ 3 $ (131) $ 471 $ (409)
Derivative instruments
Interest rate (136) – (1,288) – – 11 (95) (25) (1,533)
Credit (54) 8 (4) – – – – – (50)
Equity (77) 4 (15) – (1) 75 (5) 16 (3)
Total liabilities $ (1,009) $ (56) $ (1,249) $ – $ (1) $ 89 $ (231) $ 462 $ (1,995)
2021
Debt securities mandatorily measured and
designated at FVTPL
Corporate debt $ 25 $ – $ 13 $ – $ – $ – $ 2 $ (38) $ 2
Mortgage- and asset-backed 135 – – – – – 44 (124) 55
Loans mandatorily measured at FVTPL
Business and government 626 – (3) (51) – – 556 (90) 1,038
Corporate equity mandatorily measured at
FVTPL and designated at FVOCI
(5)
256 – (5) 80 – – 160 (95) 396
Derivative instruments
Interest rate 48 – 1 – – (2) 3 (15) 35
Credit 98 (22) (27) – – – – – 49
Equity 212 (3) 2 – – (32) 10 (176) 13
Total assets $ 1,400 $ (25) $ (19) $ 29 $ – $ (34) $ 775 $ (538) $ 1,588
Deposits and other liabilities
(6)
$ 4 $ (340) $ (541) $ – $ (15) $ (14) $ (93) $ 257 $ (742)
Derivative instruments
Interest rate (28) – (28) – (26) (6) (31) (17) (136)
Credit (107) 22 34 – – – – (3) (54)
Equity (163) (41) (6) – – 58 (69) 144 (77)
Total liabilities $ (294) $ (359) $ (541) $ – $ (41) $ 38 $ (193) $ 381 $ (1,009)
(1) Cumulative AOCI gains or losses related to equity securities designated at FVOCI are reclassified from AOCI to retained earnings at the time of disposal or derecognition.
(2) Includes foreign currency gains and losses related to debt securities measured at FVOCI.
(3) Comprises unrealized gains and losses relating to these assets and liabilities held at the end of the reporting year.
(4) Foreign exchange translation on loans mandatorily measured at FVTPL held by foreign operations and denominated in the same currency as the foreign operations is
included in OCI.
(5) Certain prior year information has been reclassified to conform to the current year presentation.
(6) Includes deposits designated at FVTPL of $70 million (2021: $90 million), net bifurcated embedded derivative liabilities of $317 million (2021: net bifurcated embedded
derivative liabilities of $601 million) and other liabilities designated at FVTPL of $22 million (2021: $51 million).
CIBC 2022 ANNUAL REPORT 139

Consolidated financial statements
Quantitative information about significant non-observable inputs
Valuation techniques using one or more non-observable inputs are used for a number of financial instruments. The following table discloses the
valuation techniques and quantitative information about the significant non-observable inputs used in Level 3 financial instruments:
$ millions, as at October 31 2022 Valuation techniques Key non-observable inputs
Range of inputs
Low High
Securities mandatorily measured and
designated at FVTPL
Corporate debt
(1)
$ 2 Discounted cash flow Discount rate 6.9 % 6.9 %
Mortgage- and asset-backed 207 Discounted cash flow Credit spread 5.4 % 5.9 %
Market proxy or direct broker quote Market proxy or direct broker quote 0.5 0.5
Corporate equity mandatorily measured
at FVTPL and designated
at FVOCI
Limited partnerships and private
companies
(1)
459 Adjusted net asset value
(2)
Net asset value
(3)
n/a n/a
Valuation multiple Earnings multiple 7.9 x 9.8 x
Proxy share price Proxy share price n/a n/a
Loans mandatorily measured at FVTPL
Business and government
687 Discounted cash flow Credit spread 0.6
% 2.1 %
Derivative instruments
Interest rate 18 Proprietary model
(4)
n/a n/a n/a
Option model Market volatility 48.8 % 162.8 %
Probability assumption 100.0 % 100.0 %
Credit 45 Market proxy or direct broker quote Market proxy or direct broker quote – % 40.0 %
Equity 4 Option model Market correlation 46.8 % 98.2 %
Total assets $ 1,422
Deposits and other liabilities
Deposits designated at FVTPL and
net bifurcated embedded derivative
liabilities
$ (387) Option model Market volatility 17.3 % 30.9 %
Market correlation (100.0)% 100.0 %
Other liabilities designated at FVTPL (22) Option model Funding ratio 40.2 % 40.2 %
Derivative instruments
Interest rate (1,533) Proprietary model
(4)
n/a n/a n/a
Option model Market volatility 48.8 % 162.8 %
Probability assumption 100.0 % 100.0 %
Credit (50) Market proxy or direct broker quote Market proxy or direct broker quote – % 40.0 %
Equity (3) Option model Market correlation 35.4 % 98.2 %
Total liabilities $ (1,995)
(1) Certain prior year information has been reclassified to conform to the current year presentation.
(2) Adjusted net asset value is determined using reported net asset values obtained from the fund manager or general partner of the limited partnership or the limited liability
company and may be adjusted for current market levels where appropriate.
(3) The range of net asset value price or proxy share price has not been disclosed due to the wide range and diverse nature of the investments.
(4) Using valuation techniques that we consider to be non-observable.
n/a Not applicable.
Sensitivity of Level 3 financial assets and liabilities
The following section describes the significant non-observable inputs identified in the table above, the interrelationships between those inputs,
where applicable, and the change in fair value if changing one or more of the non-observable inputs within a reasonably possible range would
impact the fair value significantly.
The fair value of our limited partnerships is determined based on the net asset value provided by the fund managers, adjusted as appropriate.
The fair value of limited partnerships
is sensitive to changes in the net asset value, and by adjusting the net asset value within a reasonably possible
range, the aggregate fair value of our limited partnerships would increase or decrease by $109 million (2021: $90 million).
While our standalone derivatives are recorded as derivative assets or derivative liabilities, our derivatives embedded in our structured note
deposit liabilities or deposit liabilities designated at FVTPL are recorded within deposits and other liabilities.
The determination of the fair value of
certain Level 3 embedded derivatives and certain standalone derivatives requires significant assumptions and judgment to be applied to both the
inputs and the valuation techniques employed. These derivatives are sensitive to long-dated market volatility and correlation inputs, which we
consider to be non-observable. Market volatility is a measure of the anticipated future variability of a market price and is an important input for
pricing options, which are inherent in many of our Level 3 derivatives. A higher market volatility generally results in a higher option price, with all
else held constant, due to the higher probability of obtaining a greater return from the option, and results in an increase in the fair value of our
Level 3 derivatives. Correlation inputs are used to value those derivatives where the payout is dependent upon more than one market price. For
example, the payout of an equity basket option is based upon the performance of a basket of stocks, and the interrelationships between the price
movements of those stocks. A positive correlation implies that two inputs tend to change the fair value in the same direction, while a negative
correlation implies that two inputs tend to change the fair value in the opposite direction. Changes in market correlation could result in an increase
or a decrease in the fair value of our Level 3 derivatives and embedded derivatives. By adjusting the non-observable inputs by reasonably
alternative amounts, the fair value of our net Level 3 standalone derivatives and embedded derivatives would increase by $128 million or decrease
by $127 million (2021: increase by $95 million or decrease by $86 million).
For certain interest rate derivatives, the probability of early termination was a significant Level 3 valuation input. By increasing the probability of
early termination by 10%, the fair value of those derivatives in an asset position would decrease by less than $1 million, while the fair value of those
derivatives in a liability position would decrease by up to $62 million.
140 CIBC 2022 ANNUAL REPORT

Consolidated financial statements
Financial instruments designated at FVTPL
Financial assets designated at FVTPL include certain debt securities and loans that were designated at FVTPL on the basis of being managed
together with derivatives to eliminate or significantly reduce financial risks.
Deposits and other liabilities designated at FVTPL include:
• Certain business and government deposit liabilities, certain secured borrowings and certain obligations related to securities sold under
repurchase agreements that
are economically hedged with derivatives and other financial instruments, and certain financial liabilities that have
one or more embedded derivatives that significantly modify the cash flows of the host liability but are not bifurcated from the host instrument; and
• Our mortgage commitments to retail clients to provide mortgages at fixed rates that are economically hedged with derivatives and other
financial instruments.
The carrying value of our securities designated at FVTPL represents our maximum exposure to credit risk related to these assets designated at
FVTPL. The change in fair value attributable to change
in credit risk of these assets designated at FVTPL during the year is insignificant (2021:
insignificant). The fair value of a liability designated at FVTPL reflects the credit risk relating to that liability. For those liabilities designated at FVTPL
for which we believe changes in our credit risk would impact the fair value from the note holders’ perspective, the related fair value changes were
recognized in OCI. Changes in fair value attributable to changes in our own credit are measured as the difference between: (i) the period-over-
period change in the present value of the expected cash flows using a discount curve adjusted for our own credit; and (ii) the period-over-period
change in the present value of the same expected cash flows using a discount curve based on the benchmark curve adjusted for our own credit as
implied at inception of the liability designated at FVTPL. The pre-tax impact of changes in CIBC’s own credit risk on our liabilities designated at
FVTPL was gains of $355 million for the year and gains of $316 million cumulatively (2021: gains of $16 million for the year and losses of $39 million
cumulatively). A net gain of $81 million, net of hedges (2021: a net gain of $50 million), was realized for assets designated at FVTPL and liabilities
designated at FVTPL, which is included in the consolidated statement of income under Gains (losses) from financial instruments measured/
designated at FVTPL, net.
The estimated contractual amount payable at maturity of deposits designated at FVTPL, which is based on the par value and the intrinsic value
of the applicable embedded derivatives, is $3,576 million higher (2021: $872 million higher)
than its fair value. The intrinsic value of the embedded
derivatives reflects the structured payoff of certain FVO deposit liabilities, which we hedge economically with derivatives and other FVTPL financial
instruments.
Note 3 Significant transactions
2022
Acquisition of Canadian Costco credit card portfolio
On March 4, 2022, we completed the acquisition of the Canadian Costco credit card portfolio, which had an outstanding balance of $2.9 billion, for
cash consideration of $3.1 billion. We have also entered into a long-term agreement under which we have become the exclusive issuer of Costco-
branded MasterCard credit cards in Canada. The combined transaction was accounted for as an asset acquisition and included in our Canadian
Personal and Business Banking SBU. On the acquisition date, we recognized credit card receivables at their fair value of $2.8 billion and an
intangible asset for the purchased credit card relationships. During the fourth quarter of 2022, we finalized the purchase consideration and
recognized a reduction in the intangible asset to its fair value of $236 million.
Sale of certain banking assets in the Caribbean
On February 25, 2022, FirstCaribbean International Bank Limited (CIBC FirstCaribbean) completed the sale of its banking assets in Aruba upon the
satisfaction of the closing conditions. The proposed sales of banking assets in St. Vincent and St. Kitts received regulatory approval in the third
quarter of 2022 and are expected to close by the third quarter of 2023, subject to the satisfaction of closing conditions. In September 2022, CIBC
FirstCaribbean announced that its operations in Dominica will cease on January 31, 2023. The impacts upon the closing of these transactions and
closures are not expected to be material.
2021
Sale of CIBC FirstCaribbean
On November 8, 2019, we announced that we had entered into a definitive agreement to sell 66.73% of the outstanding shares of CIBC FirstCaribbean
to GNB Financial Group Limited (GNB), subject to regulatory approvals. On February 3, 2021, we announced that the proposed sale of CIBC
FirstCaribbean to GNB did not receive approval from CIBC FirstCaribbean’s regulators and that the transaction will not proceed.
CIBC 2022 ANNUAL REPORT 141

Consolidated financial statements
Note 4 Securities
Securities
$ millions, as at October 31
2022 2021
Securities measured and designated at FVOCI
(1)
$ 56,099 $ 53,997
Securities measured at amortized cost
(2)
52,484 35,159
Securities mandatorily measured and designated at FVTPL 67,296 72,245
$ 175,879 $ 161,401
(1) Certain prior year information has been reclassified to conform to the current year presentation.
(2) During the year, less than $1 million of amortized cost debt securities were disposed of, generally shortly before their maturity, resulting in a realized gain of less than
$1 million (2021: a realized gain of less than $1 million).
$ millions, as at October 31
Residual term to contractual maturity
2022
Total
2021
Total Within 1 year 1 to 5 years 5 to 10 years Over 10 years
No specific
maturity
Carrying
value Yield
(1)
Carrying
value Yield
(1)
Carrying
value Yield
(1)
Carrying
value Yield
(1)
Carrying
value Yield
(1)
Carrying
value Yield
(1)
Carrying
value
Yield
(1)
Debt securities measured at FVOCI
Securities issued or guaranteed by:
Canadian federal government
$ 2,222 2.9 % $ 7,050 3.8 % $ 1,367 3.6 % $ – – % $ – – %$ 10,639 3.6 % $ 8,340 0.9 %
Other Canadian governments
842 1.7 6,422 4.0 9,947 3.5 241 3.4 – – 17,452 3.6 14,189 2.0
U.S. Treasury and agencies
3,524 2.0 8,300 1.5 135 3.4 – – – – 11,959 1.7 14,127 0.5
Other foreign governments
3,792 2.5 3,047 3.0 176 5.4 23 6.1 – – 7,038 2.8 6,775 0.7
Mortgage-backed securities
(2)
67 2.5 193 3.4 322 2.7 581 3.8 – – 1,163 3.3 1,545 1.4
Asset-backed securities
– – – – – – 359 5.5 – – 359 5.5 352 1.3
Corporate debt
1,583 3.4 4,549 3.2 819 3.4 16 4.0 – – 6,967 3.2 7,833 0.5
$ 12,030 $ 29,561 $ 12,766 $ 1,220 $ – $ 55,577 $ 53,161
142 CIBC 2022 ANNUAL REPORT
Securities measured at amortized cost
Securities issued or guaranteed by:
Canadian federal government
$ – – % $ 2,159 1.8 % $ 53 4.0 % $ – – % $ – – % $ 2,212 1.8 % $ 1,668 1.2 %
Other Canadian governments
1,102 4.0 8,879 3.2 4,033 4.0 458 4.2 – – 14,472 3.5 12,020 1.8
U.S. Treasury and agencies
4,430 1.4 19,856 1.4 2,565 2.0 – – – – 26,851 1.5 12,874 1.3
Other foreign governments
62 0.5 382 1.7 204 2.4 533 1.4 – – 1,181 1.7 695 1.1
Mortgage-backed securities
(3)
374 0.5 1,436 1.6 1,318 2.2 509 2.8 – – 3,637 1.9 3,412 1.6
Asset-backed securities
– – 103 2.4 347 4.6 40 8.3 – – 490 4.4 309 2.3
Corporate debt
869 4.0 2,525 2.4 247 2.2 – – – – 3,641 2.7 4,181 1.3
$ 6,837 $ 35,340 $ 8,767 $ 1,540 $ – $ 52,484 $ 35,159
Securities mandatorily measured and
designated at FVTPL
Securities issued or guaranteed by:
Canadian federal government
$ 2,850 $ 3,914 $ 2,323 $ 1,735 $ – $ 10,822 $ 8,452
Other Canadian governments
1,294 1,764 890 4,686 – 8,634 10,334
U.S. Treasury and agencies
1,534 2,553 633 486 – 5,206 4,935
Other foreign governments
2,485 894 66 43 – 3,488 4,031
Mortgage-backed securities
(4)
331 2,332 215 – – 2,878 1,957
Asset-backed securities
821 157 4 3 – 985 333
Corporate debt
1,192 1,438 661 320 – 3,611 3,999
$ 10,507 $ 13,052 $ 4,792 $ 7,273 $ – $ 35,624 $ 34,041
Corporate equity mandatorily measured
at FVTPL and designated at
FVOCI
(5)
$ – – % $ – – % $ – – % $ – – % $ 32,194 n/m $ 32,194 n/m $ 39,040 n/m
Total securities
(6)
$ 29,374 $ 77,953 $ 26,325 $ 10,033 $ 32,194 $ 175,879 $ 161,401
(1) Represents the weighted-average yield, which is determined by applying the weighted average of the yields of individual fixed income securities.
(2) Includes securities backed by mortgages insured by the Canada Mortgage and Housing Corporation (CMHC), with amortized cost of $192 million (2021: $301 million)
and fair value of $193 million (2021: $303 million); securities issued by Federal National Mortgage Association (Fannie Mae), with amortized cost of $439 million
(2021: $537 million) and fair value of $416 million (2021: $554 million); securities issued by Federal Home Loan Mortgage Corporation (Freddie Mac), with amortized cost
of $190 million (2021: $235 million) and fair value of $180 million (2021: $243 million); and securities issued by Government National Mortgage Association, a U.S.
government corporation (Ginnie Mae), with amortized cost of $381 million (2021: $443 million) and fair value of $374 million (2021: $445 million).
(3) Includes securities backed by mortgages insured by the CMHC, with amortized cost of $225 million (2021: $419 million) and fair value of $225 million (2021: $420 million);
securities issued by Fannie Mae, with amortized cost of $806 million (2021: $838 million) and fair value of $743 million (2021: $851 million); securities issued by Freddie
Mac, with amortized cost of $1,962 million (2021: $1,823 million) and fair value of $1,777 million (2021: $1,859 million); and securities issued by Ginnie Mae, with amortized
cost of $57 million (2021: $39 million) and fair value of $52 million (2021: $40 million).
(4) Includes securities backed by mortgages insured by the CMHC of $2,877 million (2021: $1,954 million).
(5) Certain prior year information has been reclassified to conform to the current year presentation.
(6) Includes securities denominated in U.S. dollars with carrying value of $83.2 billion (2021: $80.2 billion) and securities denominated in other foreign currencies with carrying
value of $8,851 million (2021: $4,611 million).
n/m Not meaningful.

Consolidated financial statements
Fair value of debt securities measured and equity securities designated at FVOCI
$ millions, as at October 31 2022 2021
Cost/
Amortized
cost
(1)
Gross
unrealized
gains
Gross
unrealized
losses
Fair
value
Cost/
Amortized
cost
(1)
Gross
unrealized
gains
Gross
unrealized
losses
Fair
value
Securities issued or guaranteed by:
Canadian federal government $ 10,646 $ 10 $ (17) $ 10,639 $ 8,310 $ 31 $ (1) $ 8,340
Other Canadian governments 17,494 32 (74) 17,452 14,007 182 – 14,189
U.S. Treasury and agencies 12,305 5 (351) 11,959 14,157 23 (53) 14,127
Other foreign governments 7,048 21 (31) 7,038 6,750 30 (5) 6,775
Mortgage-backed securities 1,202 1 (40) 1,163 1,516 29 – 1,545
Asset-backed securities 375 – (16) 359 354 – (2) 352
Corporate debt 7,023 – (56) 6,967 7,820 15 (2) 7,833
56,093 69 (585) 55,577 52,914 310 (63) 53,161
Corporate equity
(2)(3)
525 31 (34) 522 730 144 (38) 836
$ 56,618 $ 100 $ (619) $ 56,099 $ 53,644 $ 454 $ (101) $ 53,997
(1) Net of allowance for credit losses for debt securities measured at FVOCI of $24 million (2021: $19 million).
(2) Includes restricted stock.
(3) Certain prior year information has been reclassified to conform to the current year presentation.
Fair value of equity securities designated at FVOCI that were disposed of during the year was $104 million (2021: $25 million) at the time of disposal.
Net realized cumulative after-tax gains of $45 million for the year (2021: $27 million) were reclassified from AOCI to retained earnings, resulting from
dispositions of equity securities designated at FVOCI and return on capital distributions from limited partnerships designated at FVOCI.
Dividend income recognized on equity securities designated at FVOCI that were still held as at October 31, 2022 was $7 million (2021: $5 million).
Dividend income recognized on equity securities designated at FVOCI that were disposed
of during the year was nil (2021: nil).
The table below presents profit or loss recognized on FVOCI debt securities:
$ millions, for the year ended October 31 2022 2021
Realized gains $ 57 $ 91
Realized losses (23) (2)
(Provision for) reversal of credit losses on debt securities (2) 2
$ 32 $ 91
Allowance for credit losses
The following table provides a reconciliation of the opening balance to the closing balance of the ECL allowance for debt securities measured at
FVOCI:
$ millions, as at or for the year ended October 31
Stage 1 Stage 2 Stage 3
Total
Collective provision
12-month ECL
performing
Collective provision
lifetime ECL
performing
Collective and
individual provision
lifetime ECL
credit-impaired
2022 Debt securities measured at FVOCI
Balance at beginning of year $ 4 $ 15 $ – $ 19
Provision for (reversal of) credit losses
(1)
– 2 – 2
Write-offs – – – –
Foreign exchange and other – 3 – 3
Balance at end of year $ 4 $20 $ – $24
2021 Debt securities measured at FVOCI
Balance at beginning of year $ 18 $ 4 $ – $ 22
Provision for (reversal of) credit losses
(1)
(13) 11 – (2)
Write-offs – – – –
Foreign exchange and other (1) – – (1)
Balance at end of year $ 4 $ 15 $ – $ 19
(1) Included in the Gains (losses) from debt securities measured at FVOCI and amortized cost, net on our consolidated statement of income.
Note 5 Loans
(1)(2)
$ millions, as at October 31 2022 2021
Gross
amount
Stage 3
allowance
Stages 1
and 2
allowance
Total
allowance
(3)
Net
total
Allowances
as a % of
gross loans
Gross
amount
Stage 3
allowance
Stages 1
and 2
allowance
Total
allowance
(3)
Net
total
Allowances
as a % of
gross loans
Residential mortgages
(4)
$ 269,706 $ 167 $ 126 $ 293 $ 269,413 0.1 % $ 251,526 $ 158 $ 122 $ 280 $ 251,246 0.1 %
Personal 45,429 146 756 902 44,527 2.0 41,897 106 662 768 41,129 1.8
Credit card 16,479 – 784 784 15,695 4.8 11,134 – 625 625 10,509 5.6
Business and government
(4)
188,542 351 743 1,094 187,448 0.6 150,213 508 668 1,176 149,037 0.8
$ 520,156 $ 664 $ 2,409 $ 3,073 $ 517,083 0.6 % $ 454,770 $ 772 $ 2,077 $ 2,849 $ 451,921 0.6 %
(1) Loans are net of unearned income of $689 million (2021: $591 million).
(2) Includes gross loans of $111.8 billion (2021: $83.3 billion) denominated in U.S. dollars and $9.8 billion (2021: $9.3 billion) denominated in other foreign currencies.
(3) Includes ECL allowances for customers’ liability under acceptances.
(4) Includes $4 million of residential mortgages (2021: $16 million) and $963 million of business and government loans (2021: $25,983 million) that are measured and
designated at FVTPL.
CIBC 2022 ANNUAL REPORT 143

Consolidated financial statements
Allowance for credit losses
The following table provides a reconciliation of the opening balance to the closing balance of the ECL allowance:
$ millions, as at or for the year ended October 31 2022
Stage 1 Stage 2 Stage 3
Total
Collective provision
12-month ECL
performing
Collective provision
lifetime ECL
performing
Collective and
individual provision
lifetime ECL
credit-impaired
Residential mortgages
Balance at beginning of year $ 59 $ 63 $ 158 $ 280
Originations net of repayments and other derecognitions 17 (7) (25) (15)
Changes in model (4) (1) – (5)
Net remeasurement
(1)
(89) 85 85 81
Transfers
(1)
– to 12-month ECL 82 (77) (5) –
– to lifetime ECL performing (9) 16 (7) –
– to lifetime ECL credit-impaired (1) (12) 13 –
Provision for (reversal of) credit losses
(2)
(4) 4 61 61
Write-offs
(3)
– – (47) (47)
Recoveries – – 2 2
Interest income on impaired loans – – (16) (16)
Foreign exchange and other 2 2 9 13
Balance at end of year $ 57 $ 69 $ 167 $ 293
Personal
Balance at beginning of year $ 150 $ 547 $ 106 $ 803
Originations net of repayments and other derecognitions 37 (55) (14) (32)
Changes in model 1 19 – 20
Net remeasurement
(1)
(349) 500 195 346
Transfers
(1)
– to 12-month ECL 336 (333) (3) –
– to lifetime ECL performing (40) 52 (12) –
– to lifetime ECL credit-impaired – (75) 75 –
Provision for (reversal of) credit losses
(2)
(15) 108 241 334
Write-offs
(3)
– – (274)
(274)
Recoveries – – 69 69
Interest income on impaired loans – – (4) (4)
Foreign exchange and other 2 1 8 11
Balance at end of year $ 137 $ 656 $ 146 $ 939
Credit card
Balance at beginning of year $ 136 $ 517 $ – $ 653
Originations net of repayments and other derecognitions
(4)
76 (38) – 38
Changes in model – – – –
Net remeasurement
(1)
(437) 747 150 460
Transfers
(1)
– to 12-month ECL 436 (436) – –
– to lifetime ECL performing (52) 52 – –
– to lifetime ECL credit-impaired – (133) 133 –
Provision for (reversal of) credit losses
(2)
23 192 283 498
Write-offs
(3)
– – (397) (397)
Recoveries – – 114 114
Interest income on impaired loans – – – –
Foreign exchange and other – – – –
Balance at end of year $ 159 $ 709 $ – $ 868
Business and government
Balance at beginning of year $ 277 $ 449 $ 508 $ 1,234
Originations net of repayments and other derecognitions 41 (12) (34) (5)
Changes in model 30 (4) – 26
Net remeasurement
(1)
(95) 89 149 143
Transfers
(1)
– to 12-month ECL 98 (91) (7) –
– to lifetime ECL performing (34) 38 (4) –
– to lifetime ECL credit-impaired (1) (7) 8 –
Provision for (reversal of) credit losses
(2)
39 13 112 164
Write-offs
(3)
– – (312) (312)
Recoveries – – 33 33
Interest income on impaired loans – – (15) (15)
Foreign exchange and other 19 28 25 72
Balance at end of year $ 335 $ 490 $ 351 $ 1,176
Total ECL allowance
(5)
$ 688 $ 1,924 $ 664 $ 3,276
Comprises:
Loans $ 600 $ 1,809 $ 664 $ 3,073
Undrawn credit facilities and other off-balance sheet exposures
(6)
88 115 – 203
(1) Transfers represent stage movements of prior year ECL allowances to the current year stage classification. Net remeasurement represents the current year change in ECL
allowances for transfers, net write-offs, changes in forecasts of forward-looking information, parameter updates, and partial repayments in the year.
(2) Provision for (reversal of) credit losses for loans, and undrawn credit facilities and other off-balance sheet exposures is presented as Provision for (reversal of) credit losses
on our consolidated statement of income.
(3) We generally continue to pursue collection on the amounts that were written off. The degree of collection efforts varies from one jurisdiction to another, depending on the
local regulations and original agreements with customers.
(4) Includes ECL allowances of $63 million recognized immediately after the acquisition of the Canadian Costco credit card portfolio on March 4, 2022.
(5) See Note 4 for the ECL allowance on debt securities measured at FVOCI. The table above excludes the ECL allowance on debt securities classified at amortized cost
of $15 million as at October 31, 2022 (2021: $15 million), $12 million of which was stage 3 ECL allowance on originated credit-impaired amortized cost debt securities
(2021: $13 million). The ECL allowances for other financial assets classified at amortized cost were immaterial as at October 31, 2022 and October 31, 2021 and were
excluded from the table above. Financial assets other than loans that are classified at amortized cost are presented on our consolidated balance sheet net of ECL allowances.
(6) Included in Other liabilities on our consolidated balance sheet.
144 CIBC 2022 ANNUAL REPORT

Consolidated financial statements
$ millions, as at or for the year ended October 31 2021
Stage 1 Stage 2 Stage 3
Total
Collective provision
12-month ECL
performing
Collective provision
lifetime ECL
performing
Collective and
individual provision
lifetime ECL
credit-impaired
Residential mortgages
Balance at beginning of year $ 51 $ 161 $ 151 $ 363
Originations net of repayments and other derecognitions 16 (13) (21) (18)
Changes in model 7 (8) 24 23
Net remeasurement
(1)
(123) 22 68 (33)
Transfers
(1)
– to 12-month ECL 119 (104) (15) –
– to lifetime ECL performing (9) 27 (18) –
– to lifetime ECL credit-impaired – (16) 16 –
Provision for (reversal of) credit losses
(2)
10 (92) 54 (28)
Write-offs
(3)
– – (27) (27)
Recoveries – – 3 3
Interest income on impaired loans – – (17) (17)
Foreign exchange and other (2) (6) (6) (14)
Balance at end of year $ 59 $ 63 $ 158 $ 280
Personal
Balance at beginning of year $ 204 $ 546 $ 113 $ 863
Originations net of repayments and other derecognitions 37 (47) (9) (19)
Changes in model (19) 33 – 14
Net remeasurement
(1)
(309) 281 179 151
Transfers
(1)
– to 12-month ECL 287 (281) (6) –
– to lifetime ECL performing (47) 62 (15) –
– to lifetime ECL credit-impaired (1) (47) 48 –
Provision for (reversal of) credit losses
(2)
(52) 1 197 146
Write-offs
(3)
– – (266) (266)
Recoveries – – 70 70
Interest income on impaired loans – – (4) (4)
Foreign exchange and other (2) – (4) (6)
Balance at end of year $ 150 $ 547 $ 106 $ 803
Credit card
Balance at beginning of year $ 136 $ 572 $ – $ 708
Originations net of repayments and other derecognitions – (66) – (66)
Changes in model (14) 123 – 109
Net remeasurement
(1)
(259) 373 83 197
Transfers
(1)
– to 12-month ECL 305 (305) – –
– to lifetime ECL performing (31) 31 – –
– to lifetime ECL credit-impaired (1) (211) 212 –
Provision for (reversal of) credit losses
(2)
– (55) 295 240
Write-offs
(3)
– – (414) (414)
Recoveries – – 119 119
Interest income on impaired loans – – – –
Foreign exchange and other – – – –
Balance at end of year $ 136 $ 517 $ – $ 653
Business and government
Balance at beginning of year $ 453 $ 683 $ 652 $ 1,788
Originations net of repayments and other derecognitions 31 (35) (35) (39)
Changes in model (12) (26) 1 (37)
Net remeasurement
(1)
(302) (19) 197 (124)
Transfers
(1)
– to 12-month ECL 198 (173) (25) –
– to lifetime ECL performing (63) 79 (16) –
– to lifetime ECL credit-impaired (4) (30) 34 –
Provision for (reversal of) credit losses
(2)
(152) (204) 156 (200)
Write-offs
(3)
– – (279) (279)
Recoveries – – 14 14
Interest income on impaired loans – – (20) (20)
Foreign exchange and other (24) (30) (15) (69)
Balance at end of year $ 277 $ 449 $ 508 $ 1,234
Total ECL allowance
(5)
$ 622 $ 1,576 $ 772 $ 2,970
Comprises:
Loans $ 551 $ 1,526 $ 772 $ 2,849
Undrawn credit facilities and other off-balance sheet exposures
(6)
71 50 – 121
See previous page for footnote references.
CIBC 2022 ANNUAL REPORT 145

Consolidated financial statements
Impact of acquisition of Canadian Costco credit card portfolio
No ECL allowance was recognized in the purchase equation on the acquisition date for the acquired Canadian Costco credit card portfolio as the
purchased loans were initially measured at their acquisition date fair values. Instead, immediately after the acquisition date, ECL allowances were
established in the Provision for credit losses in the interim consolidated statement of income based on classifying each acquired credit card
receivable in stage 1, since the acquisition date is established as the initial recognition date of purchased performing loans for the purpose of
assessing whether a SICR has occurred. On the date of acquisition, none of the acquired credit card receivables were considered to be impaired.
Subsequent to the acquisition date, ECL allowances are estimated in a manner consistent with our SICR and impairment policies that we apply to
loans that we originate. See Note 3 for further details on the acquisition of the Canadian Costco credit card portfolio.
Inputs, assumptions and model techniques
Our ECL allowances are estimated using complex models that incorporate inputs, assumptions and model techniques that involve a high degree of
management judgment. In particular, the following ECL elements are subject to a high level of judgment that can have a significant impact on the
level of ECL allowances provided:
• Determining when a SICR of a loan has occurred;
• Measuring both 12-month and lifetime credit losses; and
• Forecasting forward-looking information for multiple scenarios and determining the probability weighting of the scenarios driven by the
changes in the macroeconomic environment.
In addition, the interrelationship between these elements is also subject to a high degree of judgment which can also have a significant impact on
the level of ECL recognized.
Global economic activity has slowed over the second half of 2022 while we continue to operate in an uncertain macroeconomic environment. There
is inherent uncertainty in estimating the impact that rising interest rates, inflation and supply chain disruptions exacerbated by the measures
imposed in some countries to combat the spread of COVID-19 and geopolitical events, will have on the macroeconomic environment. As a result, a
heightened level of judgment in estimating ECLs in respect of all these elements as discussed below, continued to be required.
Determining when a significant increase in credit risk has occurred
The determination of whether a loan has experienced a SICR has a significant impact on the level of ECL allowance as loans that are in stage 1 are
measured at 12-month ECL, while loans in stage 2 are measured at lifetime ECL. Migration of loans between stage 1 and stage 2 can cause
significant volatility in the amount of the recognized ECL allowances and the provision for credit losses in a particular period.
For the majority of our retail loan portfolios, we determine a SICR based on relative changes in the loan’s lifetime PD since its initial recognition. The PDs
used for this purpose are the expected value of our upside, downside and base case lifetime PDs. Significant judgment is involved in determining the upside,
downside and base case lifetime PDs through the incorporation of forward-looking information into long-run PDs, in determining the probability weightings of
the scenarios, and in determining the relative changes in PDs that are indicative of a SICR for our various retail products. Increases in the expected PDs or
decreases in the thresholds for changes in PDs that are indicative of a SICR can cause significant migration of loans from stage 1 to stage 2, which in turn
can cause a significant increase in the amount of ECL allowances recognized. In contrast, decreases in the expected PDs or increases in the thresholds for
changes in PDs that are indicative of a SICR can cause significant migration of loans from stage 2 to stage 1.
For the majority of our business and government loan portfolios, we determine a SICR based on relative changes in internal risk ratings since
initial recognition. Significant judgment is involved in the determination of the internal risk ratings. Deterioration or improvement in the risk ratings or
adjustments to the risk rating downgrade thresholds used to determine a SICR can cause significant migration of loans and securities between
stage 1 and stage 2, which in turn can have a significant impact on the amount of ECL allowances recognized.
While potentially significant to the level of ECL allowances recognized, the thresholds for changes in PDs that are indicative of a SICR for our
retail portfolios and the risk rating downgrade thresholds used to determine a SICR for our business and government loan portfolios are not
expected to change significantly over time.
All loans on which repayment of principal or payment of interest is contractually 30 days in arrears and all business and government loans that
have migrated to the watch list risk rating are normally automatically migrated to stage 2 from stage 1.
As at October 31, 2022, if the ECL for the stage 2 performing loans were measured using stage 1 ECL as opposed to lifetime ECL, the ECLs
would be $1,110 million lower than the total recognized IFRS 9 ECL on performing loans (2021: $731 million).
Measuring both 12-month and lifetime expected credit losses
Our ECL models leverage the PD, LGD, and EAD parameters, as well as the portfolio segmentation used to calculate Basel expected loss
regulatory adjustments for the portion of our retail and business and government portfolios under the advanced internal ratings-based (AIRB)
approach. Adjustments are made to the Basel parameters to meet IFRS 9 requirements, including the conversion of through-the-cycle and downturn
parameters used in the Basel regulatory calculations to point-in-time parameters used under IFRS 9 that consider forward-looking information. For
standardized business and government portfolios, available long-run PDs, LGDs and EADs are also converted to point-in-time parameters through
the incorporation of forward-looking information for the purpose of measuring ECL under IFRS 9.
Significant judgment is involved in determining which forward-looking information variables are relevant for particular portfolios and in determining
the extent by which through-the-cycle parameters should be adjusted for forward-looking information to determine point-in-time parameters. While
changes in the set of forward-looking information variables used to convert through-the-cycle PDs, LGDs and EADs into point-in-time parameters can
either increase or decrease ECL allowances in a particular period, changes to the mapping of forward-looking information variables to particular portfolios
are expected to be infrequent. However, changes in the particular forward-looking information parameters used to quantify point-in-time parameters will
be frequent as our forecasts are updated on a quarterly basis. Increases in the level of pessimism in the forward-looking information variables will cause
increases in ECL, while increases in the level of optimism in the forward-looking information variables will cause decreases in ECL. These increases and
decreases could be significant in any particular period and will start to occur in the period where our outlook of the future changes.
With respect to the lifetime of a financial instrument, the maximum period considered when measuring ECL is the maximum contractual period
over which we are exposed to credit risk. For revolving facilities, such as credit cards, the lifetime of a credit card account is the expected
behavioural life. Significant judgment is involved in the estimate of the expected behavioural life. Increases in the expected behavioural life will
increase the amount of ECL allowances, in particular for revolving loans in stage 2.
146 CIBC 2022 ANNUAL REPORT

Consolidated financial statements
Forecasting forward-looking information for multiple scenarios and determining the probability weighting of the scenarios
As indicated above, forward-looking information is incorporated into both our assessment of whether a financial asset has experienced a SICR since
its initial recognition and in our estimate of ECL. From analysis of historical data, our risk management function has identified and reflected in our
ECL allowance those relevant forward-looking information variables that contribute to credit risk and losses within our retail and business and
government loan portfolios. Within our retail loan portfolio, key forward-looking information variables include Canadian unemployment rates, housing
prices, gross domestic product (GDP) growth and household debt service ratios. In many cases these variables are forecasted at the provincial
level. Housing prices are also forecasted at the municipal level in some cases. Within our business and government loan portfolio, key drivers that
impact the credit performance of the entire portfolio include Standard & Poor’s (S&P) 500 growth rates, business credit growth rates, unemployment
rates and credit spreads, while forward-looking information variables such as commodity prices and mining activity are significant for certain
portfolios, and U.S. unemployment rates and U.S. GDP growth are significant for our U.S. portfolios.
For the majority of our loan portfolios, our forecast of forward-looking information variables is established from a “base case” or most likely
scenario
that is used internally by management for planning and forecasting purposes. For most of the forward-looking information variables related
to our Canadian businesses, we have forecast scenarios by province. In forming the base case scenario, we consider the forecasts of international
organizations and monetary authorities such as the Organisation for Economic Co-operation and Development, the International Monetary Fund,
and the Bank of Canada, as well as private sector economists. We then derive reasonably possible “upside case” and “downside case” scenarios
using external forecasts that are above and below our base case and the application of management judgment. A probability weighting is assigned
to our base case, upside case and downside case scenarios based on management judgment.
The forecasting process is overseen by a governance committee consisting of internal stakeholders from across our bank including Risk
Management, Economics, Finance and the impacted SBUs and involves
a significant amount of judgment both in determining the forward-looking
information forecasts for our various scenarios and in determining the probability weighting assigned to the scenarios. In general, a worsening of our
outlook on forecasted forward-looking information for each scenario, an increase in the probability of the downside case scenario occurring, or a
decrease in the probability of the upside case scenario occurring will increase the number of loans migrating from stage 1 to stage 2 and increase
the estimated ECL allowance. In contrast, an improvement in our outlook on forecasted forward-looking information, an increase in the probability of
the upside case scenario occurring, or a decrease in the probability of the downside case scenario occurring will have the opposite impact. It is not
possible to meaningfully isolate the impact of changes in the various forward-looking information variables for a particular scenario because of both
the interrelationship between the variables and the interrelationship between the level of pessimism inherent in a particular scenario and its
probability of occurring.
The forecasting of forward-looking information and the determination of scenario weightings continued to require a heightened application of
judgment in a number of areas as our forecast reflects numerous assumptions and uncertainties inherent in the current macroeconomic
environment.
The following table provides the base case, upside case and downside case scenario forecasts for select forward-looking information
variables used
to estimate our ECL.
As at October 31, 2022
Base case Upside case Downside case
Average
value over
the next
12 months
Average
value over
the remaining
forecast period
(1)
Average
value over
the next
12 months
Average
value over
the remaining
forecast period
(1)
Average
value over
the next
12 months
Average
value over
the remaining
forecast period
(1)
Real GDP year-over-year growth
Canada
(2)
0.8 % 1.5 % 3.9 % 2.8 % (0.6)% 1.0 %
United States
0.7 % 1.3 % 2.9 % 3.0 % (2.1)% 0.4 %
Unemployment rate
Canada
(2)
5.5 % 5.9 % 4.9 % 5.6 % 6.0 % 6.8 %
United States
4.0 % 4.2 % 3.3 % 3.3 % 5.6 % 5.1 %
Canadian Housing Price Index growth
(2)
(2.5)% 1.9 % 10.1 % 6.6 % (13.1)% (5.2)%
S&P 500 Index growth rate
(1.4)% 6.0 % 6.3 % 12.1 % (13.4)% (1.3)%
Canadian household debt service ratio
15.5 % 15.1 % 14.4 % 14.5 % 15.9 % 15.2 %
West Texas Intermediate Oil Price (US$)
$92 $81 $119 $107 $76 $56
(1) The remaining forecast period is generally four years.
(2)
National-level forward-looking forecasts are presented in the table above, which represent the aggregation of the provincial-level forecasts used to estimate our ECL.
Housing Price Index growth rates are also forecasted at the municipal level in some cases. As a result, the forecasts for individual provinces or municipalities reflected in
our ECL will differ from the national forecasts presented above.
As at October 31, 2021
Base case Upside case Downside case
Average
value over
the next
12 months
Average
value over
the remaining
forecast period
(1)
Average
value over
the next
12 months
Average
value over
the remaining
forecast period
(1)
Average
value over
the next
12 months
Average
value over
the remaining
forecast period
(1)
Real GDP year-over-year growth
Canada
(2)
4.2 % 2.4 % 5.6 % 2.8 % 3.1 % 1.6 %
United States 4.7 % 2.2 % 5.8 % 3.3 % 2.8 % 1.3 %
Unemployment rate
Canada
(2)
6.4 % 5.9 % 6.0 % 5.5 % 7.3 % 6.8 %
United States 4.4 % 3.9 % 3.8 % 3.4 % 6.0 % 5.0 %
Canadian Housing Price Index growth
(2)
6.1 % 2.8 % 10.7 % 6.3 % 2.2 % (2.2)%
S&P 500 Index growth rate 6.1 % 4.6 % 10.3 % 8.6 % (0.6)% (1.7)%
Canadian household debt service ratio 13.6 % 14.4 % 13.0 % 14.2 % 14.1 % 14.7 %
West Texas Intermediate Oil Price (US$) $ 69 $ 64 $ 74 $ 81 $ 56 $ 54
See above for footnote references.
CIBC 2022 ANNUAL REPORT 147

Consolidated financial statements
As required, the forward-looking information used to estimate ECLs reflects our expectations as at October 31, 2022 and October 31, 2021,
respectively, and does not reflect changes in expectation as a result of economic forecasts that may have subsequently emerged. The base case,
upside case and downside case amounts shown represent the average value of the forecasts over the respective projection horizons. Our
underlying base case projection as at October 31, 2022 is characterized by weaker GDP growth for the remainder of calendar 2022 and 2023, due
to continued uncertainty related to the expectation that central banks will continue to raise interest rates in response to prolonged inflationary
pressures, and the impact of supply chain disruptions related to COVID-19 measures imposed in some countries, elevated worker absenteeism
levels, and geopolitical events. Significant judgment continued to be inherent in the forecasting of forward-looking information, including with regard
to our base case assumptions that the increase in interest rates will result in only modest economic growth, global supply chain and inflationary
challenges will ease, vaccination programs and other treatments will be able to effectively respond to the new and emerging variants, governments
will respond to future waves of the virus with targeted health measures rather than broader economic closures, and that the war in Ukraine will not
expand into a broader conflict. While U.S. GDP had contracted in early 2022, it is expected to experience modest growth over the remainder of the
year and until the end of calendar 2024, with a gradual increase in the unemployment rate until the end of calendar 2024.
The downside case forecast assumes a recession until mid-calendar year 2023 for Canada and a more prolonged recession in the U.S.
resulting from aggressive interest rate hikes introduced to combat the prolonged high levels of inflation, and a worsening of geopolitical tensions
and COVID-19 lockdown measures in some countries that exacerbate supply chain issues. It also reflects a slower recovery thereafter to a lower
level of sustained economic activity and an unemployment rate persistently above where it stood pre-pandemic. Meanwhile, the upside scenario
continues to reflect a recovery, with absolute levels of GDP reached in calendar 2022 that are consistent with the levels that would have occurred if
the pre-pandemic level of GDP had continued to increase through the pandemic at pre-pandemic growth rates and continuing at a higher trend
level than the base case thereafter.
As indicated above, forecasting forward-looking information for multiple scenarios and determining the probability weighting of the scenarios
involves a high degree of
management judgment. Assumptions concerning measures used by governments to combat inflation, the economic risks
emanating from the war in Ukraine, and the degree to which vaccinations and other treatments will contain existing and potential new variants such
that severe restrictions will no longer need to be imposed by most governments to limit the impact of subsequent waves of infection are material to
these forecasts.
If we were to only use our base case scenario for the measurement of ECL for our performing loans, our ECL allowance would be $248 million
lower than the recognized
ECL as at October 31, 2022 (2021: $249 million). If we were to only use our downside case scenario for the
measurement of ECL for our performing loans, our ECL allowance would be $847 million higher than the recognized ECL as at October 31, 2022
(2021: $414 million). This sensitivity is isolated to the measurement of ECL and therefore did not consider changes in the migration of exposures
between stage 1 and stage 2 from the determination of the SICR that would have resulted in a 100% base case scenario or a 100% downside case
scenario. As a result, our ECL allowance on performing loans could exceed the amount implied by the 100% downside case scenario from the
migration of additional exposures from stage 1 to stage 2. Actual credit losses could differ materially from those reflected in our estimates.
Use of management overlays
Management overlays to ECL allowance estimates are adjustments which we use in circumstances where we judge that our existing inputs,
assumptions and model techniques do not capture all relevant risk factors. The emergence of new macroeconomic, microeconomic or political
events, along with expected changes to parameters, models or data that are not incorporated in our current parameters, internal risk rating
migrations, or forward-looking information are examples of such circumstances. To address the uncertainties inherent in the current environment, we
continue to utilize management overlays with respect to the impact of certain forward-looking information and credit metrics that are not expected to
be as indicative of the credit condition of the portfolios as the historical experience in our models would have otherwise suggested, including with
respect to the benefit of higher levels of household savings that have accumulated during the pandemic. The use of management overlays requires
the application of significant judgment that impacts the amount of ECL allowances recognized. Actual credit losses could differ materially from those
reflected in our estimates.
148 CIBC 2022 ANNUAL REPORT

Consolidated financial statements
The following tables provide the gross carrying amount of loans, and the contractual amounts of undrawn credit facilities and other off-balance
sheet exposures based on the application of our 12-month point-in-time PDs under IFRS 9 to our risk management PD bands within each respective
stage for retail exposures, and based on our internal risk ratings for business and government exposures. Refer to the “Credit risk” section of the
MD&A for details on the CIBC risk categories.
Loans
(1)
$ millions, as at October 31 2022 2021
Stage 1 Stage 2 Stage 3
(2)(3)
Total Stage 1 Stage 2 Stage 3
(2)(3)
Total
Residential mortgages
– Exceptionally low $ 174,749 $ 140 $ – $ 174,889 $ 162,307 $ 94 $ – $ 162,401
– Very low 53,795 498 – 54,293 49,958 640 – 50,598
– Low 24,200 6,816 – 31,016 22,912 6,547 – 29,459
– Medium 261 4,927 – 5,188 364 4,671 – 5,035
– High – 906 – 906 – 840 – 840
– Default – – 374 374 – – 443 443
– Not rated 2,604 214 222 3,040 2,160 395 195 2,750
Gross residential mortgages
(4)(5)
255,609 13,501 596 269,706 237,701 13,187 638 251,526
ECL allowance 57 69 167 293 59 63 158 280
Net residential mortgages 255,552 13,432 429 269,413 237,642 13,124 480 251,246
Personal
– Exceptionally low 18,943 1 – 18,944 18,608 1 – 18,609
– Very low 6,119 5 – 6,124 5,179 4 – 5,183
– Low 9,117 4,953
– 14,070 8,091 4,389 – 12,480
– Medium 934 3,084 – 4,018 990 2,773 – 3,763
– High 266 1,089 – 1,355 252 803 – 1,055
– Default – – 175 175 – – 109 109
– Not rated 657 34 52 743 585 60 53 698
Gross personal
(5)
36,036 9,166 227 45,429 33,705 8,030 162 41,897
ECL allowance 115 641 146 902 125 537 106 768
Net personal 35,921 8,525 81 44,527 33,580 7,493 56 41,129
Credit card
– Exceptionally low 3,151 – – 3,151 2,065 – – 2,065
– Very low 1,042 – – 1,042 715 – – 715
– Low 6,936 597 – 7,533 4,653 347 – 5,000
– Medium 992 2,927 – 3,919 593 2,195 – 2,788
– High – 682 – 682 – 435 – 435
– Default – – – – – – – –
– Not rated 145 7 – 152 123 8 – 131
Gross credit card 12,266 4,213 – 16,479 8,149 2,985 – 11,134
ECL allowance 143 641 – 784 127 498 – 625
Net credit card 12,123 3,572 – 15,695 8,022 2,487 – 10,509
Business and government
– Investment grade 87,184 404 – 87,588 65,963 562 – 66,525
– Non-investment grade 101,889 6,457 – 108,346 85,764 4,599 – 90,363
– Watch list 66 2,971 – 3,037 67 2,985 – 3,052
– Default – – 920 920 – – 1,033 1,033
– Not rated 208 17 – 225 174 24 – 198
Gross business and government
(4)(6)
189,347 9,849 920 200,116 151,968 8,170 1,033 161,171
ECL allowance 285 458 351 1,094 240 428 508 1,176
Net business and government 189,062 9,391 569 199,022 151,728 7,742 525 159,995
Total net amount of loans $ 492,658 $ 34,920 $ 1,079 $ 528,657 $ 430,972 $ 30,846 $ 1,061 $ 462,879
(1) The table excludes debt securities measured at FVOCI, for which ECL allowances of $24 million (2021: $19 million) were recognized in AOCI. In addition, the table
excludes debt securities classified at amortized cost, for which ECL allowances of $15 million were recognized as at October 31, 2022 (2021: $15 million), $12 million of
which was stage 3 ECL allowance on originated credit-impaired amortized cost debt securities (2021: $13 million). Other financial assets classified at amortized cost were
also excluded from the table above as their ECL allowances were immaterial as at October 31, 2022 and October 31, 2021. Financial assets other than loans that are
classified as amortized cost are presented on our consolidated balance sheet net of ECL allowances.
(2) Excludes foreclosed assets of $24 million (2021: $18 million), which were included in Other assets on our consolidated balance sheet.
(3) As at October 31, 2022, 84% (2021: 89%) of stage 3 impaired loans were either fully or partially collateralized.
(4) Includes $4 million (2021: $16 million) of residential mortgages and $963 million (2021: $25,983 million) of business and government loans that are measured and
designated at FVTPL.
(5) The internal risk rating grades presented for residential mortgages and certain personal loans do not take into account loan guarantees or insurance issued by the
Canadian government (federal or provincial), Canadian government agencies, or private insurers, as the determination of whether a SICR has occurred for these loans is
based on relative changes in the loans’ lifetime PD without considering collateral or other credit enhancements.
(6) Includes customers’ liability under acceptances of $11,574 million (2021: $10,958 million).
CIBC 2022 ANNUAL REPORT 149

Consolidated financial statements
Undrawn credit facilities and other off-balance sheet exposures
$ millions, as at October 31 2022 2021
Stage 1 Stage 2 Stage 3 Total Stage 1 Stage 2 Stage 3 Total
Retail
– Exceptionally low $ 149,286 $ 6 $ – $ 149,292 $ 130,212 $ 12 $ – $ 130,224
– Very low 14,461 51 – 14,512 12,868 59 – 12,927
– Low 10,844 2,412 – 13,256 7,937 1,811 – 9,748
– Medium 522 1,402 – 1,924 740 896 – 1,636
– High 155 682 – 837 73 495 – 568
– Default – – 39 39 – – 34 34
– Not rated 484 8 – 492 375 8 – 383
Gross retail 175,752 4,561 39 180,352 152,205 3,281 34 155,520
ECL allowance 38 83 – 121 34 29 – 63
Net retail 175,714 4,478 39 180,231 152,171 3,252 34 155,457
Business and government
– Investment grade 119,069 121 – 119,190 111,877 524 – 112,401
– Non-investment grade 64,446 2,540 – 66,986 58,652 1,714 – 60,366
– Watch list 15 571 – 586 19 734 – 753
– Default – – 69 69 – – 91 91
– Not rated 575 26 – 601 346 9 – 355
Gross business and government 184,105 3,258 69 187,432 170,894 2,981 91 173,966
ECL allowance 50 32 – 82 37 21 – 58
Net business and government 184,055 3,226 69 187,350 170,857 2,960 91 173,908
Total net undrawn credit facilities and
other off-balance sheet exposures
$ 359,769 $ 7,704 $ 108 $ 367,581 $ 323,028 $ 6,212 $ 125 $ 329,365
Net interest income after provision for credit losses
$ millions, for the year ended October 31 2022 2021
Interest income $ 22,179 $ 14,741
Interest expense 9,538 3,282
Net interest income 12,641 11,459
Provision for (reversal of) credit losses 1,057 158
Net interest income after provision for credit losses $ 11,584 $ 11,301
Modified financial assets
As part of CIBC’s usual lending business, from time to time we may modify the contractual terms of loans classified as stage 2 and stage 3 for which
the borrower has experienced financial difficulties, through the granting of a concession in the form of below-market rates or terms that we would not
otherwise have considered.
During the year ended October 31, 2022, loans classified as stage 2 or stage 3 with an amortized cost of $434 million before modification were
modified through the granting of a financial concession in response to the borrower having experienced financial difficulties. The amortized cost of
loans with lifetime allowance that were modified during the year ended October 31, 2021 was $733 million before modification, including the
modifications under the COVID-19 client deferral programs. In addition, the gross carrying amount of previously modified or deferred stage 2 or
stage 3 loans that have returned to stage 1 during the year ended October 31, 2022 was $461 million (2021: $1,461 million), including loans that
were previously subject to the client deferral programs.
Note
6 Structured entities and derecognition of financial assets
Structured entities
SEs are entities that have been designed so that voting or similar rights are not the dominant factor in deciding who controls the entity, such as
when any voting rights relate to administrative tasks only and the relevant activities are directed by means of contractual arrangements. SEs are
entities that are created to accomplish a narrow and well-defined objective. CIBC is involved with various types of SEs for which the business
activities include securitization of financial assets, asset-backed financings, and asset management.
We consolidate a SE when the substance of the relationship indicates that we control the SE.
Consolidated structured entities
We consolidate the following SEs:
Credit card securitization trust
We sell an ownership interest in a revolving pool of credit card receivables generated under certain credit card accounts to Cards II Trust (Cards II),
which purchases a proportionate share of credit card receivables on certain credit card accounts, with the proceeds received from the issuance of
notes. We consolidate this trust because we have the power to direct the relevant activities and have exposure to substantially all the variability of
returns for the excess spread (the deferred purchase price) that we receive over time.
Our credit card securitizations are revolving securitizations, with credit card receivable balances fluctuating from month to month as credit
card clients repay their balances and new receivables are generated.
The notes are presented as Secured borrowings within Deposits on the consolidated balance sheet.
150 CIBC 2022 ANNUAL REPORT

Consolidated financial statements
As at October 31, 2022, Cards II held $4.5 billion of credit card receivable assets with a fair value of $4.5 billion (2021: $1.7 billion with a fair
value of $1.7 billion), which supported $3.0 billion of associated funding liabilities with a fair value of $2.9 billion (2021: $1.7 billion with a fair value of
$1.7 billion).
Covered bond guarantor
Under the Legislative Covered Bond Programme, we transfer a pool of conventional uninsured mortgages to the CIBC Covered Bond (Legislative)
Guarantor Limited Partnership (the Guarantor LP). The Guarantor LP holds interest and title to these transferred mortgages and serves to guarantee
payment of principal and interest to bondholders. The covered bond liabilities are on-balance sheet obligations that are fully collateralized by the
mortgage assets over which bondholders enjoy a priority claim in the event of CIBC’s insolvency. We consolidate this entity because we have the
ability to direct the relevant activities and retain substantially all of the variability of returns on the underlying mortgages.
As at October 31, 2022, our Legislative Covered Bond Programme had outstanding covered bond liabilities of $26.3 billion with a fair value of
$26.1 billion (2021: $23.8 billion with a fair value of $24.0 billion).
Multi-seller conduit
We sponsor a consolidated multi-seller conduit in Canada that acquires direct or indirect ownership or security interests in pools of financial assets
from clients and finance the acquisitions by issuing ABS and asset-backed commercial paper (ABCP). The sellers to the conduit continue to service
the assets and are exposed to credit losses realized on these assets through the provision of credit enhancements. We hold all of the outstanding ABS
and ABCP. As at October 31, 2022, $525 million of financial assets held by the conduit were included in Securities (2021: nil), of which $178 million are
measured at FVTPL (2021: nil) and $347 million at amortized cost (2021: nil), and $1,089 million were included in Loans (2021: nil) on our consolidated
balance sheet. These financial assets are related to third-party SEs and are included in the non-consolidated SEs table below.
CIBC-managed investment funds
We establish and manage investment funds such as mutual funds and pooled funds. We act as an investment manager and earn market-based
management fees and, for certain pooled funds, performance fees which are generally based on the performance of the funds. Seed capital is
provided from time to time to CIBC-managed investment funds for initial launch. We consolidate those investment funds in which we have power to
direct the relevant activities of the funds and in which our seed capital, or our units held, is significant relative to the total variability of returns of the
funds such that we are deemed to be a principal rather than an agent. As at October 31, 2022, the total assets and non-controlling interests in
consolidated CIBC-managed investment funds were $137 million and $70 million, respectively (2021: $50 million and $14 million, respectively). Non-
controlling interests in consolidated CIBC-managed investment funds are included in Other liabilities as the investment fund units are mandatorily
redeemable at the option of the investor.
Community-based tax-advantaged investments
We sponsor certain SEs that invest in community development projects in the U.S. through the issuance of below-market loans that generate a
return primarily through the realization of tax credits. As at October 31, 2022, the program had outstanding loans of $125 million (2021: $92 million).
We consolidate these entities because we have the ability to direct the relevant activities and retain substantially all of the variability of returns on the
underlying loans.
Non-consolidated structured entities
The following SEs are not consolidated by CIBC because we do not have control over these SEs:
Single-seller and multi-seller conduits
We manage and administer a single-seller conduit and several CIBC-sponsored multi-seller conduits in Canada. The multi-seller conduits acquire
direct or indirect ownership or security interests in pools of financial assets from our clients and finance the acquisitions by issuing ABCP to
investors. The single-seller conduit acquires financial assets and finances these acquisitions through a credit facility provided by a syndicate of
financial institutions. The sellers to the conduits may continue to service the assets and may be exposed to credit losses realized on these assets,
typically through the provision of over-collateralization or another form of credit enhancement. The conduits may also obtain credit enhancement
from third-party providers. As at October 31, 2022, the total assets in the single-seller conduit and multi-seller conduits amounted to $0.6 billion and
$9.3 billion, respectively (2021: $0.6 billion and $7.6 billion, respectively).
We provide the multi-seller conduits with commercial paper backstop liquidity facilities, securities distribution, and provide both the single
and multi-seller conduits with accounting, cash management, and operations services. The liquidity facilities for the managed and administered
multi-seller conduits require us to provide funding, subject to the satisfaction of certain conditions with respect to the conduits, for ABCP not placed
with external investors. We also may purchase ABCP issued by the multi-seller conduits for market-making purposes.
We are required to maintain certain short-term and/or long-term debt ratings with respect to the liquidity facilities that we provide to the
sponsored multi-seller conduits. If we are downgraded below the level specified under the terms of those facilities, we must provide alternative
satisfactory liquidity arrangements, such as procuring an alternative liquidity provider that meets the minimum rating requirements.
We may also act as the counterparty to derivative contracts entered into by a multi-seller conduit in order to convert the yield of the underlying
assets to match the needs of the multi-seller conduit’s investors or to mitigate the interest rate, basis, and currency risk within the conduit.
All fees earned in respect of activities with the conduits are on a market basis.
Third-party structured vehicles
We have investments in and provide loans, liquidity and credit facilities to third-party SEs. We also have investments in limited partnerships in which
we generally are a passive investor of the limited partnerships as a limited partner, and in some cases, we are the co-general partner and have
significant influence over the limited partnerships. Similar to other limited partners, we are obligated to provide funding up to our commitment level
to these limited partnerships.
Loan warehouse financing
We provide interim and term senior financing to third-party SEs for the purpose of future securitization. The SE is established by a third-party
investor, who provides the initial investment into the SE (the equity investors). The senior financing enables the SE to purchase a loan portfolio at the
direction of a collateral manager during the warehousing phase of the securitization. The senior lenders are repaid by proceeds from the issuance
of debt securities to investors when the deal closes or by the cash flows from the repayment of the underlying assets held by the SE or alternative
financing obtained by the investor from third-party lenders.
CIBC 2022 ANNUAL REPORT 151

Consolidated financial statements
Community Reinvestment Act investments
We hold debt and equity investments in limited liability entities to further our U.S. Community Reinvestment Act initiatives with a carrying value of
$489 million (2021: $338 million). These entities invest in qualifying community development projects, including affordable housing projects that
generate a return primarily by the realization of tax credits. Similar to other limited investors in these entities, we are obligated to provide funding up
to our commitment level to these limited liability entities. As at October 31, 2022, the total assets of these limited liability entities were $7.9 billion
(2021: $5.9 billion).
CIBC-managed investment funds
As indicated above, we establish investment funds, including mutual funds and pooled funds, to provide clients with investment opportunities and we
may receive management fees and performance fees. We may hold insignificant amounts of fund units in these CIBC-managed funds. We do not
consolidate these funds if we do not have significant variability of returns from our interests in these funds such that we are deemed to be an agent
through our capacity as the investment manager, rather than a principal. We do not guarantee the performance of CIBC-managed investment funds.
As at October 31, 2022, the total AUM in the non-consolidated CIBC-managed investment funds amounted to $133.5 billion (2021: $152.5 billion).
CIBC structured collateralized debt obligation (CDO) vehicles
We hold exposures to structured CDO vehicles through investments in, or written credit derivatives referencing, these structured vehicles. The
structured vehicles are funded through the issuance of senior and subordinated tranches. We may hold a portion of those senior and/or
subordinated tranches.
We previously curtailed our business activity in structuring CDO vehicles within our structured credit run-off portfolio. Our exposures to CDO
vehicles mainly arose through our previous involvement in acting as structuring and placement agent for the CDO vehicles. As at October 31, 2022,
the assets in the CIBC structured CDO vehicles have a total principal amount of nil (2021: $181 million).
Our on-balance sheet amounts and maximum exposure to loss related to SEs that are not consolidated are set out in the table below. The maximum
exposure comprises the carrying value of unhedged investments, the notional amounts for liquidity and credit facilities, and the notional amounts less
accumulated fair value losses for unhedged written credit derivatives on SE reference assets. The impact of CVA is not considered in the table below.
$ millions, as at October 31, 2022
Single-seller
and multi-seller
conduits
Third-party
structured
vehicles
Loan
warehouse
financing Other
(1)
On-balance sheet assets at carrying value
(2)
Securities $ 642 $ 2,199 $ – $ 509
Loans 98 2,740 8,898 24
Investments in equity-accounted associates and joint ventures – 66 – 68
$ 740 $ 5,005 $ 8,898 $ 601
October 31, 2021 $ 141 $ 3,838 $ 3,245 $ 394
On-balance sheet liabilities at carrying value
(2)
Deposits $– $– $ – $–
Derivatives
(3)
– – – 45
$– $– $ – $45
October 31, 2021 $ – $ – $ – $ 354
Maximum exposure to loss, net of hedges
Investments and loans $ 740 $ 5,005 $ 8,898 $ 601
Notional of written derivatives, less fair value losses – – – 35
Liquidity, credit facilities and commitments 8,682
(4)
2,638 2,700 308
Less: hedges of investments, loans and written derivatives exposure – – – (39)
$ 9,422 $ 7,643 $ 11,598 $ 905
October 31, 2021 $ 7,680 $ 5,854 $ 4,166 $ 520
(1) Includes Community Reinvestment Act-related investment vehicles, CIBC-managed investment funds, CIBC structured CDO vehicles and third-party structured vehicles
related to structured credit run-off. It also includes, as at October 31, 2021, notes issued by CIBC Capital Trust of $300 million which were redeemed on November 1, 2021;
see Note 16 for more details.
(2) Excludes SEs established by CMHC, Fannie Mae, Freddie Mac, Ginnie Mae, FHLB, Federal Farm Credit Bank, and Student Loan Marketing Association.
(3) Comprises written credit default swaps (CDS) and total return swaps (TRS) under which we assume exposures. Excludes foreign exchange derivatives, interest rate
derivatives and other derivatives provided as part of normal client facilitation.
(4) Excludes an additional $2.4 billion (2021: $3.0 billion) relating to our backstop liquidity facilities provided to the multi-seller conduits as part of their commitment to fund
purchases of additional assets. Also excludes $642 million (2021: $35 million) of our direct investments in the multi-seller conduits which we consider investment exposure.
We also hold investments in a variety of third-party investment funds, which include, but are not limited to, exchange-traded funds, mutual funds,
and investment trusts. We buy and sell units of these investment funds as part of trading activities or client facilitation businesses that are managed
as part of larger portfolios. We generally are a passive investor and are not the investment manager in any of these investment funds. We are not the
sponsor of any third-party investment funds, nor do we have the power over key decision-making activities of the funds. Our maximum exposure to
loss from our investments is limited to the carrying amounts of our investments and any unutilized commitment we have provided to these funds. In
addition, we issue certain structured notes and enter into equity derivatives that are referenced to the return of certain investment funds.
Accordingly, we do not include our interests in these third-party investment funds in the table above.
152 CIBC 2022 ANNUAL REPORT

Consolidated financial statements
Derecognition of financial assets
We enter into transactions in the normal course of business in which we transfer recognized financial assets directly to third parties, but retain
substantially all of the risks and rewards of those assets. The risks include credit, interest rate, foreign exchange, prepayment and other price risks
whereas the rewards include income streams associated with the assets. Due to the retention of risks, the transferred financial assets are not
derecognized and such transfers are accounted for as secured borrowing transactions.
The majority of our financial assets transferred to non-consolidated entities that do not qualify for derecognition are: (i) residential mortgage
loans under securitization transactions; (ii) securities held by counterparties as collateral under repurchase agreements; and (iii) securities lent
under securities lending agreements.
Residential mortgage securitizations
We securitize fully insured fixed- and variable-rate residential mortgage pools through the creation of National Housing Act (NHA) MBS under the
NHA MBS Program, sponsored by CMHC. Under the Canada Mortgage Bond Program, sponsored by CMHC, we sell MBS to a government-
sponsored securitization trust that issues securities to investors. We do not consolidate the securitization trust. We may act as a counterparty in
interest rate swap agreements where we pay the trust the interest due to investors and receive the interest on the MBS. We have also sold MBS
directly to CMHC under the Government of Canada’s Insured Mortgage Purchase Program.
The sale of mortgage pools that comprise the NHA MBS does not qualify for derecognition as we retain prepayment, credit, and interest rate
risks associated with the mortgages, which represent substantially all the risks and rewards. As a result, the mortgages remain on our consolidated
balance sheet and are carried at amortized cost. We also recognize the cash proceeds from the securitization as Deposits – Secured borrowings.
Securities held by counterparties as collateral under repurchase agreements
We enter into arrangements whereby we sell securities but enter into simultaneous arrangements to repurchase the securities at a fixed price on a
future date, thereby retaining substantially all the risks and rewards. As a result, the securities remain on our consolidated balance sheet.
Securities lent for cash collateral or for securities collateral
We enter into arrangements whereby we lend securities but with arrangements to receive the securities at a future date, thereby retaining
substantially all the risks and rewards. As a result, the securities remain on our consolidated balance sheet.
The following table provides the carrying amount and fair value of transferred financial assets that did not qualify for derecognition and the
associated financial liabilities:
$ millions, as at October 31 2022 2021
Carrying
amount
Fair
value
Carrying
amount
Fair
value
Residential mortgage securitizations
(1)
$ 16,939 $ 16,540 $ 17,121 $ 17,023
Securities held by counterparties as collateral under repurchase agreements
(2)
39,788 39,788 36,469 36,469
Securities lent for cash collateral
(2)
2,165 2,165 1 1
Securities lent for securities collateral
(2)
30,520 30,520 31,548 31,548
$ 89,412 $ 89,013 $ 85,139 $ 85,041
Associated liabilities
(3)
$ 88,954 $ 88,912 $ 85,061 $ 85,122
153 CIBC 2022 ANNUAL REPORT
(1) Consists mainly of Canadian residential mortgage loans transferred to Canada Housing Trust. Certain cash in transit balances related to the securitization process
amounting to $405 million (2021: $792 million) have been applied to reduce these balances.
(2) Does not include over-collateralization of assets pledged. Repurchase and securities lending arrangements are conducted with both CIBC-owned and third-party assets
on a pooled basis. The carrying amounts represent an estimated allocation related to the transfer of our own financial assets.
(3) Includes the obligation to return off-balance sheet securities collateral on securities lent and fair value hedge basis adjustments.

Consolidated financial statements
Note 7 Property and equipment
$ millions, as at or for the year ended October 31
Right-of-
use assets
Land and
buildings
(1)
Computer
equipment
Office furniture,
equipment
and other
(1)
Leasehold
improvements
(1)
Total
2022 Cost
Balance at beginning of year
(2)
$ 2,303 $ 722 $ 1,135 $ 859 $ 1,406 $ 6,425
Additions
(3)
293 51 100 57 110 611
Disposals
(4)
(55) (6) (58) (50) (66) (235)
Adjustments
(5)
50 17 16 22 18 123
Balance at end of year $ 2,591 $ 784 $ 1,193 $ 888 $ 1,468 $ 6,924
2021 Balance at end of year
(2)
$ 2,303 $ 722 $ 1,135 $ 859 $ 1,406 $ 6,425
2022 Accumulated depreciation
Balance at beginning of year $ 550 $ 313 $ 923 $ 472 $ 881 $ 3,139
Depreciation
(4)
282 14 101 54 71 522
Disposals
(4)
(42) – (53) (38) (48) (181)
Adjustments
(5)
24 6 13 13 11 67
Balance at end of year $ 814 $ 333 $ 984 $ 501 $ 915 $ 3,547
2021 Balance at end of year $ 550 $ 313 $ 923 $ 472 $ 881 $ 3,139
Net book value
As at October 31, 2022 $ 1,777 $ 451 $ 209 $ 387 $ 553 $ 3,377
As at October 31, 2021 $ 1,753 $ 409 $ 212 $ 387 $ 525 $ 3,286
(1) Includes $242 million (2021: $234 million) of work-in-progress not subject to depreciation.
(2) Certain prior year balances have been reclassified to conform to the current year presentation.
(3) Includes impact of lease modifications.
(4) Includes write-offs for properties that were vacated in the fourth quarter of 2022, and write-offs of fully depreciated assets.
(5) Includes foreign currency translation adjustments.
Cost of net additions and disposals during the year was: Canadian Personal and Business Banking net additions of $106 million (2021: net
disposals of $70 million); Canadian Commercial Banking and Wealth Management net disposals of $102 million (2021: net disposals of $5 million);
U.S. Commercial Banking and Wealth Management net additions of $23 million (2021: net additions of $31 million); Capital Markets net disposals of
$18 million (2021: net additions of $20 million); and Corporate and Other net additions of $367 million (2021: net additions of $644 million).
Note 8 Goodwill, software and other intangible assets
Goodwill
The carrying amount of goodwill is reviewed for impairment annually as at August 1 and whenever there are events or changes in circumstances
which indicate that the carrying amount may not be recoverable. Goodwill is allocated to CGUs for the purposes of impairment testing based on the
lowest level for which identifiable cash inflows are largely independent of cash inflows from other assets or groups of assets. The goodwill
impairment test is performed by comparing the recoverable amount of the CGU to which goodwill has been allocated with the carrying amount of
the CGU including goodwill, with any deficiency recognized as impairment to goodwill. The recoverable amount of a CGU is defined as the higher of
its estimated fair value less cost to sell and value in use.
We have two significant CGUs to which goodwill has been allocated. The changes in the carrying amount of goodwill are allocated to each
CGU as follows:
$ millions, as at or for the year ended October 31
CGUs
Total
Canadian
Wealth
Management
U.S. Commercial
Banking and
Wealth
Management Other
(1)
2022
2
154 CIBC 2022 ANNUAL REPORT
Balance at beginning of year $ 884 $ 3,838 $ 232 $ 4,954
Impairment – – – –
Adjustments
(2)
– 386 8 394
Balance at end of year $ 884 $ 4,224 $ 40 $ 5,348
2021 Balance at beginning of year $ 884 $ 4,131 $ 238 $ 5,253
Impairment – – – –
Adjustments
(2)
– (293) (6) (299)
Balance at end of year $ 884 $ 3,838 $ 232 $ 4,954
(1) Certain information has been reclassified to conform to the presentation adopted in the current year. Other now includes CIBC FirstCaribbean.
(2) Includes foreign currency translation adjustments.

Consolidated financial statements
Impairment testing of goodwill and key assumptions
U.S. Commercial Banking and Wealth Management
The recoverable amount of the U.S. Commercial Banking and Wealth Management CGU (including The PrivateBank and Geneva Advisors) is based
on a value in use calculation using a five-year cash flow projection approved by management, and an estimate of the capital required to be
maintained to support ongoing operations.
We have determined that for the impairment testing performed as at August 1, 2022, the estimated recoverable amount of the U.S. Commercial
Banking and Wealth Management CGU was in excess of its carrying amount. As a result, no impairment charge was recognized during 2022.
A terminal growth rate of 4.4% as at August 1, 2022 (August 1, 2021: 4.3%) was applied to the years after the five-year forecast. All of the
forecasted cash flows were discounted at an after-tax rate of 9.8% as at August 1, 2022 (11.7% pre-tax) which we believe to be a risk-adjusted
discount rate appropriate to U.S. Commercial Banking and Wealth Management (we used an after-tax rate of 10.9% as at August 1, 2021). The
determination of a discount rate and a terminal growth rate require the exercise of judgment. The discount rate was determined based on the
following primary factors: (i) the risk-free rate; (ii) an equity risk premium; and (iii) beta adjustment to the equity risk premium based on a review of
betas of comparable publicly traded financial institutions in the region. The terminal growth rate was based on management’s expectations of real
growth and forecast inflation rates.
If alternative reasonably possible changes in key assumptions were applied, the result of the impairment test would not differ.
Estimation of the recoverable amount is an area of significant judgment. The recoverable amount is estimated using an internally developed
model which requires the use of significant assumptions including forecasted earnings, a discount rate, a terminal growth rate and forecasted
regulatory capital requirements. Reductions in the estimated recoverable amount could arise from various factors, such as reductions in forecasted
cash flows, an increase in the assumed level of required capital, and any adverse changes to the discount rate or terminal growth rate either in
isolation or in any combination thereof.
Canadian Wealth Management
The recoverable amount of the Canadian Wealth Management CGU is based on a fair value less cost to sell calculation. The fair value is estimated
using an earnings-based approach whereby the forecasted earnings are based on the Wealth Management internal plan which was approved by
management and covers a three-year period. The calculation incorporates the forecasted earnings multiplied by an earnings multiple derived from
observable price-to-earnings multiples of comparable wealth management institutions. The price-to-earnings multiples of those comparable wealth
management institutions ranged from 6.4 to 10.7 as at August 1, 2022 (August 1, 2021: 7.0 to 10.9).
We have determined that the estimated recoverable amount of the Wealth Management CGU was well in excess of its carrying amount as at
August 1, 2022. As a result, no impairment charge was recognized during 2022.
If alternative reasonably possible changes in key assumptions were applied, the result of the impairment test would not differ.
Other
The goodwill relating to the Other CGUs, which includes the CIBC FirstCaribbean CGU, is comprised of amounts which individually are not considered
to be significant. We have determined that for the impairment testing performed as at August 1, 2022, the estimated recoverable amount of each of
these CGUs was in excess of their carrying amounts.
Allocation to strategic business units
Goodwill of $5,348 million (2021: $4,954 million) is allocated to the SBUs as follows: Canadian Commercial Banking and Wealth Management of
$954 million (2021: $954 million), Corporate and Other of $99 million (2021: $95 million), U.S. Commercial Banking and Wealth Management of
$4,224 million (2021: $3,837 million), Capital Markets of $64 million (2021: $61 million), and Canadian Personal and Business Banking of $7 million
(2021: $7 million).
Software and other intangible assets
The carrying amount of indefinite-lived intangible assets is provided in the following table:
$ millions, as at or for the year ended October 31
Contract
based
(1)
Brand name
(2)
Total
2022 Balance at beginning of year $ 116 $ 24 $ 140
Adjustments
(3)
– 3 3
Balance at end of year $ 116 $ 27 $ 143
2021 Balance at beginning of year $ 116 $ 26 $ 142
Adjustments
(3)
– (2) (2)
Balance at end of year $ 116 $ 24 $ 140
(1) Represents management contracts purchased as part of past acquisitions.
(2) Acquired as part of the CIBC FirstCaribbean acquisition.
(3) Includes foreign currency translation adjustments.
CIBC 2022 ANNUAL REPORT 155

Consolidated financial statements
The components of finite-lived software and other intangible assets are as follows:
$ millions, as at or for the year ended October 31 Software
(1)
Core deposit
intangibles
(2)
Contract
based
(3)
Customer
relationships
(4)
Total
2022 Gross carrying amount
Balance at beginning of year $ 4,061 $ 575 $ 20 $ 239 $ 4,895
Additions 833 – 10 242 1,085
Disposals
(5)
(42) – – – (42)
Adjustments
(6)
29 58 2 17 106
Balance at end of year $ 4,881 $ 633 $ 32 $ 498 $ 6,044
2021 Balance at end of year $ 4,061 $ 575 $ 20 $ 239 $ 4,895
2022 Accumulated amortization
Balance at beginning of year $ 2,367 $ 475 $ 13 $ 151 $ 3,006
Amortization and impairment
(5)
427 51 – 47 525
Disposals
(5)
(31) – – – (31)
Adjustments
(6)
27 51 2 15 95
Balance at end of year $ 2,790 $ 577 $ 15 $ 213 $ 3,595
2021 Balance at end of year $ 2,367 $ 475 $ 13 $ 151 $ 3,006
Net book value
As at October 31, 2022 $ 2,091 $ 56 $ 17 $ 285 $ 2,449
As at October 31, 2021 $ 1,694 $ 100 $ 7 $ 88 $ 1,889
(1) Includes $942 million (2021: $659 million) of work-in-progress not subject to amortization.
(2) Acquired as part of the acquisitions of CIBC FirstCaribbean and The PrivateBank.
(3) Represents a combination of management contracts purchased as part of past acquisitions including The PrivateBank and Geneva Advisors in 2017, as well as
Lowenhaupt Global Advisors, LLC (LGA) and Cleary Gull in 2019.
(4) Represents customer relationships associated with past acquisitions including The PrivateBank and Geneva Advisors in 2017, LGA in 2019 and the Canadian Costco
credit card portfolio in 2022.
(5) Includes write-offs of fully amortized assets.
(6) Includes foreign currency translation and purchase price adjustments.
Net additions and disposals of gross carrying amount during the year were: Canadian Personal and Business Banking net additions of $242 million
(2021: net disposals of $2 million); Canadian Commercial Banking and Wealth Management net disposals of nil (2021: net disposals of nil);
U.S. Commercial Banking and Wealth Management net additions of $26 million (2021: net additions of $5 million); Capital Markets net additions of
nil (2021: net disposals of nil); and Corporate and Other net additions of $775 million (2021: net additions of $570 million).
Note
9 Other assets
$ millions, as at October 31 2022 2021
Accrued interest receivable $ 2,230 $ 1,271
Defined benefit asset
(Note 18) 1,420 1,372
Precious metals
(1)
2,304 3,005
Brokers’ client accounts 9,467 12,273
Current tax receivable 2,837 1,676
Other prepayments 652 582
Derivative collateral receivable 13,637 6,599
Accounts receivable 1,053 859
Other
(2)
1,597 1,588
$ 35,197 $ 29,225
(1) Includes gold and silver bullion that are measured at fair value using unadjusted market prices quoted in active markets.
(2) Includes investments in subleases of $703 million as at October 31, 2022 (2021: $664 million). For the year ended October 31, 2022, finance income related to our
investment in sublease was $46 million (2021: $47 million). Future lease payments receivable are $522 million over the next five years, and $657 million thereafter until
expiry of the subleases.
156 CIBC 2022 ANNUAL REPORT

Consolidated financial statements
Note 10 Deposits
(1)(2)
$ millions, as at October 31
Payable on
demand
(3)
Payable after
notice
(4)
Payable on a
fixed date
(5)(6)
2022
Total
2021
Total
Personal $ 16,104 $ 139,042 $ 76,949 $ 232,095 $ 213,932
Business and government
(7)(8)
113,259 89,253 194,676 397,188 344,388
Bank 11,706 93 10,724 22,523 20,246
Secured borrowings
(9)
– – 45,766 45,766 42,592
$ 141,069 $ 228,388 $ 328,115 $ 697,572 $ 621,158
Comprises:
Held at amortized cost $ 670,770 $ 602,628
Designated at fair value 26,802 18,530
$ 697,572 $ 621,158
Total deposits include:
(10)
Non-interest-bearing deposits
Canada $ 93,801 $ 93,850
U.S. 17,053 16,522
Other international 6,452 5,601
Interest-bearing deposits
Canada 447,409 406,642
U.S. 92,333 70,312
Other international 40,524 28,231
$ 697,572 $ 621,158
(1)
Includes deposits of $243.3 billion (2021: $215.4 billion) denominated in U.S. dollars and deposits of $53.1 billion (2021: $37.1 billion) denominated in other foreign currencies.
(2) Net of purchased notes of $3.0 billion (2021: $2.2 billion).
(3) Includes all deposits for which we do not have the right to require notice of withdrawal. These deposits are generally chequing accounts.
(4) Includes all deposits for which we can legally require notice of withdrawal. These deposits are generally savings accounts.
(5) Includes all deposits that mature on a specified date. These deposits are generally term deposits, guaranteed investment certificates, and similar instruments.
(6) Includes $55.1 billion (2021: $32.6 billion) of deposits which are subject to the bank recapitalization (bail-in) conversion regulations issued by the Department of Finance
Canada. These regulations provide certain statutory powers to the Canada Deposit Insurance Corporation, including the ability to convert specified eligible shares and
liabilities of CIBC into common shares in the event that CIBC is determined to be non-viable.
(7) Includes nil (2021: $300 million) of Notes issued to CIBC Capital Trust. These Notes were redeemed on November 1, 2021. For additional information, see Note 16.
(8) Includes $10.6 billion (2021: $8.8 billion) of structured note liabilities that were sold upon issuance to third-party financial intermediaries, who may resell the notes to retail
investors in foreign jurisdictions.
(9) Comprises liabilities issued by or as a result of activities associated with the securitization of residential mortgages, Covered Bond Programme, and consolidated
securitization vehicles.
(10) Classification is based on geographical location of the CIBC office.
Note 11 Other liabilities
$ millions, as at October 31 2022 2021
Accrued interest payable $ 2,009 $ 781
Defined benefit liability
(Note 18) 477 602
Gold and silver certificates 102 113
Brokers’ client accounts 6,617 5,809
Derivative collateral payable 5,919 6,662
Negotiable instruments 1,267 1,149
Accrued employee compensation and benefits 2,737 2,961
Accounts payable and accrued expenses 2,608 2,259
Other
(1)
6,336 4,587
$ 28,072 $ 24,923
(1) Includes the carrying value of our lease liabilities, which was $2,175 million as at October 31, 2022 (2021: $2,134 million). The undiscounted cash flows related to the
contractual maturity of our lease liabilities is $344 million for the period less than 1 year, $1,109 million between years 1-5, and $1,199 million thereafter until expiry of the
leases. During the year ended October 31, 2022, interest expense on lease liabilities was $61 million (2021: $51 million).
Note 12 Derivative instruments
As described in Note 1, in the normal course of business, we use various derivative instruments for both trading and ALM purposes. These
derivatives limit, modify or give rise to varying degrees and types of risk.
$ millions, as at October 31 2022 2021
Assets Liabilities Assets Liabilities
$ 30,040Trading
(Note 2)
$ 40,101 $ 46,278 $ 34,647
CIBC 2022 ANNUAL REPORT 157
ALM
(Note 2)
(1)
2,934 6,062 1,265
2,061
$ 43,035 $ 52,340 $ 35,912 $ 32,101
(1) Comprised of derivatives that qualify for hedge accounting under IAS 39 and derivatives used for economic hedges.

Consolidated financial statements
Derivatives used by CIBC
The majority of our derivative contracts are OTC transactions, which consist of: (i) contracts that are bilaterally negotiated and settled between CIBC
and the counterparty to the contract; and (ii) contracts that are bilaterally negotiated and then cleared through a central counterparty (CCP).
Bilaterally negotiated and settled contracts are usually traded under a standardized International Swaps and Derivatives Association (ISDA)
agreement with collateral posting arrangements between CIBC and its counterparties. Terms are negotiated directly with counterparties and the
contracts have industry-standard settlement mechanisms prescribed by ISDA. Centrally cleared contracts are generally bilaterally negotiated and
then novated to, and cleared through, a CCP. The industry promotes the use of CCPs to clear OTC trades. The central clearing of derivative
contracts generally facilitates the reduction of credit exposures due to the ability to net settle offsetting positions. Consequently, derivative contracts
cleared through CCPs generally attract less capital relative to those settled with non-CCPs.
The remainder of our derivative contracts are exchange-traded derivatives, which are standardized in terms of their amounts and settlement
dates, and are bought and sold on organized and regulated exchanges. These exchange-traded derivative contracts consist primarily of options
and futures.
Interest rate derivatives
Forward rate agreements are OTC contracts that effectively fix a future interest rate for a period of time. A typical forward rate agreement provides
that at a pre-determined future date, a cash settlement will be made between the counterparties based upon the difference between a contracted
rate and a market rate to be determined in the future, calculated on a specified notional principal amount. No exchange of principal amount takes
place. Certain forward rate agreements are bilaterally transacted and then novated and settled through a clearing house which acts as a CCP.
Interest rate swaps are OTC contracts in which two counterparties agree to exchange cash flows over a period of time based on rates applied
to a specified notional principal amount. A typical interest rate swap would require one counterparty to pay a fixed market interest rate in exchange
for a variable market interest rate determined from time to time, with both calculated on a specified notional principal amount. No exchange of
principal amount takes place. Certain interest rate swaps are bilaterally transacted and then novated and settled through a clearing house which
acts as a CCP.
Interest rate options are contracts in which one party (the purchaser of an option) acquires from another party (the writer of an option), in
exchange
for a premium, the right, but not the obligation, to either buy or sell, on a specified future date or within a specified time, a specified
financial instrument at a contracted price. The underlying financial instrument has a market price which varies in response to changes in interest
rates. Options are transacted in both OTC and exchange-traded markets.
Interest rate futures are standardized contracts transacted on an exchange. They are based upon an agreement to buy or sell a specified
quantity of a financial instrument on a specified future date, at a contracted price. These contracts differ from forward rate agreements in that they
are in standard amounts with standard settlement dates and are transacted through an exchange.
Foreign exchange derivatives
Foreign exchange forwards are OTC contracts in which one counterparty contracts with another to exchange a specified amount of one currency for
a specified amount of a second currency, at a future date or range of dates.
Foreign exchange futures contracts are similar in mechanics to foreign exchange forward contracts except that they are in standard currency
amounts with standard settlement dates and are transacted through an exchange.
Foreign exchange swap contracts comprise foreign exchange swaps and cross-currency interest rate swaps. Foreign exchange swaps are
transactions in which a currency is simultaneously purchased in the spot market and sold for a different currency in the forward market, or vice
versa. Cross-currency interest rate swaps are transactions in which counterparties exchange principal and interest flows in different currencies over
a period of time. These contracts are used to manage both currency and interest rate exposures.
Credit derivatives
Credit derivatives are OTC contracts designed to transfer the credit risk in an underlying financial instrument (usually termed as a reference asset)
from one counterparty to another. The most common credit derivatives are CDS and certain TRS.
CDS contracts provide protection against the decline in value of a reference asset as a result of specified credit events such as default or
bankruptcy. These derivatives are similar in structure to an option whereby the purchaser pays a premium to the seller of the CDS contract in return
for payment contingent on the occurrence of a credit event. The protection purchaser has recourse to the protection seller for the difference
between the face value of the CDS contract and the fair value of the reference asset at the time of settlement. Neither the purchaser nor the seller
under the CDS contract has recourse to the entity that issued the reference asset. Certain CDS contracts are cleared through a CCP.
In credit derivative TRS contracts, one counterparty agrees to pay or receive cash amounts based on the returns of a reference asset,
including interest earned on these assets
in exchange for amounts that are based on prevailing market funding rates. These cash settlements are
made regardless of whether there is a credit event. Upon the occurrence of a credit event, the parties may either exchange cash payments
according to the value of the defaulted assets or exchange cash based on the notional amount for physical delivery of the defaulted assets.
Equity derivatives
Equity swaps are OTC contracts in which one counterparty agrees to pay, or receive from the other, cash amounts based on changes in the value of
a stock index, a basket of stocks or a single stock in exchange for amounts that are based either on prevailing market funding rates or changes in
the value of a different stock index, basket of stocks or a single stock. These contracts generally include payments in respect of dividends.
Equity options give the purchaser of the option, for a premium, the right, but not the obligation, to buy from or sell to the writer of an option, an
underlying stock index, basket of
stocks, or a single stock at a contracted price. Options are transacted in both OTC and exchange markets.
Equity index futures are standardized contracts transacted on an exchange. They are based on an agreement to pay or receive a cash
amount based
on the difference between the contracted price level of an underlying stock index and its corresponding market price level at a
specified future date. There is generally no actual delivery of stocks that comprise the underlying index. These contracts are in standard amounts
with standard settlement dates.
Precious metal and other commodity derivatives
We also transact in other derivative products, including commodity forwards, futures, swaps and options, such as precious metal and energy-
related products in both OTC and exchange markets.
158 CIBC 2022 ANNUAL REPORT

Consolidated financial statements
Notional amounts
The notional amounts are not recorded as assets or liabilities, as they represent the face amount of the contract to which a rate or price is applied to
determine the amount of cash flows to be exchanged. In most cases, notional amounts do not represent the potential gain or loss associated with
market or credit risk of such instruments.
The following table presents the notional amounts of derivative instruments:
$ millions, as at October 31 2022 2021
Residual term to contractual maturity
Total
notional
amounts Trading ALM Trading ALM
Less
than
1 year
1 to
5 years
Over
5 years
Interest rate derivatives
Over-the-counter
Forward rate agreements $ 9,098 $ 2,228 $ – $ 11,326 $ – $ 11,326 $ 7,149 $ 5,611
Centrally cleared forward rate agreements 95,241 16,375 – 111,616 111,616 – 100,198 –
Swap contracts 55,981 123,774 88,270 268,025 246,336 21,689 243,655 23,205
Centrally cleared swap contracts 1,964,761 1,772,589 789,361 4,526,711 3,930,263 596,448 2,998,139 460,922
Purchased options 12,219 7,142 1,089 20,450 20,160 290 13,319 344
Written options 10,428 5,757 844 17,029 16,926 103 13,912 261
2,147,728 1,927,865 879,564 4,955,157 4,325,301 629,856 3,376,372 490,343
Exchange-traded
Futures contracts 86,893 22,622 – 109,515 109,493 22 164,644 –
Purchased options 6 – – 6 6 – 5,251 –
Written options 1,006 – – 1,006 1,006 – 10,251 –
87,905 22,622 – 110,527 110,505 22 180,146 –
Total interest rate derivatives 2,235,633 1,950,487 879,564 5,065,684 4,435,806 629,878 3,556,518 490,343
Foreign exchange derivatives
Over-the-counter
Forward contracts 699,241 26,247 1,589 727,077 719,885 7,192 709,628 6,937
Swap contracts 160,500 254,614 154,073 569,187 497,830 71,357 491,884 52,247
Purchased options 23,800 1,922 13 25,735 25,734 1 19,843 88
Written options 27,484 2,320 – 29,804 29,158 646 21,887 739
911,025 285,103 155,675 1,351,803 1,272,607 79,196 1,243,242 60,011
Exchange-traded
Futures contracts 42 – – 42 42 – 6 –
Total foreign exchange derivatives 911,067 285,103 155,675 1,351,845 1,272,649 79,196 1,243,248 60,011
Credit derivatives
Over-the-counter
Credit default swap contracts – protection purchased 1,305 533 376 2,214 2,195 19 2,210 27
Centrally cleared credit default swap
contracts – protection purchased
203 633 1,019 1,855 1,801 54 1,524 123
Credit default swap contracts – protection sold 448 458 123 1,029 1,029 – 1,304 –
Centrally cleared credit default swap
contracts – protection sold
– 320 378 698 698 – 377 –
Total credit derivatives 1,956 1,944 1,896 5,796 5,723 73 5,415 150
Equity derivatives
Over-the-counter 65,407 54,616 876 120,899 119,327 1,572 83,612 1,831
Exchange-traded 79,954 28,808 724 109,486 109,486 – 93,564 –
Total equity derivatives 145,361 83,424
1,600 230,385 228,813 1,572 177,176 1,831
Precious metal and other commodity derivatives
(1)
Over-the-counter 27,969 25,404 564 53,937 53,926 11 48,028 –
Centrally cleared commodity derivatives 50 6 – 56 56 – 119 –
Exchange-traded 24,255 11,813 359 36,427 36,427 – 34,783 –
Total precious metal and other commodity derivatives 52,274 37,223 923 90,420 90,409 11 82,930 –
Total notional amount of which: $ 3,346,291 $ 2,358,181 $ 1,039,658 $ 6,744,130 $ 6,033,400 $ 710,730 $ 5,065,287 $ 552,335
Over-the-counter
(2)
3,154,135 2,294,938 1,038,575 6,487,648 5,776,940 710,708 4,756,788 552,335
Exchange-traded 192,156 63,243 1,083 256,482 256,460 22 308,499 –
(1) Certain prior year information has been revised to conform to current year presentation.
(2) For OTC derivatives that are not centrally cleared, $1,695.3 billion (2021: $1,622.2 billion) are with counterparties that have two-way collateral posting arrangements,
$53.0 billion (2021: $37.1 billion) are with counterparties that have one-way collateral posting arrangements, and $98.4 billion (2021: $88.4 billion) are with counterparties
that have no collateral posting arrangements. Counterparties with whom we have more than insignificant OTC derivative portfolios and one-way collateral posting
arrangements are either sovereign entities or supra national financial institutions.
Risk
In the following sections, we discuss the risks related to the use of derivatives and how we manage these risks.
Market risk
Derivatives are financial instruments where valuation is linked to changes in interest rates, foreign exchange rates, equity, commodity, credit prices
or indices. Changes in value as a result of the aforementioned risk factors are referred to as market risk.
Market risk arising from derivative trading activities is managed in order to mitigate risk in line with CIBC’s risk appetite. To manage market
risk, we set market risk limits and may enter into hedging transactions.
Credit risk
Credit risk arises from the potential for a counterparty to default on its contractual obligations and the possibility that prevailing market conditions are
such that a loss would occur in replacing the defaulted transaction.
We limit the credit risk of OTC derivatives through the use of ISDA master netting agreements, collateral, CCPs and other credit mitigation
techniques. We clear eligible derivatives through CCPs in accordance with various global initiatives. Where feasible, we novate existing bilaterally
CIBC 2022 ANNUAL REPORT 159

Consolidated financial statements
negotiated and settled derivatives to a CCP in an effort to reduce CIBC’s credit risk exposure. We establish counterparty credit limits and limits for
CCP exposures based on a counterparty’s creditworthiness and the type of trading relationship with each counterparty (underlying agreements,
business volumes, product types, tenors, etc.).
We negotiate netting agreements to contain the build-up of credit exposure resulting from multiple transactions with more active
counterparties. Such agreements provide for the simultaneous close-out and netting of all transactions with a counterparty, in the case of a
counterparty default. A number of these agreements incorporate a Credit Support Annex, which is a bilateral security agreement that, among other
things, provides for the exchange of collateral between parties in the event that one party’s exposure to the other exceeds agreed upon thresholds.
Credit risk on exchange-traded futures and options is limited, as these transactions are standardized contracts executed on established
exchanges, whose CCPs assume the obligations of both counterparties. Similarly, swaps that are centrally cleared represent limited credit risk
because these transactions are novated to the CCP, which assumes the obligations of the original bilateral counterparty. All exchange-traded and
centrally cleared contracts are subject to initial margin and daily settlement of variation margins, designed to protect participants from losses
incurred from a counterparty default.
A CVA is determined using the fair value based exposure we have on derivative contracts. We believe that we have made appropriate fair
value adjustments to date. The establishment of fair value adjustments involves estimates that are based on accounting processes and judgments
by management. We evaluate the adequacy of the fair value adjustments on an ongoing basis. Market and economic conditions relating to
derivative counterparties may change in the future, which could result in significant future losses.
The following table summarizes our credit exposure arising from derivatives, which includes the current replacement cost, credit equivalent amount
and risk-weighted amount.
For the majority of OTC derivative transactions, we use the Internal Model Method (IMM) for the determination of the EAD, using models that
simulate the underlying risk factors and reflect netting and collateral agreements. For the minority of derivative transactions where we do not have
regulatory approval to use IMM, we used the Standardized Approach for Counterparty Credit Risk (SA-CCR).
$ millions, as at October 31 2022 2021
Current replacement cost
(1)
Credit
equivalent
amount
(2)
Risk-
weighted
amount
Current replacement cost
(1)
Credit
equivalent
amount
(2)
Risk-
weighted
amount
Trading ALM Total Trading ALM Total
Interest rate derivatives
Over-the-counter
Forward rate agreements $– $– $ –$ 7 $ 2 $ – $ 4 $ 4 $ 35 $ 31
Swap contracts 939 40 979 2,223 422 2,116 141 2,257 4,182 1,360
Purchased options 21 – 21 35 16 14 2 16 26 14
Written options – – – 7 3 4 – 4 8 4
960 40 1,000 2,272 443 2,134 147 2,281 4,251 1,409
Exchange-traded – – – 198 7 3 – 3 332 10
960 40 1,000 2,470 450 2,137 147 2,284 4,583 1,419
Foreign exchange derivatives
Over-the-counter
Forward contracts 1,966 574 2,540 6,293 1,922 943 196 1,139 4,027 1,335
Swap contracts 366 394 760 2,928 721 452 389 841 2,684 751
Purchased options 325 – 325 767 267 144 14 158 156 54
Written options 29 – 29 139 46 40 – 40 50 19
2,686 968 3,654 10,127 2,956 1,579 599 2,178 6,917 2,159
Credit derivatives
Over-the-counter
Credit default swap contracts
– protection purchased 2 – 2 164 19 3 1 4 105 16
– protection sold – – – 44 11 1 – 1 18 7
2 – 2 208 30 4 1 5 123 23
Equity derivatives
Over-the-counter 124 51 175 3,788 926 254 79 333 3,910 935
Exchange-traded 10 – 10 2,546 87 1,310 – 1,310 6,298 195
134 51 185 6,334 1,013 1,564 79 1,643 10,208 1,130
Precious metal and other commodity
derivatives
(3)
Over-the-counter 3,801 – 3,801 6,051 1,655 4,147 4 4,151 6,374 1,876
Exchange-traded 12 – 12 3,060 122 17 – 17 2,559 102
3,813 – 3,813 9,111 1,777 4,164 4 4,168 8,933 1,978
RWA related to non-trade exposures
to central counterparties 366 306
RWA related to CVA charge
6,696 7,174
Total derivatives $ 7,595 $ 1,059 $ 8,654 $ 28,250 $ 13,288 $ 9,448 $ 830 $ 10,278 $ 30,764 $ 14,189
(1) Current replacement cost reflects the current mark-to-market (MTM) value of derivatives offset by eligible financial collateral, where present.
(2) Under IMM, expected effective positive exposure (EEPE) is used, which computes, through simulation, the expected exposures with consideration to the expected
movements in underlying risk factor and netting/collateral agreements. The EAD is calculated as EEPE multiplied by the prescribed alpha factor of 1.4. The EAD under
SA-CCR is calculated as the sum of replacement cost and potential future exposure, multiplied by the prescribed alpha factor of 1.4.
(3) Certain prior year information has been revised to conform to current year presentation.
The following table presents the current replacement cost of derivatives by geographic region based on the location of the derivative counterparty:
$ millions, as at October 31 2022 2021
Canada U.S.
Other
countries Total Canada U.S.
Other
countries Total
Derivative instruments
By counterparty type
Financial institutions $ 1,245 $ 223 $ 1,151 $ 2,619 $ 558 $ 1,693 $ 1,130 $ 3,381
Governments 1,016 – 35 1,051 641 1 17 659
Corporate 1,167 3,247 570 4,984 1,824 3,445 969 6,238
Total derivative instruments $ 3,428 $ 3,470 $ 1,756 $ 8,654 $ 3,023 $ 5,139 $ 2,116 $ 10,278
160 CIBC 2022 ANNUAL REPORT

Consolidated financial statements
Note 13 Designated accounting hedges
Hedge accounting
We apply hedge accounting as part of managing the market risk of certain non-trading portfolios arising from changes due to interest rates, foreign
exchange rates, and equity market prices. See the shaded sections in “Non-trading activities” in the MD&A for further information on our risk
management strategy for these risks. See Note 12 for further information on the derivatives used by CIBC.
Interest rate risk
The majority of our derivative contracts used to hedge certain exposures to benchmark interest rate risk are interest rate swaps. For fair value
hedges, we convert our fixed interest rate exposures from the hedged financial instruments to floating interest rate exposures. For cash flow
hedges, we convert certain exposures to cash flow variability from our variable rate instruments to fixed interest rate exposures.
Foreign currency risk
For our fair value hedges, we mainly use various combinations of cross-currency interest rate swaps and interest rate swaps to hedge our
exposures to foreign currency risk together with interest rate risk, converting our fixed foreign currency rate exposures to floating functional currency
rate exposures.
For our cash flow hedges, the majority of our derivative contracts are used to hedge our exposures to cash flow variability arising from
fluctuations in foreign exchange
rates, and mainly consist of cross-currency interest rate swaps.
For NIFO hedges, we use a combination of foreign denominated deposit liabilities and foreign exchange forwards to manage our foreign
currency exposure of
our NIFOs with a functional currency other than the Canadian dollar.
Equity price risk
We use cash-settled TRS in designated cash flow hedge relationships to hedge changes in CIBC’s share price in respect of certain cash-settled
share-based compensation awards. Note 17 provides details on our cash-settled share-based compensation plans.
For the hedge relationships described above, hedge effectiveness is assessed at the inception of the hedge relationship and on an ongoing basis,
primarily using the dollar offset method. The sources of hedge ineffectiveness are mainly attributed to the following:
• Utilization of hedging instruments that have a non-zero fair value at the inception of the hedge relationship;
• Differences in fixed rates, when
contractual coupons of the fixed rate hedged items are designated;
• Differences in the discounting factors between the hedged item and the hedging instruments arising from different rate reset frequencies and
timing of cash
flows; and
• Differences in the discount curves to determine the basis adjustments of the hedged items and the fair value of the hedging derivatives,
including from the application of OIS and CVA to the valuation of derivatives when they are applicable.
CIBC 2022 ANNUAL REPORT 161

Consolidated financial statements
Designated hedging instruments
The following table provides a summary of financial instruments designated as hedging instruments:
$ millions, as at October 31
Notional
amount of
the hedging
instrument
(1)
Maturity range
Fair value of the
hedging derivatives
Gains (losses) on
changes in
fair value
used for calculating
hedge ineffectiveness
Less than
1 year
1-5
years
Over 5
years
Assets Liabilities
2022 Cash flow hedges
Foreign exchange risk
Cross-currency interest rate swaps $ 16,527 $ 5,331 $ 11,196 $ – $ 467 $ 1,008 $ (618)
Interest rate risk
Interest rate swaps 29,660 6,235 23,289 136 – 20 (964)
Equity share price risk
Equity swaps 1,413 143 1,270 – 7 38 (255)
$ 47,600 $ 11,709 $ 35,755 $ 136 $ 474 $ 1,066 $ (1,837)
NIFO hedges
Foreign exchange risk
Foreign exchange forwards $ 232 $ 232 $ – $ – $ 5 $ 3 $ (22)
Deposits
(2)
24,793 24,793 – – n/a n/a (2,399)
$ 25,025 $ 25,025 $ – $ – $ 5 $ 3 $ (2,421)
Fair value hedges
Interest rate risk
Interest rate swaps $ 226,764 $ 68,457 $ 131,337 $ 26,970 $ 89 $ 817 $ 400
Foreign exchange / interest rate risk
Cross-currency interest rate swaps 50,555 21,330 23,515 5,710 1,335 3,084 (130)
Interest rate swaps 21,352 9,023 10,125 2,204 – 32 (1,316)
$ 298,671 $ 98,810 $ 164,977 $ 34,884 $ 1,424 $ 3,933 $ (1,046)
$ 371,296 $ 135,544 $ 200,732 $ 35,020 $ 1,903 $ 5,002 $ (5,304)
2021 Cash flow hedges
Foreign exchange risk
Cross-currency interest rate swaps $ 13,002 $ 6,605 $ 6,397 $ – $ 165 $ 191 $ (55)
Interest rate risk
Interest rate swaps 12,073 4,846 7,227 – – – (223)
Equity share price risk
Equity swaps 1,679 964 715 – 44 1 529
$ 26,754 $ 12,415 $ 14,339 $ – $ 209 $ 192 $ 251
NIFO hedges
Foreign exchange risk
Foreign exchange forwards $ 226 $ 226 $ – $ – $ 1 $ 1 $ 14
Deposits
(2)
24,116 24,116 – – n/a n/a 1,534
$ 24,342 $ 24,342 $ – $ – $ 1 $ 1 $ 1,548
Fair value hedges
Interest rate risk
Interest rate swaps $ 190,769 $ 72,010 $ 99,532 $ 19,227 $ 152 $ 162 $ 1,018
Foreign exchange / interest rate risk
Cross-currency interest rate swaps 38,213 7,804 23,483 6,926 478 1,391 48
Interest rate swaps 20,907 4,113 13,692 3,102 – – (260)
$ 249,889 $ 83,927 $ 136,707 $ 29,255 $ 630 $ 1,553 $ 806
$ 300,985 $ 120,684 $ 151,046 $ 29,255 $ 840 $ 1,746 $ 2,605
(1) For some hedge relationships, we apply a combination of derivatives to hedge the underlying exposures; therefore, the notional amounts of the derivatives generally
exceed the carrying amount of the hedged items.
(2) Notional amount represents the principal amount of deposits as at October 31, 2022 and October 31, 2021.
n/a Not applicable.
162 CIBC 2022 ANNUAL REPORT

Consolidated financial statements
The following table provides the average rate or price of the hedging derivatives:
As at October 31
Average
exchange rate
(1)
Average fixed
interest rate
(1)
Average
share price
(2)
2022 Cash flow hedges
Foreign exchange risk
Cross-currency interest rate swaps AUD – CAD 0.92 n/a n/a
EUR – CAD 1.42 n/a n/a
GBP – CAD 1.68 n/a n/a
Interest rate risk
Interest rate swaps n/a CAD 2.72 % n/a
n/a USD 3.89 % n/a
Equity share price risk
Equity swaps n/a n/a $ 68.23
NIFO hedges
Foreign exchange risk
Foreign exchange forwards AUD – CAD 0.88 n/a n/a
HKD – CAD 0.17 n/a n/a
Fair value hedges
Interest rate risk
Interest rate swaps n/a CAD 2.32 % n/a
Foreign exchange / interest rate risk
Cross-currency
interest rate swaps EUR – CAD 1.48 1.76 % n/a
CHF – CAD 1.39 n/a n/a
USD – CAD 1.28 3.46 % n/a
Interest rate swaps n/a CHF (0.14)% n/a
n/a EUR 0.01 % n/a
n/a GBP 1.02 % n/a
2021 Cash flow hedges
Foreign exchange risk
Cross-currency interest rate swaps AUD – CAD 0.94 n/a n/a
GBP – CAD 1.72 n/a n/a
Interest rate risk
Interest rate swaps n/a CAD 1.57 % n/a
n/a USD 0.77 % n/a
Equity share price risk
Equity swaps
n/a n/a $ 59.09
NIFO hedges
Foreign exchange risk
Foreign exchange forwards AUD – CAD 0.92 n/a n/a
HKD – CAD 0.16 n/a n/a
Fair value hedges
Interest rate risk
Interest rate swaps n/a CAD 1.37 % n/a
Foreign exchange / interest rate risk
Cross-currency interest rate swaps EUR – CAD 1.50 0.08 % n/a
GBP – CAD 1.66 1.31 % n/a
USD – CAD 1.27 1.29 % n/a
Interest rate swaps n/a CHF (0.02)% n/a
n/a EUR (0.39)% n/a
n/a GBP 0.71 % n/a
(1) Includes average foreign exchange rates and interest rates relating to significant hedging relationships.
(2) On April 7, 2022, CIBC shareholders approved a two-for-one share split (Share Split) of CIBC’s issued and outstanding common shares. Each shareholder of record at the
close of business on May 6, 2022 (Record Date) received one additional share on May 13, 2022 (Payment Date) for every one share held on the Record Date. All common
share numbers and per common share amounts have been adjusted to reflect the Share Split as if it was retroactively applied to all periods presented.
n/a Not applicable.
CIBC 2022 ANNUAL REPORT 163

Consolidated financial statements
Designated hedged items
The following table provides information on designated hedged items:
$ millions, as at or for the year ended October 31
Carrying amount of
the hedged item
Accumulated amount
of fair value hedge adjustments
on the hedged item
Gains (losses) on
change in fair
value used for
calculating hedge
ineffectiveness
Assets Liabilities Assets Liabilities
2022 Cash flow hedges
(1)
Foreign exchange risk
Deposits $ – $ 9,466 n/a n/a $ 615
Interest rate risk
Loans 29,660 – n/a n/a 970
Equity share price risk
Share-based payment – 1,314 n/a n/a 255
$ 29,660 $ 10,780 n/a n/a $ 1,840
NIFO hedges $ 25,025 $ – n/a n/a $ 2,421
Fair value hedges
(2)
Interest rate risk
Securities $ 47,659 $ – $ (3,251) $ – $ (3,583)
Loans 36,282 – (1,794) – (1,537)
Deposits – 112,295 – (4,655) 4,437
Subordinated indebtedness – 5,893 – (265) 293
Foreign exchange / interest rate risk
Deposits – 27,017 – (1,581) 1,448
$ 83,941 $ 145,205 $ (5,045) $ (6,501) $ 1,058
2021 Cash flow hedges
(1)
Foreign exchange risk
Deposits $ – $ 5,514 n/a n/a $ 54
Interest rate risk
Loans 12,070 – n/a n/a 223
Equity share price risk
Share-based payment – 1,549 n/a n/a (529)
$ 12,070 $ 7,063 n/a n/a $ (252)
NIFO hedges $ 24,342 $ – n/a n/a $ (1,548)
Fair value hedges
(2)
Interest rate risk
Securities $ 31,661 $ – $ (243) $ – $ (1,403)
Loans 45,180 – (583) – (1,340)
Deposits – 91,414 – (261) 1,568
Subordinated indebtedness – 5,419 – 10 192
Foreign exchange / interest rate risk
Deposits – 19,662 – (154) 217
$ 76,841 $ 116,495 $ (826) $ (405) $ (766)
(1) As at October 31, 2022, the amount remaining in AOCI related to discontinued cash flow hedges was a net loss of $62 million (2021: net gain of $73 million).
(2) As at October 31, 2022, the accumulated fair value hedge net liability adjustment remaining on the consolidated balance sheet related to discontinued fair value hedges
was $537 million (2021: net asset of $44 million).
n/a Not applicable.
Hedge accounting gains (losses) in the consolidated statement of comprehensive income
$ millions, for the year ended October 31
Beginning
balance of
AOCI – hedge
reserve (after-tax)
Change in
the value of the
hedging instrument
recognized in
OCI (before-tax)
Amount
reclassified from
accumulated
OCI to income
(before-tax)
(1)
Tax
benefit
(expense)
Ending balance
of AOCI
hedge reserve
(after-tax)
Hedge
ineffectiveness
gains (losses)
recognized
in income
2022 Cash flow hedges
Foreign exchange risk $ (7) $ (615) $ 607 $ 2 $ (13) $ (3)
Interest rate risk 68 (963) (18) 258 (655) (1)
Equity share price risk 76 (255) 160 25 6 –
$ 137 $ (1,833) $ 749 $ 285 $ (662) $ (4)
NIFO hedges – foreign exchange risk
Hedges of net investment in foreign operations $ 154 $ (2,421) $ – $ 131 $ (2,136) $ –
2021 Cash flow hedges
Foreign exchange risk $ (2) $ (64) $ 57 $ 2 $ (7) $ –
Interest rate risk 279 (223) (63) 75 68 –
Equity share price risk (3) 529 (421) (29) 76 –
$ 274 $ 242 $ (427) $ 48 $ 137 $ –
NIFO hedges – foreign exchange risk
Hedges of net investment in foreign operations $ (1,341) $ 1,548 $ – $ (53) $ 154 $ –
(1) During the year ended October 31, 2022, the amount reclassified from AOCI to net income for cash flow hedges of forecasted transactions that were no longer expected to
occur was nil (2021: nil).
164 CIBC 2022 ANNUAL REPORT

Consolidated financial statements
Hedge accounting gains (losses) in the consolidated statement of income
$ millions, for the year ended October 31
Gains (losses)
on the hedging
instruments
Gains (losses) on
the hedged items
attributable
to hedged risk
Hedge
ineffectiveness
gains (losses)
recognized in income
2022 Fair value hedges
Interest rate risk $ 400 $ (390) $ 10
Foreign exchange / interest rate risk (1,446) 1,448 2
$ (1,046) $ 1,058 $ 12
2021 Fair value hedges
Interest rate risk $ 1,018 $ (983) $ 35
Foreign exchange / interest rate risk (212) 217 5
$ 806 $ (766) $ 40
Note 14 Subordinated indebtedness
The debt issues included in the table below are outstanding unsecured obligations of CIBC and its subsidiaries and are subordinated to the claims
of depositors and other creditors as set out in their terms. Foreign currency denominated indebtedness funds foreign currency denominated assets.
All redemptions are subject to regulatory approval.
Terms of subordinated indebtedness
$ millions, as at October 31 2022 2021
Interest
rate %
Contractual
maturity date
Earliest date redeemable
Denominated
in foreign
currency
Par
value
Carrying
value
(2)
Par
value
Carrying
value
(2)
At greater of
Canada Yield Price
(1)
and par At par
5.75
(3)
July 11, 2024
(4)
TT$175 million $36 $36 $ 32 $ 32
3.45
(5)(6)
April 4, 2028 April 4, 2023 1,500 1,487 1,500 1,525
8.70 May 25, 2029
(4)
25 32 25 37
2.95
(5)(7)
June 19, 2029 June 19, 2024 1,500 1,426 1,500 1,484
2.01
(5)(8)
July 21, 2030 July 21, 2025 1,000 929 1,000 976
11.60 January 7, 2031 January 7, 1996 200 174 200 196
1.96
(5)(9)
April 21, 2031 April 21, 2026 1,000 916 1,000 976
10.80 May 15, 2031 May 15, 2021 150 129 150 146
4.20
(5)(10)
April 7, 2032 April 7, 2027 1,000 963 – –
8.70 May 25, 2032
(4)
25 34 25 39
8.70 May 25, 2033
(4)
25 34 25 40
8.70 May 25, 2035
(4)
25 36 25 42
Floating
(11)
July 31, 2084 July 27, 1990 US$38 million
(12)
52 52 47 47
Floating
(13)
August 31, 2085 August 20, 1991 US$10 million
(14)
13 13 14 14
6,551 6,261 5,543 5,554
Subordinated indebtedness sold short (held) for trading purposes 31 31 (15) (15)
$ 6,582 $ 6,292 $ 5,528 $ 5,539
(1) Canada Yield Price: a price calculated at the time of redemption to provide a yield to maturity equal to the yield of a Government of Canada bond of appropriate maturity
plus a pre-determined spread.
(2) Carrying values of fixed-rate subordinated indebtedness notes reflect the impact of interest rate hedges in an effective hedge relationship.
(3) Guaranteed Subordinated Term Notes in Trinidad and Tobago dollars issued on July 11, 2018 by FirstCaribbean International Bank (Trinidad & Tobago) Limited, a
subsidiary of CIBC FirstCaribbean, and guaranteed on a subordinated basis by CIBC FirstCaribbean.
(4) Not redeemable prior to maturity date.
(5) Debentures are also subject to a non-viability contingent capital (NVCC) provision, necessary for the Debentures to qualify as Tier 2 regulatory capital under Basel III. As
such, the Debentures are automatically converted into common shares upon the occurrence of a Trigger Event as described in the capital adequacy guidelines. In such
an event, the Debentures are convertible into a number of common shares, determined by dividing 150% of the par value plus accrued and unpaid interest by the
average common share price (as defined in the relevant prospectus supplements) subject to a minimum price of $2.50 per share (subject to adjustment in certain events
as defined in the relevant prospectus supplements).
(6) Interest rate is fixed at the indicated rate until the earliest date redeemable at par by CIBC and, thereafter, at a rate of 1.00% above the three-month Canadian dollar
bankers’ acceptance rate.
(7) Interest rate is fixed at the indicated rate until the earliest date redeemable at par by CIBC and, thereafter, at a rate of 1.18% above the three-month Canadian dollar
bankers’ acceptance rate.
(8) Interest rate is fixed at the indicated rate until the earliest date redeemable at par by CIBC and, thereafter, at a rate of 1.28% above the three-month Canadian dollar
bankers’ acceptance rate.
(9) Interest rate is fixed at the indicated rate until the earliest date redeemable at par by CIBC and, thereafter, at a rate of 0.56% above the three-month Canadian dollar
bankers’ acceptance rate.
(10) Interest rate is fixed at the indicated rate until the earliest date redeemable at par by CIBC and, thereafter, at Daily Compounded Canadian Overnight Repo Rate
Average (CORRA) plus 1.69%.
(11) Interest rate is based on the six-month US$ LIBOR plus 0.25%.
(12) Nil (2021: US$6 million) of this issue was repurchased and cancelled during 2022.
(13) Interest rate is based on the six-month US$ LIBOR plus 0.125%.
(14) US$1 million (2021: US$2 million) of this issue was repurchased and cancelled during 2022.
CIBC 2022 ANNUAL REPORT 165

Consolidated financial statements
Note 15 Common and preferred shares and other equity instruments
The following table presents the number of common and preferred shares outstanding and dividends paid, and other equity instruments and
distributions paid thereon:
Common and preferred shares outstanding and other equity instruments
$ millions, except number of shares and per share
amounts, as at or for the year ended October 31
2022 2021
Shares outstanding
Dividends and
distributions paid Shares outstanding
Dividends and
distributions paid
Number
of shares Amount Amount
$ per
share
Number
of shares Amount Amount
$ per
share
Common shares
(1)
905,993,892 $ 14,723 $ 2,954 $ 3.270
901,658,556 $ 14,351 $ 2,622 $ 2.920
Class A Preferred Shares
Series 39 16,000,000 400 15 0.93 16,000,000 400 15 0.93
Series 41 12,000,000 300 12 0.98 12,000,000 300 12 0.98
Series 43 12,000,000 300 9 0.79 12,000,000 300 9 0.79
Series 45
(2)
– – 26 0.83 32,000,000 800 35 1.10
Series 47 18,000,000 450 20 1.13 18,000,000 450 20 1.13
Series 49 13,000,000 325 17 1.30 13,000,000 325 17 1.30
Series 51 10,000,000 250 13 1.29 10,000,000 250 13 1.29
Series 56 600,000 600 – – – – – –
$ 2,625 $ 112 $ 2,825 $ 121
Treasury shares – common shares 46,205 $ 3 (2,604) $ –
Treasury shares – preferred shares (1,995) (2) (20) –
Other Equity Instruments
Limited recourse capital notes Series 1
(3)
$ 750 $ 33 4.375%
(4)
$ 750 $ 37 4.375%
(4)
Limited recourse capital notes Series 2
(5)
$ 750 $ 26 4.000%
(4)
$ 750 $ – 4.000%
(4)
Limited recourse capital notes Series 3
(6)
$ 800 $ – 7.150%
(4)
$– $–
(1) On April 7, 2022, CIBC shareholders approved a two-for-one share split (Share Split) of CIBC’s issued and outstanding common shares. Each shareholder of record at the
close of business on May 6, 2022 (Record Date) received one additional share on May 13, 2022 (Payment Date) for every one share held on the Record Date. All common
share numbers and per common share amounts have been adjusted to reflect the Share Split as if it was retroactively applied to all periods presented.
(2) Series 45 preferred shares were redeemed on July 29, 2022.
(3) See 4.375% Limited Recourse Capital Notes Series 1 (NVCC) (subordinated indebtedness) section below for details.
(4) Represents the annual interest rate percentage applicable to the LRCNs issued as at October 31 for each respective year.
(5) See 4.000% Limited Recourse Capital Notes Series 2 (NVCC) (subordinated indebtedness) section below for details.
(6) See 7.150% Limited Recourse Capital Notes Series 3 (NVCC) (subordinated indebtedness) section below for details.
Common shares
CIBC’s authorized capital consists of an unlimited number of common shares, without nominal or par value.
Common shares issued
$ millions, except number of shares, as at or for the year ended October 31 2022 2021
Number
of shares Amount
Number
of shares Amount
Balance at beginning of year
(1)
901,655,952 $ 14,351 894,170,658 $ 13,908
Issuance pursuant to:
Equity-settled share-based compensation plans
(2)
1,559,629 85 3,410,140 176
Shareholder investment plan 2,272,831 153 2,022,558 132
Employee share purchase plan 2,302,876 163 2,360,358 150
907,791,288 $ 14,752 901,963,714 $ 14,366
Purchase of common shares for cancellation (1,800,000) (29) – –
Treasury shares 48,809 3 (307,762) (15)
Balance at end of year
(1)
906,040,097 $ 14,726 901,655,952 $ 14,351
(1) On April 7, 2022, CIBC shareholders approved a two-for-one share split (Share Split) of CIBC’s issued and outstanding common shares. Each shareholder of record at the
close of business on May 6, 2022 (Record Date) received one additional share on May 13, 2022 (Payment Date) for every one share held on the Record Date. All common
share numbers and per common share amounts have been adjusted to reflect the Share Split as if it was retroactively applied to all periods presented.
(2) Includes the settlement of contingent consideration related to prior acquisitions.
Share split
In February 2022, CIBC’s Board of Directors approved a two-for-one share split (Share Split) of CIBC’s issued and outstanding common shares to
be effected through an amendment to CIBC’s by-laws. On April 7, 2022, CIBC shareholders approved the Share Split. Each shareholder of record at
the close of business on May 6, 2022 (Record Date) received one additional share on May 13, 2022 (Payment Date) for every one share held on the
Record Date. All common share numbers and per common share amounts have been adjusted to reflect the Share Split as if it was retroactively
applied to all periods presented.
Common shares reserved for issue
As at October 31, 2022, 25,579,546 common shares (2021: 26,941,886) were reserved for future issue pursuant to stock option plans, 21,402,179
common shares (2021: 23,675,010) were reserved for future issue pursuant to the Shareholder Investment Plan, 11,147,755 common shares
(2021: 13,647,920) were reserved for future issue pursuant to the ESPP and other activities, and 5,663,395,500 common shares (2021: 4,794,037,500)
were reserved for future issue pursuant to instruments which include an NVCC provision requiring conversion into common shares upon the
occurrence of a Trigger Event as described in the capital adequacy guidelines.
166 CIBC 2022 ANNUAL REPORT

Consolidated financial statements
Normal course issuer bid
On December 9, 2021, we announced that the Toronto Stock Exchange had accepted the notice of our intention to commence a normal course
issuer bid. Purchases under this bid will be completed upon the earlier of: (i) CIBC purchasing 20 million common shares (on a post share split
basis); (ii) CIBC providing a notice of termination; or (iii) December 12, 2022. For the year ended October 31, 2022, we purchased and cancelled
1,800,000 common shares (on a post share split basis) at an average price of $74.43 for a total amount of $134 million, all of which occurred during
the first quarter.
Preferred shares and other equity instruments
CIBC is authorized to issue an unlimited number of Class A Preferred Shares and Class B Preferred Shares without nominal or par value, issuable in
series, provided that, for each class of preferred shares, the maximum aggregate consideration for all outstanding shares at any time does not
exceed $10 billion. There are no Class B Preferred Shares currently outstanding.
Preferred share and other equity instruments rights and privileges
Class A Preferred Shares
Non-cumulative Rate Reset Class A Preferred Shares Series 39, 41, 43, 47, 49, 51, and 56 (NVCC) are redeemable, subject to regulatory approval,
for cash by CIBC on or after the specified redemption dates at the cash redemption prices indicated in the terms of the preferred shares. Class A
Preferred Shares Series 39, 41, 43, 47, 49, and 51 bear quarterly non-cumulative dividends and Series 56 bears semi-annual non-cumulative
dividends.
Non-cumulative Rate Reset Class A Preferred Shares Series 39 (NVCC) (Series 39 shares)
On June 11, 2014, we issued 16 million Non-cumulative Rate Reset Class A Preferred Shares Series 39 (NVCC) (Series 39 shares) with a par value
of $25.00 per share, for gross proceeds of $400 million. For the initial five-year period to the earliest redemption date of July 31, 2019, the Series 39
shares paid quarterly cash dividends, as declared, at a rate of 3.90%. The dividend was reset to 3.713%, payable quarterly as and when declared
by the Board, effective for the five-year period commencing July 31, 2019. On July 31, 2024, and on July 31 every five years thereafter, the dividend
rate will reset to be equal to the then current five-year Government of Canada bond yield plus 2.32%.
Holders of the Series 39 shares had the right to convert their shares on a one-for-one basis into Non-cumulative Floating Rate Class A
Preferred Shares Series 40 (NVCC) (Series 40 shares), subject to certain conditions, on July 31, 2019. As the conditions for conversion were not
met, no Series 40 shares were issued, and all of the Series 39 shares remain outstanding. Holders of the Series 39 shares will have the right to
convert their shares on a one-for-one basis into Series 40 shares, subject to certain conditions, on July 31, 2024 and on July 31 every five years
thereafter. Holders of the Series 40 shares will be entitled to receive a quarterly floating rate dividend, if declared, equal to the three-month
Government of Canada Treasury Bill yield plus 2.32%. Holders of the then outstanding Series 40 shares may convert their shares on a one-for-one
basis into Series 39 shares, subject to certain conditions, on July 31, 2029 and on July 31 every five years thereafter.
Subject to regulatory approval and certain provisions of the shares, we may redeem all or any part of the then outstanding Series 39 shares at
par on July 31, 2024, and on July 31 every five years thereafter; we may redeem all or any part of the then outstanding Series 40 shares at par on
July 31, 2029, and on July 31 every five years thereafter.
Non-cumulative Rate Reset Class A Preferred Shares Series 41 (NVCC) (Series 41 shares)
On December 16, 2014, we issued 12 million Non-cumulative Rate Reset Class A Preferred Shares Series 41 (NVCC) (Series 41 shares) with a par
value of $25.00 per share, for gross proceeds of $300 million. For the initial five-year period to the earliest redemption date of January 31, 2020, the
Series 41 shares paid quarterly cash dividends, as declared, at a rate of 3.75%. The dividend was reset to 3.909%, payable quarterly as and when
declared by the Board, effective for the five-year period commencing January 31, 2020. On January 31, 2025, and on January 31 every five years
thereafter, the dividend rate will reset to be equal to the then current five-year Government of Canada bond yield plus 2.24%.
Holders of the Series 41 shares had the right to convert their shares on a one-for-one basis into Non-cumulative Floating Rate Class A
Preferred Shares Series 42 (NVCC) (Series 42 shares), subject to certain conditions, on January 31, 2020. As the conditions for conversion were not
met, no Series 42 shares were issued, and all of the Series 41 shares remain outstanding. Holders of the Series 41 shares will have the right to
convert their shares on a one-for-one basis into Series 42 shares, subject to certain conditions, on January 31, 2025 and on January 31 every
five years thereafter. Holders of the Series 42 shares will be entitled to receive a quarterly floating rate dividend, if declared, equal to the
three-month Government of Canada Treasury Bill yield plus 2.24%. Holders of the then outstanding Series 42 shares may convert their shares on a
one-for-one basis into Series 41 shares, subject to certain conditions, on January 31, 2030 and on January 31 every five years thereafter.
Subject to regulatory approval and certain provisions of the shares, we may redeem all or any part of the then outstanding Series 41 shares at
par on January 31, 2025 and on January 31 every five years thereafter; we may redeem all or any part of the then outstanding Series 42 shares at
par on January 31, 2030 and on January 31 every five years thereafter.
Non-cumulative Rate Reset Class A Preferred Shares Series 43 (NVCC) (Series 43 shares)
On March 11, 2015, we issued 12 million Non-cumulative Rate Reset Class A Preferred Shares Series 43 (NVCC) (Series 43 shares) with a par value
of $25.00 per share, for gross proceeds of $300 million. For the initial five-year period to the earliest redemption date of July 31, 2020, the Series 43
shares paid quarterly cash dividends, as declared, at a rate of 3.60%. The dividend was reset to 3.143%, payable quarterly as and when declared
by the Board, effective for the five-year period commencing July 31, 2020. On July 31, 2025, and on July 31 every five years thereafter, the dividend
rate will reset to be equal to the then current five-year Government of Canada bond yield plus 2.79%.
Holders of the Series 43 shares had the right to convert their shares on a one-for-one basis into Non-cumulative Floating Rate Class A
Preferred Shares Series 44 (NVCC) (Series 44 shares), subject to certain conditions, on July 31, 2020. As the conditions for conversion were not
met, no Series 44 shares were issued, and all of the Series 43 shares remain outstanding. Holders of the Series 43 shares will have the right to
convert their shares on a one-for-one basis into Series 44 shares, subject to certain conditions, on July 31, 2025 and on July 31 every five years
thereafter. Holders of the Series 44 shares will be entitled to receive a quarterly floating rate dividend, if declared, equal to the three-month
Government of Canada Treasury Bill yield plus 2.79%. Holders of the then outstanding Series 44 shares may convert their shares on a one-for-one
basis into Series 43 shares, subject to certain conditions, on July 31, 2030 and on July 31 every five years thereafter.
Subject to regulatory approval and certain provisions of the shares, we may redeem all or any part of the then outstanding Series 43 shares at
par on July 31, 2025 and on July 31 every five years thereafter; we may redeem all or any part of the then outstanding Series 44 shares at par on
July 31, 2030 and on July 31 every five years thereafter.
CIBC 2022 ANNUAL REPORT 167

Consolidated financial statements
Non-cumulative Rate Reset Class A Preferred Shares Series 45 (NVCC) (Series 45 shares)
On July 29, 2022, we redeemed all 32 million Non-cumulative Rate Reset Class A Preferred Shares Series 45 (NVCC) (Series 45 shares), at a
redemption price of $25.00 per Series 45 Preferred Share, for a total redemption cost of $800 million.
Non-cumulative Rate Reset Class A Preferred Shares Series 47 (NVCC) (Series 47 shares)
On January 18, 2018, we issued 18 million Non-cumulative Rate Reset Class A Preferred Shares Series 47 (NVCC) (Series 47 shares) with a par
value of $25.00 per share, for gross proceeds of $450 million. For the initial five-year period to the earliest redemption date of January 31, 2023, the
Series 47 shares pay quarterly cash dividends, as declared, at a rate of 4.50%. On January 31, 2023, and on January 31 every five years thereafter,
the dividend rate will reset to be equal to the then current five-year Government of Canada bond yield plus 2.45%.
Holders of the Series 47 shares will have the right to convert their shares on a one-for-one basis into Non-cumulative Floating Rate Class A
Preferred Shares Series 48 (NVCC) (Series 48 shares), subject to certain conditions, on January 31, 2023 and on January 31 every five years
thereafter. Holders of the Series 48 shares will be entitled to receive a quarterly floating rate dividend, if declared, equal to the three-month
Government of Canada Treasury Bill yield plus 2.45%. Holders of the then outstanding Series 48 shares may convert their shares on a one-for-one
basis into Series 47 shares, subject to certain conditions, on January 31, 2028 and on January 31 every five years thereafter.
Subject to regulatory approval and certain provisions of the shares, we may redeem all or any part of the then outstanding Series 47 shares at
par on January 31, 2023 and on January 31 every five years thereafter; we may redeem all or any part of the then outstanding Series 48 shares at
par on January 31, 2028 and on January 31 every five years thereafter.
Non-cumulative Rate Reset Class A Preferred Shares Series 49 (NVCC) (Series 49 shares)
On January 22, 2019, we issued 13 million Non-cumulative Rate Reset Class A Preferred Shares Series 49 (NVCC) (Series 49 shares) with a par
value of $25.00 per share, for gross proceeds of $325 million. For the initial five-year period to the earliest redemption date of April 30, 2024, the
Series 49 shares pay quarterly cash dividends, as declared, at a rate of 5.20%. On April 30, 2024, and on April 30 every five years thereafter, the
dividend rate will reset to be equal to the then current five-year Government of Canada bond yield plus 3.31%.
Holders of the Series 49 shares will have the right to convert their shares on a one-for-one basis into Non-cumulative Floating Rate Class A
Preferred Shares Series 50 (NVCC) (Series 50 shares), subject to certain conditions, on April 30, 2024 and on April 30 every five years thereafter.
Holders of the Series 50 shares will be entitled to receive a quarterly floating rate dividend, if declared, equal to the three-month Government of
Canada Treasury Bill yield plus 3.31%. Holders of the then outstanding Series 50 shares may convert their shares on a one-for-one basis into
Series 49 shares, subject to certain conditions, on April 30, 2029 and on April 30 every five years thereafter.
Subject to regulatory approval and certain provisions of the shares, we may redeem all or any part of the then outstanding Series 49 shares at
par on April 30, 2024 and on April 30 every five years thereafter; we may redeem all or any part of the then outstanding Series 50 shares at par on
April 30, 2029 and on April 30 every five years thereafter.
Non-cumulative Rate Reset Class A Preferred Shares Series 51 (NVCC) (Series 51 shares)
On June 4, 2019, we issued 10 million Non-cumulative Rate Reset Class A Preferred Shares Series 51 (NVCC) (Series 51 shares) with a par value of
$25.00 per share, for gross proceeds of $250 million. For the initial five-year period to the earliest redemption date of July 31, 2024, the Series 51
shares pay quarterly cash dividends, as declared, at a rate of 5.15%. On July 31, 2024, and on July 31 every five years thereafter, the dividend rate
will reset to be equal to the then current five-year Government of Canada bond yield plus 3.62%.
Holders of the Series 51 shares will have the right to convert their shares on a one-for-one basis into Non-cumulative Floating Rate Class A
Preferred Shares Series 52 (NVCC) (Series 52 shares), subject to certain conditions, on July 31, 2024 and on July 31 every five years thereafter.
Holders of the Series 52 shares will be entitled to receive a quarterly floating rate dividend, if declared, equal to the three-month Government of
Canada Treasury Bill yield plus 3.62%. Holders of the then outstanding Series 52 shares may convert their shares on a one-for-one basis into
Series 51 shares, subject to certain conditions, on July 31, 2029 and on July 31 every five years thereafter.
Subject to regulatory approval and certain provisions of the shares, we may redeem all or any part of the then outstanding Series 51 shares at
par on July 31, 2024 and on July 31 every five years thereafter; we may redeem all or any part of the then outstanding Series 52 shares at par on
July 31, 2029 and on July 31 every five years thereafter.
Non-cumulative Rate Reset Class A Preferred Shares Series 56 (NVCC) (Series 56 shares)
On September 16, 2022, we issued 600,000 Non-cumulative Rate Reset Class A Preferred Shares Series 56 (NVCC) (Series 56 shares) with a par
value of $1,000.00 per share, for gross proceeds of $600 million. For the initial five-year period to October 28, 2027, the Series 56 shares pay semi-
annual cash dividends on the 28th day of April and October in each year, as declared, at a rate of 7.361%. The first dividend, if declared, will be
payable on April 28, 2023. On October 28, 2027, and on October 28 every five years thereafter, the dividend rate will reset to be equal to the then
current five-year Government of Canada bond yield plus 4.20%.
Subject to regulatory approval and certain provisions of the shares, we may redeem all or any part of the then outstanding Series 56 shares at
par during the period from September 28, 2027 to and including October 28, 2027 and during the period from September 28 to and including
October 28 every five years thereafter.
4.375% Limited Recourse Capital Notes Series 1 (NVCC) (subordinated indebtedness) (LRCN Series 1 Notes)
On September 16, 2020, we issued $750 million principal amount of 4.375% Limited Recourse Capital Notes Series 1 (NVCC) (subordinated
indebtedness). The LRCN Series 1 Notes mature on October 28, 2080, and bear interest at a fixed rate of 4.375% per annum (paid semi-annually)
until October 28, 2025. Starting on October 28, 2025, and every five years thereafter until October 28, 2075, the interest rate will be reset to the then
current five-year Government of Canada bond yield plus 4.000% per annum.
Concurrently with the issuance of the LRCN Series 1 Notes, we issued Non-Cumulative 5-Year Fixed Rate Reset Class A Preferred Shares
Series 53 (NVCC) (Series 53 shares) which are held in the CIBC LRCN Limited Recourse Trust (Limited Recourse Trust) that is consolidated by
CIBC and as a result the Series 53 Preferred Shares are eliminated in CIBC’s consolidated financial statements. In the event of
non-payment by
CIBC of the principal amount of, interest on, or redemption price for, the LRCN Series
1 Notes when due, the sole remedy of each LRCN Series 1
Note holder is limited to that holder’s proportionate share of the Series 53 Preferred Shares held in the Limited Recourse Trust.
Subject to regulatory approval, we may redeem the LRCN Series 1 Notes, in whole or in part, every five years during the period from
September 28 to and including October 28, commencing in 2025, at par.
The LRCN Series 1 Notes and the Series 53 Preferred Shares carry standard NVCC provisions necessary for them to qualify as Tier 1
regulatory capital under Basel III (see “NVCC conversion mechanics” below). Upon the occurrence of a Trigger Event, each Series 53 Preferred
168 CIBC 2022 ANNUAL REPORT

Consolidated financial statements
Share held in the Limited Recourse Trust will automatically and immediately be converted, without the consent of LRCN Series 1 Note holders, into a
variable number of common shares which will be delivered to LRCN Series 1 Note holders in satisfaction of the principal amount of, and accrued
and unpaid interest on, all of the LRCN Series 1 Notes. All claims of LRCN Series 1 Note holders against CIBC under the LRCN Series 1 Notes will
be extinguished upon receipt of such common shares.
4.000% Limited Recourse Capital Notes Series 2 (NVCC) (subordinated indebtedness) (LRCN Series 2 Notes)
On September 14, 2021, we issued $750 million principal amount of 4.000% Limited Recourse Capital Notes Series 2 (NVCC) (subordinated
indebtedness). The LRCN Series
2 Notes mature on January 28, 2082, and bear interest at a fixed rate of 4.000% per annum (paid semi-annually)
until January 28, 2027. Starting on January 28, 2027, and every five years thereafter until January 28, 2077, the interest rate will be reset to the then
current five-year Government of Canada bond yield plus 3.102% per annum.
Concurrently with the issuance of the LRCN Series 2 Notes, we issued Non-Cumulative 5-Year Fixed Rate Reset Class A Preferred Shares
Series 54 (NVCC) (Series 54 shares ) which are held in the Limited Recourse Trust that is consolidated by CIBC and as a result the Series 54
Preferred Shares are eliminated in CIBC’s consolidated financial statements. In the event of non-payment by CIBC of the principal amount of,
interest on, or redemption price for, the LRCN Series 2 Notes when due, the sole remedy of each LRCN Series 2 Note holder is limited to that
holder’s proportionate share of the Series 54 Preferred Shares held in the Limited Recourse Trust.
Subject to regulatory approval, we may redeem the LRCN Series 2 Notes, in whole or in part, every five years during the period from
December 28 to and including January 28, commencing on December
28, 2026, at par.
The LRCN Series 2 Notes and the Series 54 Preferred Shares carry standard NVCC provisions necessary for them to qualify as Tier 1
regulatory capital under Basel III (see “NVCC conversion mechanics” below). Upon the occurrence of a Trigger Event, each Series 54 Preferred
Share held in the Limited Recourse Trust will automatically and immediately be converted, without the consent of LRCN Series 2 Note holders, into a
variable number of common shares which will be delivered to LRCN Series 2 Note holders in satisfaction of the principal amount of, and accrued
and unpaid interest on, all of the LRCN Series 2 Notes. All claims of LRCN Series 2 Note holders against CIBC under the LRCN Series 2 Notes will
be extinguished upon receipt of such common shares.
7.150% Limited Recourse Capital Notes Series 3 (NVCC) (subordinated indebtedness) (LRCN Series 3 Notes)
On June 15, 2022, we issued $800 million principal amount of 7.150% Limited Recourse Capital Notes Series 3 (NVCC) (subordinated
indebtedness). The LRCN Series 3 Notes
mature on July 28, 2082, and bear interest at a fixed rate of 7.150% per annum (paid semi-annually) until
July 28, 2027. Starting on July 28, 2027, and every five years thereafter until July 28, 2077, the interest rate will be reset to the then current five-year
Government of Canada bond yield plus 4.000% per annum.
Concurrently with the issuance of the LRCN Series 3 Notes, we issued Non-Cumulative 5-Year Fixed Rate Reset Class A Preferred Shares
Series 55 (NVCC) (Series 55
shares ), which are held in the Limited Recourse Trust that is consolidated by CIBC and, as a result, the Series 55
Preferred Shares are eliminated in CIBC’s consolidated financial statements. In the event of non-payment by CIBC of the principal amount of,
interest on, or redemption price for, the LRCN Series 3 Notes when due, the sole remedy of each LRCN Series 3 Note holder is limited to that
holder’s proportionate share of the Series 55 Preferred Shares held in the Limited Recourse Trust. Subject to regulatory approval, we may redeem
the LRCN Series 3 Notes, in whole or in part, every five years during the period from June 28 to and including July 28, commencing on June 28,
2027, at par.
Subject to regulatory approval, we may redeem the LRCN Series 3 Notes, in whole or in part, every five years during the period from June 28
to and including July 28, commencing on June 28, 2027, at par.
The LRCN Series 3 Notes and
the Series 55 Preferred Shares carry standard NVCC provisions necessary for them to qualify as Tier 1
regulatory capital under Basel III (see “NVCC conversion mechanics” below). Upon the occurrence of a Trigger Event, each Series 55 Preferred
Share held in the Limited Recourse Trust will automatically and immediately be converted, without the consent of LRCN Series 3 Note holders, into a
variable number of common shares that will be delivered to LRCN Series 3 Note holders in satisfaction of the principal amount of, and accrued and
unpaid interest on, all of the LRCN Series 3 Notes. All claims of LRCN Series 3 Note holders against CIBC under the LRCN Series 3 Notes will be
extinguished upon receipt of such common shares.
Limited Recourse Capital Notes (the Notes)
The Notes are compound instruments with both equity and liability features as payments of interest and principal in cash are made at our discretion,
as the sole recourse
of each Note holder in the event of non-payment will be limited to that holder’s proportionate share of the non-cumulative Rate
Reset Class A Preferred Shares Series 53, 54 and 55 held in the Limited Recourse Trust. The liability component of the Notes has a nominal value
and, as a result, the full proceeds received upon the issuance of the Notes have been presented as equity on the consolidated balance sheet and
any interest payments paid thereon are accounted for as equity distributions.
NVCC conversion mechanics
Each series of Class A Preferred Shares discussed above are subject to an NVCC provision, necessary for the shares to qualify as regulatory
capital under Basel III. As such, the shares are automatically converted into common shares upon the occurrence of a “Trigger Event”. As
described in the Capital Adequacy Guidelines, a Trigger Event occurs when OSFI determines the bank is or is about to become non-viable and, if
after conversion of all contingent instruments and consideration of any other relevant factors or circumstances, it is reasonably likely that its viability
will be restored or maintained; or if the bank has accepted or agreed to accept a capital injection or equivalent support from a federal or provincial
government, without which OSFI would have determined the bank to be non-viable. Each such share is convertible into a number of common
shares, determined by dividing the par value of $25.00 (except, $1,000 in the case of the Series 53, 54, 55, and 56 Preferred Shares) plus declared
and unpaid dividends (except for the Series 53, 54 and 55 Preferred Shares while held in the Limited Recourse Trust) by the average common
share price (as defined in the relevant prospectus supplement) subject to a minimum price of $2.50 per share (subject to adjustment in certain
events as defined in the relevant prospectus supplement). We have recorded the Series 39, Series 41, Series 43, Series 47, Series 49, Series 51
and Series 56 shares as equity.
CIBC 2022 ANNUAL REPORT 169

Consolidated financial statements
Terms of Class A Preferred Shares
Outstanding as at October 31, 2022
Semi-annually
dividends per share
(1)
Quarterly
dividends per share
(1)
Earliest specified
redemption date
Cash redemption
price per share
Series 39 $ 0.232063 July 31, 2024 $ 25.00
Series 41 0.244313 January 31, 2025 25.00
Series 43 0.196438 July 31, 2025 25.00
Series 47 0.281250 January 31, 2023 25.00
Series 49 0.325000 April 30, 2024 25.00
Series 51 0.321875 July 31, 2024 25.00
Series 56 $ 36.825000 September 28, 2027 1,000.00
(1) Dividends may be adjusted depending on the timing of issuance or redemption.
Restrictions on the payment of dividends
Under Section 79 of the Bank Act (Canada), a bank, including CIBC, is prohibited from declaring or paying any dividends on its preferred or
common shares if there are reasonable grounds for believing that the bank is, or the payment would cause it to be, in contravention of any capital
adequacy or liquidity regulation or any direction to the bank made by OSFI.
In addition, our ability to pay common share dividends is also restricted by the terms of the outstanding preferred shares. These terms provide
that we
may not pay dividends on our common shares at any time without the approval of holders of the outstanding preferred shares, unless all
dividends to preferred shareholders that are then payable have been declared and paid or set apart for payment. Our Series 53, 54, and 55
Preferred Shares further limit the payment of dividends on the outstanding Class A Preferred Shares Series 39, 41, 43, 47, 49, 51, and 56 in certain
limited circumstances.
Currently, these limitations do not restrict the payment of dividends on our preferred or common shares.
Capital
Objectives, policy and procedures
Our overall capital management objective is to employ a strong and efficient capital base. We manage capital in accordance with a capital policy
approved by the Board, which includes specific guidelines that relate to capital strength, capital mix, dividends and return of capital, and the
unconsolidated capital adequacy of regulated entities. Capital is monitored continuously for compliance.
Each year, a Capital Plan and three-year outlook are established as a part of the financial plan, and they encompass all material elements of
capital: forecasts
of sources and uses of capital including earnings, dividends, business growth, and corporate initiatives, as well as maturities,
redemptions, and issuances of capital instruments. The Capital Plan is stress-tested to ensure that it is sufficiently robust under severe but plausible
stress scenarios. The level of capital and capital ratios are monitored throughout the year including a comparison to the Capital Plan. There were no
significant changes made to the objectives, policy, guidelines and procedures during the year.
Regulatory capital, leverage and total loss absorbing capacity (TLAC) requirements
Our regulatory capital requirements are determined in accordance with guidelines issued by OSFI, which are based on the capital standards
developed by the Basel Committee on Banking Supervision (BCBS).
CIBC has been designated by OSFI as a domestic systemically important bank (D-SIB) in Canada, and is subject to a Common Equity Tier 1
(CET1) surcharge equal to 1.0% of RWA. OSFI also expects D-SIBs to hold a Domestic Stability Buffer (DSB) of 2.5% effective October 31, 2021,
reflecting the highest DSB requirement under OSFI capital requirements. The resulting targets established by OSFI for D-SIBs, including all buffer
requirements, for CET1, Tier 1 and Total capital ratios of 10.5%, 12.0%, and 14.0%, respectively. These targets may be higher for certain institutions
at OSFI’s discretion.
Regulatory capital consists of CET1, Tier 1 and Tier 2 capital. CET1 capital includes common shares, retained earnings, AOCI (excluding
AOCI relating to cash
flow hedges and changes to FVO liabilities attributable to changes in own credit risk), and qualifying instruments issued by a
consolidated banking subsidiary to third parties, less regulatory adjustments for items such as goodwill and other intangible assets (net of related
deferred tax liabilities), certain deferred tax assets, net assets related to defined benefit pension plans as reported on our consolidated balance
sheet (net of related deferred tax liabilities), and certain investments. Additional Tier 1 (AT1) capital primarily includes NVCC preferred shares,
Limited Recourse Capital Notes, qualifying instruments issued by a consolidated subsidiary to third parties. Tier 2 capital includes NVCC
subordinated indebtedness, eligible collective allowance under the standardized approach, and qualifying instruments issued by a consolidated
subsidiary to third parties.
OSFI also requires D-SIBs to maintain a supervisory target TLAC ratio (which builds on the risk-based capital ratios) and a minimum TLAC
leverage ratio (which builds on the leverage ratio). OSFI expects D-SIBs to have a minimum risk-based TLAC ratio of 21.5% plus the then applicable
DSB requirement (2.5% as noted above), and a minimum TLAC leverage ratio of 6.75%, beginning in the first quarter of fiscal 2022. TLAC consists
of regulatory capital and bail-in eligible liabilities that have residual maturity greater than one year.
To supplement risk-based capital requirements, OSFI expects federally regulated deposit-taking institutions to have a leverage ratio, which is a
non-risk-based capital metric, that meets or exceeds 3.0%. This minimum may be higher for certain institutions at OSFI’s discretion. On April 9,
2020, OSFI announced temporary exclusion of central bank reserves and qualifying sovereign-issued securities from the leverage ratio exposure
measure in response to the onset of the COVID-19 pandemic. Starting January 1, 2022, the temporary exclusion of qualifying sovereign-issued
securities from the leverage ratio exposure measure was no longer applicable. On September 13, 2022, OSFI announced that the temporary
exclusion of central bank reserves from the leverage exposure measure will be no longer applicable effective April 1, 2023. Effective February 1,
2023, D-SIBs will be expected to have leverage ratios that meet or exceed 3.5%, including a leverage ratio buffer introduced under the modified
Leverage Ratio framework as part of Basel III reforms.
170 CIBC 2022 ANNUAL REPORT

Consolidated financial statements
Our capital ratios and leverage ratio are presented in the table below:
$ millions, as at October 31 2022 2021
CET1 capital
(1)
$ 37,005 $ 33,751
Tier 1 capital
(1)
A 41,946 38,344
Total capital
(1)
48,263 44,202
Total RWA B 315,634 272,814
CET1 ratio 11.7 % 12.4 %
Tier 1 capital ratio 13.3 % 14.1 %
Total capital ratio 15.3 % 16.2 %
Leverage ratio exposure
(2)
C $ 961,791 $ 823,343
Leverage ratio
(2)
A/C 4.4 % 4.7 %
TLAC available D $ 95,136 $ 76,701
TLAC ratio D/B 30.1 % 28.1 %
TLAC leverage ratio D/C 9.9 % 9.3 %
(1) Includes the impact of the ECL transitional arrangement announced by OSFI on March 27, 2020. The transitional arrangement results in a portion of ECL allowances that
would otherwise be included in Tier 2 capital qualifying for inclusion in CET1 capital. The amount is subject to certain adjustments and limitations until 2022.
(2) The temporary exclusion of qualifying sovereign-issued securities from the leverage ratio exposure measure in response to the onset of the COVID-19 pandemic was no
longer applicable beginning in the first quarter of 2022. Central bank reserves continue to be excluded from the measure . On September 13, 2022, OSFI announced that
the temporary exclusion of central bank reserves from the leverage exposure measure will be no longer applicable effective April 1, 2023.
During the years ended October 31, 2022 and 2021, we have complied with OSFI’s regulatory capital, leverage ratio, and TLAC requirements.
Note 16 Capital Trust securities
CIBC Capital Trust was a trust wholly owned by CIBC and established under the laws of the Province of Ontario. CIBC Tier 1 Notes were issued on
March 13, 2009. CIBC Capital Trust was not consolidated by CIBC and the senior deposit notes issued by CIBC to CIBC Capital Trust were reported
as Deposits – Business and government on the consolidated balance sheet.
The Notes were structured to achieve Tier 1 regulatory capital treatment and, as such, had features of equity capital. Under the OSFI Capital
Adequacy Requirements (CAR) Guideline, any Tier 1 Notes outstanding as of November 1, 2021 would not be recognized as regulatory capital.
With OSFI’s prior approval, on November 1, 2021, CIBC Capital Trust redeemed its remaining $300 million of Tier 1 Notes at 100% of their principal
amount together with accrued and unpaid interest up to but excluding the redemption date. As a result of the redemption of the Tier 1 Notes by
CIBC Capital Trust, CIBC also redeemed the corresponding senior deposit notes issued by CIBC to CIBC Capital Trust on November 1, 2021.
Note 17 Share-based payments
We provide the following share-based compensation to certain employees and directors in the form of cash-settled or equity-settled awards.
Restricted share award plan
(1)
Under the RSA plan, share unit equivalents (RSA units) are granted to certain key employees on an annual basis or during the year as special
grants. RSA grants are made in the form of cash-settled awards which generally vest and settle in cash either at the end of three years or one-third
annually beginning one year after the date of the grant. Dividend equivalents on RSA units are paid in cash or in the form of additional RSA units to
the employees at the end of the vesting period or settlement date.
Grant date fair value of each cash-settled RSA unit granted is calculated based on the average closing price per common share on the
Toronto Stock Exchange (TSX) for the 10 trading days prior to a date specified in the grant terms. Upon vesting, each RSA unit is settled in cash
based on the average closing price per common share on the TSX for the 10 trading days prior to the vesting date.
During the year, 5,656,353 RSAs were granted at a weighted-average price of $73.43 (2021: 5,798,730 granted at a weighted-average price of
$55.67) and the number of RSAs outstanding as at October 31, 2022 was 17,022,399 (2021: 17,043,678). Compensation expense in respect of
RSAs, before the impact of hedging for changes in share price, totalled $247 million in 2022 (2021: $692 million). As at October 31, 2022, liabilities
in respect of RSAs, which are included in Other liabilities, were $973 million (2021: $1,136 million).
Performance share unit plan
(1)
Under the PSU plan, awards are granted to certain key employees on an annual basis in December. PSU grants are made in the form of cash-
settled awards which vest and settle in cash at the end of three years. Dividend equivalents on PSUs are provided in the form of additional PSUs.
The grant date fair value of each cash-settled PSU is calculated based on the average closing price per common share on the TSX for the
10 trading days prior to a date specified in the grant terms. The final number of PSUs that vest will range from 75% to 125% of the initial number
awarded based on CIBC’s performance relative to the other major Canadian banks. Upon vesting, each PSU is settled in cash based on the
average closing price per common share on the TSX for the 10 trading days prior to the vesting date.
During the year, 1,652,812 PSUs were granted at a weighted-average price of $73.77 (2021: 1,752,590 granted at a weighted-average price of
$55.08). As at October 31, 2022, the number of PSUs outstanding, before the impact of CIBC’s relative performance, was 5,501,190 (2021: 5,823,600).
Compensation expense in respect of PSUs, before the impact of hedging for changes in share price, totalled $90 million in 2022 (2021: $241 million).
As at October 31, 2022, liabilities in respect of PSUs, which are included in Other liabilities, were $341 million (2021: $413 million).
(1) On April 7, 2022, CIBC shareholders approved a two-for-one share split (Share Split) of CIBC’s issued and outstanding common shares. Each shareholder of record at the
close of business on May 6, 2022 (Record Date) received one additional share on May 13, 2022 (Payment Date) for every one share held on the Record Date. All common
share numbers and per common share amounts have been adjusted to reflect the Share Split as if it was retroactively applied to all periods presented.
CIBC 2022 ANNUAL REPORT 171

Consolidated financial statements
Exchangeable shares
As part of our acquisition of Wellington Financial in the first quarter of 2018, equity-settled awards in the form of exchangeable shares, which vest
over a period of up to five years and have specific service and non-market performance vesting conditions, were issued to selected employees.
Employees receive dividend equivalents in the form of additional common shares upon vesting. Compensation expense in respect of the
exchangeable shares is based on the grant date fair value, adjusted for the impact of best estimates on the satisfaction of the service requirements
and non-market performance conditions. At the acquisition, each exchangeable share was granted at $123.99, and the number of exchangeable
shares outstanding that have not vested as at October 31, 2022 was 100,907 (2021: 153,015). The number of exchangeable shares outstanding
was not impacted by the two-for-one share split of CIBC common shares that was effective at the close of business on May 13, 2022; however ,
employees will receive additional common shares upon exchange to reflect the share split. Compensation expense in respect of exchangeable
shares totalled $3 million in 2022 (2021: $12 million).
Deferred share unit plan/deferred compensation plan
(1)
Under the DSU plan and DCP plan, certain employees can elect to receive DSUs in exchange for cash compensation that they would otherwise be
entitled to. In addition, certain key employees are granted DSUs during the year as special grants. DSUs are generally fully vested upon grant or
vest in accordance with the vesting schedule defined in the grant agreement and settle in cash on a date within the period specified in the plan
terms. Employees receive dividend equivalents in the form of additional DSUs.
Grant date fair value of each cash settled DSU that is not granted under the DCP is calculated based on the average closing price per
common share on the TSX for the 10 trading days prior to a date specified in the grant terms. These DSUs are settled in cash based on the average
closing price per common share on the TSX for the 10 trading days prior to the payout date and after the employee’s termination of employment.
The grant date fair value for DCP grants is based on the closing stock price on the New York Stock Exchange (NYSE) on the last day of the calendar
quarter. Upon distribution, each DSU is settled in cash based on the average closing price per common share on the NYSE for the 10 trading days
prior to the date of the distribution.
During the year, 315,545 DSUs were granted at a weighted-average price of $73.54 (2021: 364,348 granted at a weighted-average price of
$55.31) and the number of DSUs outstanding as at October 31, 2022 was 2,079,118 (2021: 1,786,036). Compensation expense in respect of DSUs,
before the impact of hedging for changes in share price, totalled $2 million in 2022 (2021: $70 million). As at October 31, 2022, liabilities in respect
of DSUs, which are included in Other liabilities, were $147 million (2021: $146 million).
(1) On April 7, 2022, CIBC shareholders approved a two-for-one share split (Share Split) of CIBC’s issued and outstanding common shares. Each shareholder of record at the
close of business on May 6, 2022 (Record Date) received one additional share on May 13, 2022 (Payment Date) for every one share held on the Record Date. All common
share numbers and per common share amounts have been adjusted to reflect the Share Split as if it was retroactively applied to all periods presented.
Directors’ plans
Each director who is not an officer or employee of CIBC may elect to receive: 1) the annual equity retainer as either DSUs or common shares, under
the Director DSU/Common Share Election Plan and 2) all or a portion of their remuneration in the form of cash, common shares or DSUs under the
Non-Officer Director Share Plan.
The value of DSUs credited to a director is payable when he or she is no longer a director or employee of CIBC or of an affiliate of CIBC, and
for directors subject to section 409A of the U.S. Internal Revenue Code of 1986, as amended, the director is not providing any services to CIBC or
any member of its controlled group as an independent contractor. In addition, under the Director DSU/Common Share Election Plan, the value of
DSUs is payable only if the director is not related to, or affiliated with, CIBC as defined in the Income Tax Act (Canada).
Other non-interest expense in respect of the DSU components, before the impact of hedging for changes in share price of these plans, totalled
($4) million in 2022 (2021: $14 million). As at October 31, 2022, liabilities in respect of DSUs, which are included in Other liabilities, were $26 million
(2021: $37 million).
Stock option plans
Under the ESOP, stock options are periodically granted to certain key employees. Options provide the employee with the right to purchase common
shares from CIBC at a fixed price not less than the closing price of the shares on the trading day immediately preceding the grant date. In general,
the options vest by the end of the fourth year and expire 10 years from the grant date.
The following tables summarize the activities of the stock options and provide additional details related to stock options outstanding and vested.
As at or for the year ended October 31 2022 2021
Number
of stock
options
(1)
Weighted-
average
exercise
price
(1)(2)
Number
of stock
options
(1)
Weighted-
average
exercise
price
(1)
Outstanding at beginning of year 10,295,854 $ 53.34 11,360,222 $ 50.20
Granted 2,565,310 70.05 2,114,416 55.40
Exercised
(3)
(1,362,340) 48.42 (3,050,788) 43.92
Forfeited (60,800) 56.08 (127,996) 55.93
Cancelled/expired – – – –
Outstanding at end of year 11,438,024 $ 57.73 10,295,854 $ 53.34
Exercisable at end of year 4,381,128 $ 53.03 4,135,122 $ 49.48
Available for grant 14,141,522 16,646,032
Reserved for future issue 25,579,546 26,941,886
(1) On April 7, 2022, CIBC shareholders approved a two-for-one share split (Share Split) of CIBC’s issued and outstanding common shares. The number of stock options and
the weighted-average exercise price have been adjusted to reflect the Share Split such that the value of the outstanding and vested stock options to the employees was
not impacted by the Share Split.
(2) For foreign currency-denominated options granted and exercised during the year, the weighted-average exercise prices are translated using exchange rates as at the
grant date and settlement date, respectively. The weighted-average exercise price of outstanding balances as at October 31, 2022 reflects the conversion of foreign
currency-denominated options at the year-end exchange rate.
(3) The weighted-average share price at the date of exercise was $76.35 (2021: $64.25 ).
172 CIBC 2022 ANNUAL REPORT

Consolidated financial statements
As at October 31, 2022 Stock options outstanding
(1)
Stock options vested
(1)
Range of exercise prices
Number
outstanding
Weighted-
average
contractual life
remaining
Weighted-
average
exercise
price
Number
outstanding
Weighted-
average
exercise
price
$1.00 – $20.00 73,574 0.31 $ 16.15 73,574 $ 16.15
$20.01 – $30.00 25,142 1.32 25.15 25,142 25.15
$30.01 – $40.00 171,486 2.86 31.14 171,486 31.14
$40.01 – $50.00 791,454 2.15 46.85 791,454 46.85
$50.01 – $60.00 6,636,482 6.47 55.15 2,140,046 54.82
$60.01 – $70.00 1,179,426 5.12 60.01 1,179,426 60.01
$70.01 – $80.00 2,560,460 9.10 70.05 – –
11,438,024 6.52 $ 57.73 4,381,128 $ 53.03
The fair value of options granted during the year was measured at the grant date using the Black-Scholes option pricing model. Model assumptions are
based on observable market data for the risk-free interest rate and dividend yield, contractual terms for the exercise price, and historical experience for
expected life. Volatility assumptions are best estimates of market implied volatility matching the exercise price and expected life of the options.
The following weighted-average assumptions were used as inputs into the Black-Scholes option pricing model to determine the fair value of options
on the date of grant:
For the year ended October 31 2022 2021
Weighted-average assumptions
Risk-free interest rate 1.84 % 0.96 %
Expected dividend yield 5.80 % 6.50 %
Expected share price volatility 18.03 % 20.25 %
Expected life 6 years 6 years
Share price/exercise price
(1)
$ 70.05 $ 55.395
For 2022, the weighted-average
(1)
grant date fair value of options was $4.68 (2021: $3.37). The fair value of options for 2021 has been restated to
reflect the two-for-one Share Split with a corresponding increase in the number of options granted such that the compensation expense recognized
over the vesting period is not affected by the stock split.
Compensation expense in respect of stock options totalled $21 million in 2022 (2021: $7 million).
(1) On April 7, 2022, CIBC shareholders approved a two-for-one share split (Share Split) of CIBC’s issued and outstanding common shares. Each shareholder of record at the
close of business on May 6, 2022 (Record Date) received one additional share on May 13, 2022 (Payment Date) for every one share held on the Record Date. All common
share numbers and per common share amounts have been adjusted to reflect the Share Split as if it was retroactively applied to all periods presented.
Employee share purchase plan
Under our Canadian ESPP, qualifying employees can choose each year to have any portion of their eligible earnings withheld to purchase common
shares. We match 50% of the employee contribution amount, up to a maximum contribution of 3% of eligible earnings, subject to a ceiling of
$2,250 annually. CIBC contributions vest after employees have two years of continuous participation in the plan, and all subsequent contributions
vest immediately. Similar programs exist in other regions globally, where each year qualifying employees can choose to have a portion of their
eligible earnings withheld to purchase common shares and receive a matching employer contribution subject to each plan’s provisions. Employee
contributions to our ESPP are used to purchase common shares from Treasury. CIBC FirstCaribbean operates an ESPP locally, in which
contributions are used by the plan trustee to purchase CIBC FirstCaribbean common shares in the open market.
Our contributions are expensed as incurred and totalled $57 million in 2022 (2021: $53 million).
Note 18 Post-employment benefits
We sponsor pension and other post-employment benefit plans for eligible employees in a number of jurisdictions including Canada, the U.S., the
U.K., and the Caribbean. Our pension plans include registered funded defined benefit pension plans, supplemental arrangements that provide
pension benefits in excess of statutory limits, and defined contribution plans. We also provide certain health-care, life insurance, and other benefits
to eligible employees and retired members. Plan assets and defined benefit obligations related to our defined benefit plans are measured for
accounting purposes as at October 31 each year.
Plan characteristics, funding and risks
Pension plans
Pension plans include CIBC’s Canadian, U.S., U.K., and Caribbean pension plans. CIBC’s Canadian pension plans represent approximately 91% of
our consolidated defined benefit obligation. All of our Canadian pension plans are defined benefit plans, the most significant of which is our
principal Canadian pension plan (the CIBC Pension Plan), which encompasses approximately 67,000 active, deferred, and retired members.
The CIBC Pension Plan provides members with monthly pension income at retirement based on a prescribed plan formula which is based on a
combination of maximum yearly
pensionable earnings, average earnings at retirement and length of service recognized in the plan. There is a
two-year waiting period for members to join the CIBC Pension Plan.
The CIBC Pension Plan is funded through a separate trust. Actuarial funding valuations are prepared by the Plan’s external actuary at least
once
every three years or more frequently as required by Canadian pension legislation to determine CIBC’s minimum funding requirements as well
as maximum permitted contributions. Any deficits determined in the funding valuations must generally be funded over a period not exceeding
fifteen years. CIBC’s pension funding policy is to make at least the minimum annual required contributions required by regulations. Any contributions
in excess of the minimum requirements are discretionary.
CIBC 2022 ANNUAL REPORT 173

Consolidated financial statements
The CIBC Pension Plan is registered with OSFI and the Canada Revenue Agency (CRA) and is subject to the acts and regulations that govern
federally regulated pension plans.
Other post-employment plans
Other post-employment plans include CIBC’s Canadian, U.S. and Caribbean post-retirement health-care benefit plans (referred to for disclosure
purposes as other post-employment plans). CIBC’s Canadian other post-employment plan (the Canadian post-employment plan) represents more
than 93% of our consolidated other post-employment defined benefit obligation.
The Canadian post-employment plan provides medical, dental and life insurance benefits to retirees that meet specified eligibility
requirements, including specified age and service
period eligibility requirements. CIBC reimburses 100% of the cost of benefits for eligible
employees that retired prior to January 1, 2009, whereas the contribution level for medical and dental benefits for eligible employees that retire
subsequent to this date has been fixed at a specified level. The plan is funded on a pay-as-you-go basis.
Benefit changes
There were no material changes to the terms of our Canadian defined benefit pension plans in 2022 or 2021. Certain plan amendments were made
to our other pension and other post-employment plans in 2022, which resulted in a negative past service cost.
Risks
CIBC’s defined benefit plans expose the group to actuarial risks (such as longevity risk), currency risk, interest rate risk, market (investment) risk
and health-care cost inflation risks.
The CIBC pension plan operates a currency overlay strategy, which may use forwards or similar instruments, to manage and mitigate its
currency risk.
Interest rate risk is managed as part of the CIBC pension plan’s liability-driven investment strategy through a combination of physical bonds,
overlays funded in the repo market, and/or derivatives.
Market (investment) risk is mitigated through a multi-asset portfolio construction process that diversifies across a variety of market risk drivers.
The use of derivatives within the CIBC pension plan is governed by its derivatives policy that was approved by the Pension Benefits
Management Committee (PBMC)
and permits the use of derivatives to manage risk at the discretion of the Pension Investment Committee (PIC). In
addition to the management of interest rate risk, risk reduction and mitigation strategies may include hedging of currency, credit spread and/or
equity risks. The derivatives policy also permits the use of derivatives to enhance plan returns.
Plan governance
All of CIBC’s pension arrangements are governed by local pension committees, senior management or a board of trustees. However, all significant
plan changes require approval from the Management Resources and Compensation Committee (MRCC). For the Canadian pension plans, the
MRCC is responsible for setting the strategy for the pension plans, reviewing material risks, performance including funded status, and approving
material design or governance changes.
While specific investment policies are determined at a plan level to reflect the unique characteristics of each plan, common investment policies
for all plans include the optimization of the risk-return relationship using a portfolio of multiple asset classes diversified by market segment,
economic sector, and issuer. The objectives are to secure the benefits promised by our funded plans, to maximize long-term investment returns
while not compromising the benefit security of the respective plans, manage the level of funding contributions in conjunction with the stability of the
funded status, and implement all policies in a cost effective manner. Investments in quoted debt and equity (held either directly or indirectly through
investment funds) represent the most significant asset allocations.
The use of derivatives is limited to the purposes and instruments described in the derivatives policy of the CIBC Pension Plan. These include
the use of synthetic debt or equity instruments, currency hedging, risk reduction and enhancement of returns.
Investments in specific asset classes are further diversified across funds, managers, strategies, sectors and geographies, depending on the
specific characteristics of each asset class.
The exposure to any one of these asset classes will be determined by our assessment of the needs of the plan assets and economic and
financial market conditions. Factors evaluated before adopting the asset mix include demographics, cash-flow payout requirements, liquidity
requirements, actuarial assumptions, expected benefit increases, and plan funding requirements.
Management of the assets of the various Canadian plans has been delegated primarily to the PIC, which is a committee that is composed of
CIBC management. The PIC is responsible
for the appointment and termination of individual investment managers (which includes CIBC Asset
Management Inc., a wholly owned subsidiary of CIBC), who each have investment discretion within established target asset mix ranges as set by
the PBMC. Should a fund’s actual asset mix fall outside specified ranges, the assets are re-balanced as required to be within the target asset mix
ranges. On a periodic basis, an Asset-Liability Matching study is performed in which the consequences of the strategic investment policies are
analyzed.
Management of the actuarial valuations of the various Canadian plans is primarily the responsibility of the PBMC. The PBMC is responsible for
approving the actuarial assumptions for the valuations of the plans, and for recommending the level of annual funding for the Canadian plans to
CIBC senior management.
Local committees with similar mandates manage our non-Canadian plans and annually report back to the MRCC on all material governance
activities.
174 CIBC 2022 ANNUAL REPORT

Consolidated financial statements
Amounts recognized on the consolidated balance sheet
The following tables present the financial position of our defined benefit pension and other post-employment plans for Canada, the U.S., the U.K.,
and our Caribbean subsidiaries. Other minor plans operated by some of our subsidiaries are not material and are not included in these disclosures.
$ millions, as at or for the year ended October 31
Pension plans Other post-employment plans
2022 2021 2022 2021
Defined benefit obligation
Balance at beginning of year $ 8,564 $ 9,139 $ 549 $ 609
Current service cost 265 280 7 7
Past service cost – (1) (8) 9
Interest cost on defined benefit obligation 303 267 19 17
Gain on settlements 1 – – –
Employee contributions 4 5 – –
Benefits paid (379) (386) (27) (26)
Special termination benefits (1) – – –
Foreign exchange rate changes and other
(1)
58 (49) 6 (3)
Net actuarial (gains) losses on defined benefit obligation (1,775) (691) (110) (64)
Balance at end of year $ 7,040 $ 8,564 $ 436 $ 549
Plan assets
Fair value at beginning of year $ 9,904 $ 9,341 $– $–
Interest income on plan assets
(2)
360 282 – –
Net actuarial gains (losses) on plan assets
(2)
(1,592) 479 – –
Employer contributions 79 249 27 26
Employee contributions 4 5 – –
Benefits paid (379) (386) (27) (26)
Settlements and special termination benefits (1) – – –
Plan administration costs (8) (8) – –
Foreign exchange rate changes and other
(1)
68 (58) – –
Fair value at end of year $ 8,435 $ 9,904 $– $–
Net defined benefit asset (liability) 1,395 1,340 (436) (549)
Valuation allowance
(3)
(16) (17) – –
Net defined benefit asset (liability), net of valuation allowance $ 1,379 $ 1,323 $ (436) $ (549)
(1) Includes the addition of the defined benefit obligations and plan assets related to the pension plans and other post-employment plans of immaterial subsidiaries with a net
defined benefit liability of $3 million as at October 31, 2022.
(2) The actual return on plan assets for the year was a loss of $1,232 million (2021: gain of $761 million).
(3) The valuation allowance reflects the effect of asset ceiling on plans with a net defined benefit asset.
The net defined benefit asset (liability), net of valuation allowance, included in other assets and other liabilities is as follows:
$ millions, as at October 31
Pension plans Other post-employment plans
2022 2021 2022 2021
Other assets $ 1,420 $ 1,372 $– $–
Other liabilities
(1)
(41) (49) (436) (549)
$ 1,379 $ 1,323 $ (436) $ (549)
(1) Excludes nil (2021: $4 million) of other liabilities for other post-employment plans of immaterial subsidiaries.
The defined benefit obligation and plan assets by region are as follows:
$ millions, as at October 31
Pension plans Other post-employment plans
2022 2021 2022 2021
Defined benefit obligation
Canada $ 6,382 $ 7,846 $ 405 $ 512
U.S., U.K., and the Caribbean 658 718 31 37
Defined benefit obligation at the end of year $ 7,040 $ 8,564 $ 436 $ 549
Plan assets
Canada $ 7,666 $ 8,996 $–
$–
U.S., U.K., and the Caribbean 769 908 – –
Plan assets at the end of year $ 8,435 $ 9,904 $– $–
Amounts recognized in the consolidated statement of income
The net defined benefit expense for our defined benefit plans in Canada, the U.S., the U.K., and the Caribbean is as follows:
$ millions, for the year ended October 31
Pension plans Other post-employment plans
2022 2021 2022 2021
Current service cost
(1)
$ 265 $ 280 $7 $7
Past service cost – (1) (8) 9
Gain on settlements 1 – – –
Interest cost on defined benefit obligation 303 267 19 17
Interest income on plan assets (360) (282) – –
Interest expense on effect of asset ceiling 1 – – –
Plan administration costs 8 8 – –
Net defined benefit plan expense recognized in net income $ 218 $ 272 $18 $ 33
(1) The 2022 and 202 1 current service costs were calculated using separate discount rates of 3.61 % and 2.99 %, respectively, to reflect the longer duration of future benefits
payments associated with the additional year of service to be earned by the plan’s active participants.
CIBC 2022 ANNUAL REPORT 175

Consolidated financial statements
Amounts recognized in the consolidated statement of comprehensive income
The net remeasurement gains (losses) recognized in OCI for our defined benefit plans in Canada, the U.S., the U.K., and the Caribbean is as follows:
$ millions, for the year ended October 31
Pension plans Other post-employment plans
2022 2021 2022 2021
Actuarial gains (losses) on defined benefit obligation arising from changes in:
Demographic assumptions $5
$ (1) $– $ 16
Financial assumptions 2,033 798 106 42
Experience (263) (106) 4 6
Net actuarial gains (losses) on plan assets (1,592) 479 – –
Changes in asset ceiling excluding interest income 2 – – –
Net remeasurement gains (losses) recognized in OCI
(1)
$ 185 $ 1,170 $ 110 $ 64
(1) Excludes net remeasurement gains/losses recognized in OCI in respect of immaterial subsidiaries not included in the disclosures totalling nil (2021: $6 million of net losses ).
Canadian defined benefit plans
As the Canadian defined benefit pension and other post-employment benefit plans represent approximately 91% of our consolidated defined benefit
obligation, they are the subject and focus of the disclosures in the balance of this note.
Disaggregation and maturity profile of defined benefit obligation
The breakdown of the defined benefit obligation for our Canadian plans between active, deferred and retired members is as follows:
$ millions, as at October 31
Pension plans Other post-employment plans
2022 2021 2022 2021
Active members $ 3,164 $ 4,014 $ 75 $ 99
Deferred members 410 569 – –
Retired members 2,808 3,263 330 413
Total $ 6,382 $ 7,846 $ 405 $ 512
The weighted-average duration of the defined benefit obligation for our Canadian plans is as follows:
As at October 31
Pension plans Other post-employment plans
2022 2021 2022 2021
Weighted-average duration, in years 12.7 14.2 10.4 11.7
Plan assets
The major categories of our defined benefit pension plan assets for our Canadian plans are as follows:
$ millions, as at October 31 2022 2021
Asset category
(1)
Canadian equity securities
(2)
$ 421 5 % $ 753 8 %
Debt securities
(3)
Government bonds 3,724 48 4,917 55
Corporate bonds 1,193 16 755 8
4,917 64 5,672 63
Investment funds
(4)
Canadian equity funds 22 – 40 1
U.S. equity funds 435 6 560 6
International equity funds
(5)
26 1 39 1
Global equity funds
(5)
1,083 14 1,171 13
Emerging markets equity funds – – 296 3
Fixed income funds 86 1 110 1
1,652 22 2,216 25
Other
(2)
Alternative investments
(6)
2,396 31 1,740 20
Cash and cash equivalents and other 421 6 257 2
Securities purchased under resale agreements 485 6 – –
Obligations related to securities sold under repurchase agreements and securities sold short (2,626) (34) (1,642) (18)
676 9 355 4
$ 7,666 100 % $ 8,996 100 %
(1) Asset categories are based upon risk classification including synthetic exposure through derivatives. The fair value of derivatives as at October 31, 2022 was a net
derivative asset of $24 million (2021: net derivative asset of $30 million).
(2) Pension benefit plan assets include CIBC issued securities and deposits of nil (202 2: nil), representing nil of Canadian plan assets (2021: nil). All of the equity securities
held as at October 31, 2022 and 2021 have daily quoted prices in active markets except hedge funds, infrastructure, and private equity.
(3) All debt securities held as at October 31, 2022 and 2021 are investment grade, of which $341 million (2021: $134 million) have daily quoted prices in active markets.
(4) $23 million (2021: $40 million) of the investment funds are directly held as at October 31, 2022 and have daily quoted prices in active markets.
(5) Global equity funds include North American and international investments, whereas International equity funds do not include North American investments.
(6) Comprised of private equity, infrastructure, private debt and real estate funds.
176 CIBC 2022 ANNUAL REPORT

Consolidated financial statements
Principal actuarial assumptions
The weighted-average principal assumptions used to determine the defined benefit obligation for our Canadian plans are as follows:
As at October 31
Pension plans Other post-employment plans
2022 2021 2022 2021
Discount rate 5.4 % 3.5 % 5.5 % 3.4 %
Rate of compensation increase
(1)
2.5 % 2.1 % 2.5 % 2.1 %
(1) Rates of compensation increase for 2022 and 2021 reflect the use of a salary growth rate assumption table that is based on the age and tenure of the employees. The table
yields a weighted-average salary growth rate of approximately 2.5% per annum (2021: 2.1%).
Assumptions regarding future mortality have been based on published statistics and mortality tables. The current longevities underlying the values
of the defined benefit obligation of our Canadian plans are as follows (in years):
As at October 31 2022 2021
Longevity at age 65 for current retired members
Males 23.5 23.4
Females 24.6 24.5
Longevity at age 65 for current members aged 45
Males 24.4 24.4
Females 25.5 25.4
The assumed health-care cost trend rates of the Canadian other post-employment plan providing medical, dental, and life insurance benefits are as
follows:
For the year ended October 31 2022 2021
Health-care cost trend rates assumed for next year 4.8 % 4.9 %
Rate to which the cost trend rate is assumed to decline 4.0 % 4.0 %
Year that the rate reaches the ultimate trend rate 2040 2040
Sensitivity analysis
Reasonably possible changes to one of the principal actuarial assumptions, holding other assumptions constant, would have affected the defined
benefit obligation of our Canadian plans as follows:
Estimated increase (decrease) in defined benefit obligation Pension plans Other post-employment plans
$ millions, as at October 31 2022 2022
Discount rate (100 basis point change)
Decrease in assumption $ 887 $ 47
Increase in assumption (753) (39)
Rate of compensation increase (100 basis point change)
Decrease in assumption (174) –
Increase in assumption 195 –
Health-care cost trend rates (100 basis point change)
Decrease in assumption n/a (17)
Increase in assumption n/a 20
Future mortality
1 year shorter life expectancy (139) (8)
1 year longer life expectancy 135 12
n/a Not applicable.
The sensitivity analyses presented above are indicative only, and should be considered with caution as they have been calculated in isolation
without changing other assumptions. In practice, changes in one assumption may result in changes in another, which may magnify or counteract
the disclosed sensitivities.
Future cash flows
Cash contributions
The most recently completed actuarial valuation of the CIBC Pension Plan for funding purposes was as at October 31, 2021. The next actuarial
valuation of this plan for funding purposes will be effective as of October 31, 2022.
The minimum contributions for 2023 are anticipated to be $228 million for the Canadian defined benefit pension
plans and $28 million for the
Canadian other post-employment benefit plans. These estimates are subject to change since contributions are affected by various factors, such as
market performance, regulatory requirements, and management’s ability to change funding policy.
Expected future benefit payments
The expected future benefit payments for our Canadian plans for the next 10 years are as follows:
$ millions, for the year ended October 31 2023 2024 2025 2026 2027 2028–2032 Total
Defined benefit pension plans $ 350 $ 362 $ 374 $ 387 $ 400 $ 2,198 $ 4,071
Other post-employment plans 28 29 29 30 30 158 304
$ 378 $ 391 $ 403 $ 417 $ 430 $ 2,356 $ 4,375
CIBC 2022 ANNUAL REPORT 177

Consolidated financial statements
Defined contributions and other plans
We also maintain defined contribution plans for certain employees and make contributions to government pension plans. The expense recognized
in the consolidated statement of income for these benefit plans is as follows:
$ millions, for the year ended October 31 2022 2021
Defined contribution pension plans $49 $ 40
Government pension plans
(1)
171 143
$ 220 $ 183
(1) Includes Canada Pension Plan, Quebec Pension Plan, and U.S. Federal Insurance Contributions Act.
Note 19 Income taxes
Total income taxes
$ millions, for the year ended October 31 2022 2021
Consolidated statement of income
Provision for (reversal of) current income taxes
Adjustments for prior years $35 $ (22)
Current income tax expense 1,741 1,939
1,776 1,917
Provision for (reversal of) deferred income taxes
Adjustments for prior years (27) 19
Effect of changes in tax rates and laws (4) 1
Origination and reversal of temporary differences (15) (61)
(46) (41)
1,730 1,876
OCI (268) 297
Total comprehensive income $ 1,462 $ 2,173
Components of income tax
$ millions, for the year ended October 31 2022 2021
Current income taxes
Federal $ 627 $ 918
Provincial 429 629
Foreign 459 398
1,515 1,945
Deferred income taxes
Federal 51 137
Provincial 37 90
Foreign (141) 1
(53) 228
$ 1,462 $ 2,173
The combined Canadian federal and provincial income tax rate varies each year according to changes in the statutory rates imposed by each of
these jurisdictions, and according to changes in the proportion of our business carried out in each province. We are also subject to Canadian
taxation on income of foreign branches.
Earnings of foreign subsidiaries would generally only be subject to Canadian tax when distributed to Canada. Additional Canadian taxes that
would be payable if all foreign subsidiaries’ retained earnings
were distributed to the Canadian parent as dividends are estimated to be nil.
The effective rates of income tax in the consolidated statement of income are different from the combined Canadian federal and provincial
income tax rates as set out in the following table:
Reconciliation of income taxes
$ millions, for the year ended October 31 2022 2021
Combined Canadian federal and provincial income tax rate applied to income before
income taxes $ 2,097 26.3 % $ 2,188 26.3 %
Income taxes adjusted for the effect of:
Earnings of foreign subsidiaries (199) (2.5) (136) (1.6)
Tax-exempt income (156) (2.0) (150) (1.8)
Changes in income tax rate on deferred tax balances (4) – 1 –
Impact of equity-accounted income (13) (0.2) (13) (0.2)
Other 5 0.1 (14) (0.2)
Income taxes in the consolidated statement of income $ 1,730 21.7 % $ 1,876 22.5 %
178 CIBC 2022 ANNUAL REPORT

Consolidated financial statements
Deferred income taxes
Sources of and movement in deferred tax assets and liabilities
Deferred tax assets
$ millions, for the year ended October 31
Allowance
for credit
losses
Property
and
equipment
Pension and
employee
benefits Provisions
Financial
instrument
revaluation
Tax loss
carry-
forwards
(1)
Other
Total
assets
2022 Balance at beginning of year $ 222 $ 40 $ 307 $ 103 $ 24 $ 5 $ 215 $ 916
Recognized in net income 24 3 (25) (12) (3) 2 49 38
Recognized in OCI – – (16) – 104 – – 88
Other
(2)
10 (37) 9 1 – (1) – (18)
Balance at end of year $ 256 $ 6 $ 275 $ 92 $ 125 $ 6 $ 264 $ 1,024
2021 Balance at beginning of year $ 314 $ 39 $ 554 $ 53 $ 1 $ 19 $ 236 $ 1,216
Recognized in net income (80) 3 59 51 (7) (3) (16) 7
Recognized in OCI – – (296) – 43 – – (253)
Other
(2)
(12) (2) (10) (1) (13) (11) (5) (54)
Balance at end of year $ 222 $ 40 $ 307 $ 103 $ 24 $ 5 $ 215 $ 916
Deferred tax liabilities
$ millions, for the year ended October 31
Intangible
assets
Property
and
equipment
Pension and
employee
benefits Goodwill
Financial
instrument
revaluation Other
Total
liabilities
2022 Balance at beginning of year $ (327) $ (82) $ (24) $ (88) $ (19) $ (12) $ (552)
Recognized in net income (10) (23) 33 (2) 4 6 8
Recognized in OCI – – (81) – – – (81)
Other
(2)
(4) 36 1 1 2 – 36
Balance at end of year $ (341) $ (69) $ (71) $ (89) $ (13) $ (6) $ (589)
2021 Balance at beginning of year $ (305) $ (112) $ (15) $ (86) $ (63) $ (18) $ (599)
Recognized in net income (26) 27 1 (2) 28 6 34
Recognized in OCI – – (15) – (1) – (16)
Other
(2)
4 3 5 – 17 – 29
Balance at end of year $ (327) $ (82) $ (24) $ (88) $ (19) $ (12) $ (552)
Net deferred tax assets as at October 31, 2022 $ 435
Net deferred tax assets as at October 31, 2021 $ 364
(1) The deferred tax effect of tax loss carryforwards includes $6 million (2021: $5 million) that relate to operating losses (of which $3 million relate to Canada, and $3 million
relate to the Caribbean) that expire in various years commencing in 2022, and nil (2021: nil) that relate to U.S. capital losses.
(2) Includes foreign currency translation adjustments.
Deferred tax assets and liabilities are assessed by entity for presentation in our consolidated balance sheet. As a result, the net deferred tax assets
of $435 million (2021: $364 million) are presented in the consolidated balance sheet as deferred tax assets of $480 million (2021: $402 million) and
deferred tax liabilities of $45 million (2021: $38 million).
Unrecognized tax losses
The amount of unused operating tax losses for which deferred tax assets have not been recognized was $1,620 million as at October 31, 2022
(2021: $1,611 million), of which $742 million (2021: $674 million) relates to the U.S. region and $878 million (2021: $937 million) relates to the
Caribbean region. These unused operating tax losses expire within 10 years.
The amount of unused capital tax losses for which deferred tax assets have not been recognized was $610 million as at October 31, 2022
(2021:
$519 million). These unused capital tax losses relate to Canada and are subject to the outcome of the foreign exchange capital loss
reassessment discussed below.
Enron
In prior years, the CRA issued reassessments disallowing the deduction of Enron settlement payments and related legal expenses (the Enron
expenses). In January 2019, CIBC entered into a settlement agreement with the CRA with respect to the portion of the Enron expenses deductible in
Canada. The portion of the Enron expenses deductible in the U.S. has not yet been agreed to by the Internal Revenue Service. It is possible that
adjustments may be required to the amount of tax benefits recognized in the U.S.
Dividend received deduction
The CRA has reassessed CIBC approximately $1,602 million of additional income tax related to the denial of the tax deductibility of certain 2011 to
2017 Canadian corporate dividends, on the basis that certain dividends received were part of a “dividend rental arrangement”, and similar matters.
This includes approximately $182 million of additional income tax for the 2017 taxation year that was reassessed by the CRA in May 2022. The
dividends that were subject to the reassessments are similar to those prospectively addressed by the rules in the 2015 and 2018 Canadian federal
budgets. It is possible that subsequent years may be reassessed for similar matters. In August 2021, CIBC filed a Notice of Appeal with the Tax
Court of Canada and the matter is now in litigation. CIBC is confident that its tax filing positions were appropriate and intends to defend itself
vigorously. Accordingly, no amounts have been accrued in the consolidated financial statements.
Foreign exchange capital loss reassessment
In November 2021, the Tax Court of Canada ruled against CIBC on its 2007 foreign exchange capital loss reassessment (Decision). CIBC disagrees
with the Decision and filed its Appeal in November 2021. The Appeal is scheduled to be heard in December 2022. CIBC remains confident that its
tax filing position was appropriate. Accordingly, no amounts have been accrued in the consolidated financial statements. The exposure of additional
tax and interest related to this and similar matters is approximately $300 million in addition to the potential inability to utilize approximately
$600 million in unrecognized capital tax loss carryforwards.
CIBC 2022 ANNUAL REPORT 179

Consolidated financial statements
Canadian federal budget
Following the announcement of budget proposals in April 2022, the Canadian Federal government released draft legislation in August 2022, and
subsequently introduced other draft legislation which went through first and second readings in Parliament in November 2022. These proposals
included the introduction of a one-time 15% Canada Recovery Dividend tax (CRD) on banks and life insurer groups, based on the average of 2020
and 2021 taxable income in excess of $1.0 billion. Once substantively enacted the CRD would become payable in the 2023 taxation year over a
five-year period in equal increments. The draft legislation also includes a prospective 1.5% increase in the tax rate applied to taxable income in
excess of $100 million earned by banks and life insurers. We will account for these measures in future periods once they become substantively
enacted, which is generally interpreted to occur at the point of a third reading in a Canadian Parliament held by a minority government.
Note 20 Earnings per share
$ millions, except per share amounts, for the year ended October 31 2022 2021
Basic EPS
(1)
Net income attributable to equity shareholders $ 6,220 $ 6,429
Less: preferred share dividends and distributions on other equity instruments 171 158
Net income attributable to common shareholders 6,049 6,271
Weighted-average common shares outstanding (thousands) 903,312 897,906
Basic EPS $ 6.70 $ 6.98
Diluted EPS
(1)
Net income attributable to common shareholders $ 6,049 $ 6,271
Weighted-average common shares outstanding (thousands) 903,312 897,906
Add: stock options potentially exercisable
(2)
(thousands) 2,078 2,122
Add: restricted shares and equity-settled consideration (thousands) 294 337
Weighted-average diluted common shares outstanding (thousands) 905,684 900,365
Diluted EPS $ 6.68 $ 6.96
(1) On April 7, 2022, CIBC shareholders approved a two-for-one share split (Share Split) of CIBC’s issued and outstanding common shares. Each shareholder of record at the
close of business on May 6, 2022 (Record Date) received one additional share on May 13, 2022 (Payment Date) for every one share held on the Record Date. All common
share numbers and per common share amounts have been adjusted to reflect the Share Split as if it was retroactively applied to all periods presented.
(2) For the years ended October 31, 2022 and October 31, 2021, we have not excluded any outstanding stock options from the calculation of diluted EPS as the options’
exercise prices exceeded the average market price of CIBC’s common shares.
Note 21 Commitments, guarantees and pledged assets
Commitments
Credit-related arrangements
Credit-related arrangements are generally off-balance sheet instruments and are typically entered into to meet the financing needs of clients. In
addition, there are certain exposures for which we could be obligated to extend credit that are not recorded on the consolidated balance sheet. Our
policy of requiring collateral or other security to support credit-related arrangements and the types of security held is generally the same as for
loans. The contract amounts presented below for credit-related arrangements represent the maximum amount of additional credit that we could be
obligated to extend. The contract amounts also represent the additional credit risk amounts should the contracts be fully drawn, the counterparties
default and any collateral held proves to be of no value. As many of these arrangements will expire or terminate without being drawn upon, the
contract amounts are not necessarily indicative of future cash requirements or actual risk of loss.
$ millions, as at October 31 2022 2021
Contract amounts
Securities lending
(1)
$ 53,008 $ 50,578
Unutilized credit commitments
(2)
336,261 301,343
Backstop liquidity facilities 12,855 12,174
Standby and performance letters of credit 18,459 15,775
Documentary and commercial letters of credit 209 194
Other commitments to extend credit 718 978
$ 421,510 $ 381,042
(1) Excludes securities lending of $4.9 billion (2021: $2.5 billion) for cash because it is reported on the consolidated balance sheet.
(2) Includes $167.3 billion (2021: $141.5 billion) of personal, home equity and credit card lines, which are unconditionally cancellable at our discretion.
In addition, the client securities lending of the joint ventures which CIBC has with The Bank of New York Mellon totalled $90.5 billion (2021: $81.7 billion),
of which $9.5 billion (2021: $8.6 billion) are transactions between CIBC and the joint ventures.
CIBC has provided indemnities to customers of the joint ventures in respect of securities lending transactions with third parties amounting to
$77.0 billion (2021: $68.0 billion).
For further information on the joint ventures, see Note 25.
Securities lending
Securities lending represents our credit exposure when we lend our own or our clients’ securities to a borrower and the borrower defaults on the
redelivery obligation. The borrower must fully collateralize the security lent at all times.
Unutilized credit commitments
Unutilized credit commitments are the undrawn portion of lending facilities that we have approved to meet the requirements of clients. These lines
may include various conditions that must be satisfied prior to drawdown and include facilities extended in connection with contingent acquisition
180 CIBC 2022 ANNUAL REPORT

Consolidated financial statements
financing. The credit risk associated with these lines arises from the possibility that a commitment will be drawn down as a loan at some point in the
future, prior to the expiry of the commitment. The amount of collateral obtained, if deemed necessary, is based on our credit evaluation of the
borrower and may include a charge over the present and future assets of the borrower.
Backstop liquidity facilities
We provide irrevocable backstop liquidity facilities primarily to ABCP conduits. We are the financial services agent for some of these conduits, while
other conduits are administered by third parties. The liquidity facilities for our sponsored ABCP
programs, Safe Trust, Sure Trust, Sound Trust and Stable
Trust, require us to provide funding to fund non-defaulted assets, subject to the satisfaction of certain limited conditions with respect to the conduits.
Standby and performance letters of credit
These represent an irrevocable obligation to make payments to third parties in the event that clients are unable to meet their contractual financial or
performance obligations. The credit risk
associated with these instruments is essentially the same as that involved in extending irrevocable loan
commitments to clients. The amount of collateral obtained, if deemed necessary, is based on our credit evaluation of the borrower and may include
a charge over present and future assets of the borrower.
Documentary and commercial letters of credit
Documentary and commercial letters of credit are short-term instruments issued on behalf of a client, authorizing a third-party, such as an exporter,
to draw drafts on CIBC up to a specified amount, subject to specific terms
and conditions. We are at risk for any drafts drawn that are not ultimately
settled by the client; however, the amounts drawn are collateralized by the related goods.
Other commitments to extend credit
These represent other commitments to extend credit, and primarily include forward-dated securities financing trades in the form of securities
purchased under resale agreements with various
counterparties that are executed on or before the end of our reporting period and that settle
shortly after period end, usually within five business days.
Other commitments
As an investor in merchant banking activities, we enter into commitments to fund external private equity funds. In connection with these activities, we
had commitments to invest up to $462 million (2021: $337 million).
In addition, we act as underwriter for certain new issuances under which we alone or together with a syndicate of financial institutions purchase
these new issuances for resale to investors. As at October 31, 2022, the related underwriting commitments were $936 million (2021: $268 million).
Guarantees and other indemnification agreements
Guarantees
A guarantee is a contract that requires the issuer to make specified payments to reimburse the holder for a loss it incurs because a specified debtor
failed to make payment when due in accordance with the original or modified terms of a debt instrument. Guarantees include standby and
performance letters of credit as discussed above, and credit derivatives protection sold, as discussed in Note 12.
Other indemnification agreements
In the ordinary course of business, we enter into contractual arrangements under which we may agree to indemnify the counterparty to such
arrangement from any losses relating to a breach of representations and warranties, a failure to perform certain covenants, or for claims or losses
arising from certain external events as outlined within the particular contract. This may include, for example, losses arising from changes in tax
legislation, litigation, or claims relating to past performance. In addition, we indemnify each of our directors and officers to the extent permitted by
law, against any and all claims or losses (including any amounts paid in settlement of any such claims) incurred as a result of their service to CIBC.
In most indemnities, maximum loss clauses are generally not provided for, and as a result, no defined limit of the maximum potential liability exists.
Amounts are accrued when we have a present legal or constructive obligation as a result of a past event, when it is both probable that an outflow of
economic benefits will be required to resolve the matter, and when a reliable estimate can be made of the amount of the obligation. We believe that
the likelihood of the conditions arising to trigger obligations under these contract arrangements is remote. Historically, any payments made in
respect of these contracts have not been significant. Amounts related to these indemnifications, representations, and warranties reflected within the
consolidated financial statements as at October 31, 2022 and 2021 are not significant.
Pledged assets
In the normal course of business, on- and off-balance sheet assets are pledged as collateral for various activities. The following table summarizes
asset pledging amounts and the activities to which they relate:
$ millions, as at October 31 2022 2021
Assets pledged in relation to:
Securities lending $ 53,989 $ 50,895
Obligations related to securities sold under repurchase agreements 79,759 73,687
Obligations related to securities sold short 15,284 22,790
Securitizations 19,750 18,824
Covered bonds 28,100 25,416
Derivatives 25,463 16,266
Foreign governments and central banks
(1)
286 252
Clearing systems, payment systems, and depositories
(2)
620 649
Other 12 374
$ 223,263 $ 209,153
(1) Includes assets pledged to maintain access to central bank facilities in foreign jurisdictions.
(2) Includes assets pledged in order to participate in clearing and payment systems and depositories.
CIBC 2022 ANNUAL REPORT 181

Consolidated financial statements
Note 22 Contingent liabilities and provisions
In the ordinary course of its business, CIBC is a party to a number of legal proceedings, including regulatory investigations, in which claims for
substantial monetary damages are asserted against CIBC and its subsidiaries. Legal provisions are established if, in the opinion of management, it
is both probable that an outflow of economic benefits will be required to resolve the matter, and a reliable estimate can be made of the amount of
the obligation. If the reliable estimate of probable loss involves a range of potential outcomes within which a specific amount appears to be a better
estimate, that amount is accrued. If no specific amount within the range of potential outcomes appears to be a better estimate than any other
amount, the mid-point in the range is accrued. In some instances, however, it is not possible either to determine whether an obligation is probable or
to reliably estimate the amount of loss, in which case no accrual can be made.
While there is inherent difficulty in predicting the outcome of legal proceedings, based on current knowledge and in consultation with legal
counsel, we do not expect the outcome of these matters, individually
or in aggregate, to have a material adverse effect on our consolidated financial
statements. However, the outcome of these matters, individually or in aggregate, may be material to our operating results for a particular reporting
period. We regularly assess the adequacy of CIBC’s litigation accruals and make the necessary adjustments to incorporate new information as it
becomes available.
CIBC considers losses to be reasonably possible when they are neither probable nor remote. It is reasonably possible that CIBC may incur
losses in addition to the amounts recorded
when the loss accrued is the mid-point of a range of reasonably possible losses, or the potential loss
pertains to a matter in which an unfavourable outcome is reasonably possible but not probable.
CIBC believes the estimate of the aggregate range of reasonably possible losses, in excess of the amounts accrued, for its significant legal
proceedings, where
it is possible to make such an estimate, is from nil to approximately $1.5 billion as at October 31, 2022. This estimated
aggregate range of reasonably possible losses is based upon currently available information for those significant proceedings in which CIBC is
involved, taking into account CIBC’s best estimate of such losses for those cases for which an estimate can be made. CIBC’s estimate involves
significant judgment, given the varying stages of the proceedings and the existence of multiple defendants in many of such proceedings whose
share of the liability has yet to be determined. The range does not include potential punitive damages. The matters underlying the estimated range
as at October 31, 2022 consist of the significant legal matters disclosed below. The matters underlying the estimated range will change from time to
time, and actual losses may vary significantly from the current estimate. For certain matters, CIBC does not believe that an estimate can currently be
made as many of them are in preliminary stages and certain matters have no specific amount claimed. Consequently, these matters are not
included in the range.
The following is a description of CIBC’s significant legal proceedings, which we intend to vigorously defend.
Green v. Canadian Imperial Bank of Commerce, et al.
In July 2008, a shareholder plaintiff commenced this proposed class action in the Ontario Superior Court of Justice against CIBC and several former
and current CIBC officers and directors. It alleged that CIBC and the individual officers and directors violated the Ontario Securities Act through
material misrepresentations and non-disclosures relating to CIBC’s exposure to the U.S. sub-prime mortgage market. The plaintiffs instituted this
action on behalf of all CIBC shareholders in Canada who purchased shares between May 31, 2007 and February 28, 2008. The action sought
damages of $5 billion. In July 2012, the plaintiffs’ motions for leave to file the statement of claim and for class certification were dismissed by the
Ontario Superior Court of Justice. In February 2014, the Ontario Court of Appeal released its decision overturning the lower court and allowing the
matter to proceed as a certified class action. In August 2014, CIBC and the individual defendants were granted leave to appeal to the Supreme
Court of Canada. The defendants’ appeal to the Supreme Court of Canada was heard in February 2015. In December 2015, the Supreme Court of
Canada upheld the Ontario Court of Appeal’s decision allowing the matter to proceed as a certified class action. The trial, which was scheduled to
start in October 2021, was adjourned and a settlement agreement was reached, subject to court approval. In January 2022, the court approved the
settlement. Pursuant to the settlement, CIBC has paid the plaintiffs $125 million. This matter is now closed.
Fresco v. Canadian Imperial Bank of Commerce
Gaudet v. Canadian Imperial Bank of Commerce
In June 2007, two proposed class actions were filed against CIBC in the Ontario Superior Court of Justice (Fresco) and in the Quebec Superior
Court (Gaudet). Each makes identical claims for unpaid overtime for full-time, part-time, and retail frontline non-management employees. The
Ontario action seeks $500 million in damages plus $100 million in punitive damages for all employees in Canada, while the Quebec action is limited
to employees in Quebec and has been stayed pending the outcome of the Ontario action. In June 2009, in the Ontario action, the motion judge
denied certification of the matter as a class action. In September 2010, the Ontario Divisional Court upheld the motion judge’s denial of the plaintiff’s
certification motion and the award of costs to CIBC by a two-to-one majority. In January 2011, the Ontario Court of Appeal granted the plaintiff leave
to appeal the decision denying certification. In June 2012, the Ontario Court of Appeal overturned the lower court and granted certification of the
matter as a class action. The Supreme Court of Canada released its decision in March 2013 denying CIBC leave to appeal certification of the matter
as a class action, and denying the plaintiff’s cross appeal on aggregate damages. The motions for summary judgment on liability were heard in
December 2019. In March 2020, the court found CIBC liable for unpaid overtime. CIBC appealed the liability decision. A decision on remedies was
released in August 2020 and the court certified aggregate damages as a common issue and directed that the availability and quantum, if any, of
aggregate damages be determined at a later date. The plaintiffs’ claim for punitive damages was dismissed. In October 2020, the court released its
decision on limitation periods finding that limitation periods cannot be determined on a class wide basis. CIBC appealed the decisions on remedies
and limitation periods. The appeal was heard in September 2021. In February 2022, CIBC’s appeal was dismissed. In October 2022, a settlement
agreement was reached, subject to court approval. Pursuant to the proposed settlement, CIBC will pay the plaintiffs $153 million.
182 CIBC 2022 ANNUAL REPORT

Consolidated financial statements
Credit card class actions – Interchange fees litigation:
Bancroft-Snell v. Visa Canada Corporation, et al.
9085-4886 Quebec Inc. v. Visa Canada Corporation, et al.
Watson v. Bank of America Corporation, et al.
Fuze Salon v. BofA Canada Bank, et al.
1023926 Alberta Ltd. v. Bank of America Corporation, et al.
The Crown & Hand Pub Ltd. v. Bank of America Corporation, et al.
Hello Baby Equipment Inc. v. BofA Canada Bank, et al.
Since 2011, seven proposed class actions were commenced against VISA Canada Corporation (Visa), MasterCard International Incorporated
(MasterCard), CIBC and numerous other financial institutions. The actions, brought on behalf of all merchants who accepted payment by Visa or
MasterCard from March 23, 2001 to the present, alleged two “separate, but interrelated” conspiracies: one in respect of Visa and one in respect of
MasterCard. The claims alleged that Visa and MasterCard conspired with their issuing banks to set default interchange rate and merchant discount
fees and that certain rules (Honour All Cards and No Surcharge) had the effect of increasing the merchant discount fees. The claims alleged civil
conspiracy, violation of the Competition Act, interference with economic interests and unjust enrichment. The claims sought unspecified general and
punitive damages. The motion for class certification in Watson was granted in March 2014. The appeal of the decision granting class certification
was heard in December 2014. In August 2015, the British Columbia Court of Appeal allowed the appeals in part, resulting in certain causes of action
being struck and others being reinstated. The matter remained certified as a class action. The trial in Watson which was scheduled to commence in
October 2020 was adjourned. The motion for class certification in 9085-4886 Quebec Inc. (formerly Bakopanos ) was heard in November 2017. In
February 2018, the Court certified 9085-4886 Quebec Inc. as a class action. In May 2019, the plaintiffs’ appeal of the certification decision in
9085-4886 Quebec Inc. was heard and in July 2019, the Quebec Court of Appeal allowed the plaintiffs’ appeal. Five of the seven actions were
settled subject to court approval. The settlement was approved by the courts in all five jurisdictions in December 2021. The remaining two actions
were stayed. CIBC has contributed towards the settlement. These matters are now closed.
Mortgage prepayment class actions:
Jordan v. CIBC Mortgages Inc.
Lamarre v. CIBC Mortgages Inc.
Sherry v. CIBC Mortgages Inc.
Haroch v. Toronto Dominion Bank, et al.
In 2011, three proposed class actions were filed in the Superior Courts of Ontario (Jordan), Quebec (Lamarre) and British Columbia (Sherry) against
CIBC Mortgages Inc. The representative plaintiffs alleged that since 2005, CIBC Mortgages Inc. wrongfully charged or overcharged mortgage
prepayment penalties and that the calculation clauses in the mortgage contract that provide for discretion in applying the prepayment penalties are
void and unenforceable at law. The motion for class certification in Sherry was granted in June 2014 conditional on the plaintiffs framing a workable
class definition. In July 2014, CIBC filed a Notice of Appeal. CIBC’s appeal of the certification decision in Sherry was heard in April 2016. In June
2016, the British Columbia Court of Appeal allowed the appeal in Sherry in part, resulting in certain causes of action being struck. Sherry remained
certified as a class action, and continuation of the certification motion on the amended pleading was heard November 2017. In August 2018, the
court certified certain of the plaintiffs’ causes of action in Sherry. The appeal in Sherry was heard in April 2019. In May 2020, the court dismissed
CIBC’s appeal. The certification motion in Jordan was heard in August 2018. In February 2019, the court certified Jordan as a class action. CIBC’s
motion for leave to appeal the certification decision in Jordan was denied in June 2019. The Jordan and Sherry actions were settled subject to court
approval, for which hearings were conducted in February 2022. In April 2022, the settlement in Sherry and Jordan received court approval in British
Columbia and Ontario. These matters are now closed.
In May 2018, a new proposed class action, Haroch, was filed in the Superior Court of Quebec against CIBC, CIBC Mortgages Inc. and several
other financial institutions. The action is brought on behalf of Quebec residents who during the class period allegedly paid a mortgage prepayment
charge in excess of three months’ interest. The plaintiffs allege that the defendants created complex prepayment formulas that are contrary to the
Quebec Civil Code, the Quebec Consumer Protection Act and the Interest Act and seek damages back to 2015. Haroch and Lamarre have been
consolidated. The motion for class certification in Haroch was heard in June 2019, and in July 2019, the court certified the matter as a class action
against CIBC and CIBC Mortgages Inc. CIBC and CIBC Mortgages Inc. sought leave to appeal the certification decision.
The appeal of the certification decision in Haroch did not proceed as the matter has been settled against CIBC, subject to court approval.
Cerberus Capital Management L.P. v. CIBC
In November 2015, Securitized Asset Funding 2011-2, LTD., a special purpose investment vehicle affiliated with Cerberus Capital Management L.P.
(collectively, Cerberus), commenced a New York State Court action against CIBC seeking unspecified damages of “at least hundreds of millions of
dollars”. The action relates to two transactions in 2008 and 2011 in which CIBC issued a limited recourse note and certificate to Cerberus which
significantly reduced CIBC’s exposure to the U.S. residential real estate market. The complaint alleges that CIBC breached its contracts with
Cerberus by failing to appropriately calculate and pay with respect to two of the payment streams due under the 2008 note and 2011 certificate. In
January 2016, CIBC served its answer denying Cerberus’ allegations and asserting counterclaims. Pre-trial discovery was completed and the
parties filed a Note of Issue and Certificate of Readiness for Trial in August 2021. In September 2021, CIBC filed a motion for summary judgment,
which was heard in December 2021, and denied. The non-jury trial proceeded in March 2022. The court reserved its decision.
Pilon v. Amex Bank of Canada, et al.
In January 2018, a proposed class action was commenced in Quebec against CIBC and several other financial institutions. The action alleges that
the defendants breached the Quebec Consumer Protection Act and the Bank Act when they unilaterally increased the credit limit on the plaintiffs’
credit cards. The claim seeks the return of all over limit fees charged to Quebec customers beginning in January 2015 as well as punitive damages
of $500 per class member. The motion for class certification was heard in April 2019. In August 2019, the court dismissed the certification motion.
The plaintiff’s appeal of the decision denying certification was heard in February 2021. In March 2021, the court dismissed the plaintiff’s appeal. In
May 2021, the plaintiff filed a motion seeking leave to appeal to the Supreme Court of Canada. In March 2022, the plaintiff’s motion for leave to
appeal to the Supreme Court of Canada was dismissed. This matter is now closed.
CIBC 2022 ANNUAL REPORT 183

Consolidated financial statements
Order Execution Only class actions:
Pozgaj v. CIBC and CIBC Trust
Frayce v. BMO Investorline Inc., et al.
Michaud v. BBS Securities Inc., et al.
Ciardullo v. 1832 Asset Management L.P., et al.
Ciardullo and Aggarwal v. 1832 Asset Management L.P., et al.
Woodard v. CIBC and CIBC Trust
In September 2018, a proposed class action (Pozgaj) was filed in the Ontario Superior Court against CIBC and CIBC Trust. It alleges that the
defendants should not have paid mutual fund trailing commissions to order execution only dealers. The action is brought on behalf of all persons
who held units of CIBC mutual funds through order execution only dealers and seeks $200 million in damages.
In 2020, two proposed class actions were filed in the Ontario Superior Court (Frayce) and the Supreme Court of British Columbia (Michaud)
against CIBC Investor Services Inc.
and several other dealers. The proposed actions allege that the defendants should not have received and
accepted trailing commissions for service and advice on mutual funds purchased through their respective order execution only dealers. The
proposed actions are brought on behalf of all persons who purchased units of mutual funds through an order execution only dealer owned by one or
more of the defendants and seeks unspecified compensatory and punitive damages. The motion for certification in Frayce was heard in September
2022 and taken under reserve . The Michaud action has been stayed.
In July and August 2022, two proposed class actions (Ciardullo and Ciardullo and Aggarwal) were filed in the Ontario Superior Court against
CIBC, CIBC Trust and several other financial institutions. Like the Pozgaj action, these actions allege that the defendants should not have paid
mutual fund trailing commissions to order execution only dealers. However, the actions are brought on behalf of all persons who held units of CIBC
mutual funds through dealers other than order execution only dealers. They seek unspecified damages. In November 2022, a further proposed
class action (Woodard) was filed in the Ontario Superior Court with a new proposed representative plaintiff. Woodard raises identical allegations to
Ciardullo and Ciardullo and Aggarwal, on behalf of an identical class, but only names CIBC and CIBC Trust as defendants.
York County on Behalf of the County of York Retirement Fund v. Rambo, et al.
In February 2019, a class action complaint was filed in the Northern District of California against the directors, certain officers and the underwriters
of several senior note offerings of the Pacific Gas and Electric Company (PG&E) that took place between March 2016 and April 2018, the total
issuance amount for the series of offerings being approximately US$4 billion. CIBC World Markets Corp. was part of the underwriting syndicate for
an offering, whereby CIBC World Markets Corp. underwrote 6% of a US$650 million December 2016 issuance of senior notes. The offering involved
the issuance of two tranches of notes: US$400 million of 30-year senior notes maturing in December 2046 and US$250 million of one-year floating
rate notes that matured and were repaid in November 2017. The complaint alleges that the disclosure documentation associated with the note
offerings contained misrepresentations and/or omissions of material facts, including with respect to PG&E’s failure to comply with various safety
regulations, vegetation management programs and requirements, as well as understating the extent to which its equipment has allegedly caused
multiple fires in California, including before the wildfires that occurred in California in 2017 and 2018. In October 2019, the defendants filed a motion
to dismiss.
Pope v. CIBC and CIBC Trust
In August 2020, a proposed class action was filed in the Supreme Court of British Columbia against CIBC and CIBC Trust. The action alleges that
the defendants misrepresented their investment strategy and charged unitholders excess fees in relation to certain CIBC mutual funds and certain
CIBC portfolio funds. The action is brought on behalf of all persons who hold or held units of these funds from January 2005 to present and seeks
unspecified compensatory and punitive damages. In December 2020, CIBC Asset Management Inc. was added as a defendant. The motion for
class certification was heard in August 2021. In October 2022, the court ruled that the plaintiff was required to provide additional information before
a final determination on certification could be made.
Salko v. CIBC Investor Services Inc., et al.
In March 2021, a proposed class action was commenced in Quebec against CIBC Investor Services Inc. and several other financial institutions. The
plaintiff subsequently added CIBC World Markets Inc. and additional financial institutions as defendants. The action seeks the reimbursement of
currency conversion fees alleged to have been unlawfully charged to class members and concealed by the defendants, as well as exemplary and
punitive damages. The plaintiffs seek reimbursement of fees charged to clients since March 15, 2018, as well as punitive damages in the amount of
5% of the total sum of fees charged to class members, plus interest. The certification motion was heard in April 2022. In September 2022, the action
was certified against CIBC Investor Services Inc. and several other order execution only dealers, and not certified against the full service
brokerages, including CIBC World Markets Inc. The plaintiffs are appealing the certification decision.
The Registered Retirement Savings Plan (RRSP) of J.T.G v. His Majesty The King
CIBC Trust Corporation is the trustee of a self-directed RRSP that has been the subject of proceedings in the Tax Court of Canada. The proceedings
arise from appeals of tax assessments made by the Minister of National Revenue against the RRSP for the 2004 to 2009 taxation years under Parts I
and XI.1 of the Income Tax Act (Canada). At the time they were made in March 2013, the Part I assessment amounted to approximately $139 million
and the Part XI.1 reassessment totalled approximately $144 million, in each case including all taxes, penalties and interest. In April 2021, the Tax
Court of Canada released a decision allowing the appeal in part of the assessment under Part I and dismissing the appeal of the reassessment
under Part XI.1. The RRSP by its trustee CIBC Trust has appealed this decision to the Federal Court of Appeal. To the extent there is a shortfall in the
RRSP’s ability to satisfy any of the Part XI.1 reassessment that may be upheld by the courts, CIBC Trust may be liable to pay a portion of that
reassessment.
184 CIBC 2022 ANNUAL REPORT

Consolidated financial statements
Non-sufficient funds fees class actions:
Vaillancourt-Thivierge v. Bank of Montreal, et al.
Chalmers and Campbell v. CIBC
In September 2016, a proposed class action (Vaillancourt-Thivierge ) was commenced in Quebec against CIBC and several other financial
institutions with respect to charging non-sufficient funds fees (NSF Fees) for client payment orders refused due to insufficient funds. The action
alleges that NSF Fees violate the Quebec Consumer Protection Act and the Quebec Civil Code. The action is brought on behalf of residents of
Quebec who paid NSF fees from September 12, 2013 to present. The action seeks the return of NSF fees charged as well as punitive damages of
$300 per class member. The court certified the matter as a class action in 2019.
In September 2022, a proposed class action (Chalmers) was commenced in Ontario against CIBC on behalf of personal deposit
accountholders who have been charged duplicative non-sufficient fund fees (representment
NSF Fees) on their account for a single rejected
payment order or cheque. The action alleges that this practice violates our account agreement with clients, the Ontario Consumer Protection Act
and other consumer protection statutes. The action is brought on behalf of residents of Canada who paid representment NSF Fees from January 1,
2012 to present. The action seeks the return of the representment NSF Fees charged, as well as punitive damages.
Legal provisions
The following table presents changes in our legal provisions:
$ millions, for the year ended October 31 2022 2021
Balance at beginning of year $ 301 $ 151
Additional new provisions recognized 151 169
Less:
Amounts incurred and charged against existing provisions (172) (13)
Unused amounts reversed and other adjustments (5) (6)
Balance at end of year $275 $ 301
Restructuring
The following table presents changes in the restructuring provision:
$ millions, for the year ended October 31 2022 2021
Balance at beginning of year $ 99 $ 222
Additional new provisions recognized 6 14
Less:
Amounts incurred and charged against existing provisions (59) (112)
Unused amounts reversed (11) (25)
Balance at end of year $35 $ 99
The amount of $35 million as at October 31, 2022 primarily represents obligations related to ongoing payments as a result of the restructurings.
Note 23 Concentration of credit risk
Concentration of credit exposure may arise with a group of counterparties that have similar economic characteristics or are located in the same
geographic region. The ability of such counterparties to meet contractual obligations would be similarly affected by changing economic, political or
other conditions.
The amounts of credit exposure associated with our on- and off-balance sheet financial instruments are summarized in the following table:
Credit exposure by country of ultimate risk
$ millions, as at October 31 2022 2021
Canada U.S.
Other
countries Total Canada U.S.
Other
countries Total
On-balance sheet
Major assets
(1)(2)(3)
$ 603,210 $ 209,824 $ 82,937 $ 895,971 $ 537,932 $ 181,813 $ 77,384 $ 797,129
Off-balance sheet
Credit-related arrangements
Financial institutions $ 59,480 $ 22,201 $ 12,797 $ 94,478 $ 59,636 $ 18,315 $ 16,458 $ 94,409
Governments 11,354 24 6,280 17,658 11,229 10 8 11,247
Retail 178,863 997 492 180,352 154,341 700 383 155,424
Corporate 78,372 40,036 10,614 129,022 77,939 33,233 8,790 119,962
$ 328,069 $ 63,258 $ 30,183 $ 421,510 $ 303,145 $ 52,258 $ 25,639 $ 381,042
(1) Major assets consist of cash and deposits with banks, loans and acceptances net of allowance for credit losses, securities, securities borrowed or purchased under resale
agreements, and derivative instruments.
(2) Includes Canadian currency of $572.3 billion (2021: $522.8 billion) and foreign currencies of $323.7 billion (202 1: $274.3 billion).
(3) No industry or foreign jurisdiction accounted for 10% or more of loans and acceptances net of allowance for credit losses, with the exception of the U.S., which accounted for
15% as at October 31, 2022 (2021: 13%) and the real estate and construction industry, which across all jurisdictions accounted for 10% as at October 31, 2022 (2021: less
than 10%). Canadian residential mortgages accounted for 50% as at October 31, 2022 (2021: 53%) of loans and acceptances net of allowance for credit losses.
See Note 12 for derivative instruments by country and counterparty type of ultimate risk. In addition, see Note 21 for details on the client securities
lending of the joint ventures which CIBC has with The Bank of New York Mellon.
Also see shaded sections in “MD&A – Management of risk” for a detailed discussion on our credit risk.
CIBC 2022 ANNUAL REPORT 185

Consolidated financial statements
Note 24 Related-party transactions
In the ordinary course of business, we provide banking services and enter into transactions with related parties on terms similar to those offered to
unrelated parties. Related parties include key management personnel
(1)
, their close family members, and entities that they or their close family
members control or jointly control. Related parties also include associates and joint ventures accounted for under the equity method, and post-
employment benefit plans for CIBC employees. Loans to these related parties are made in the ordinary course of business and on substantially the
same terms as for comparable transactions with unrelated parties. As CIBC’s subsidiaries are consolidated, transactions with these entities have
been eliminated and are not reported as related-party transactions. We offer a subsidy on annual fees and preferential interest rates on credit card
balances to senior officers, which is the same offer extended to all employees of CIBC.
Key management personnel and their affiliates
As at October 31, 2022, loans to key management personnel
(1)
and their close family members and to entities that they or their close family
members control or jointly control totalled $32 million (2021: $17 million), letters of credit and guarantees were nil (2021: nil), and undrawn credit
commitments totalled $21 million (2021: $11 million). Of these outstanding balances, $31 million (2021: $15 million) were secured and $1 million
(2021: $2 million) were unsecured. We have no provision for credit losses on impaired loans relating to these amounts for the years ended
October 31, 2022 and 2021. Loans to these related parties are made in the ordinary course of business and on substantially the same terms as for
comparable transactions with unrelated parties. We offer a subsidy on annual fees and preferential interest rates on credit card balances to senior
officers which is the same offer extended to all employees of CIBC.
(1) Key management personnel are defined as those persons having authority and responsibility for planning, directing and controlling the activities of CIBC directly or
indirectly and comprise the members of the Board (referred to as directors), Executive Committee and certain named officers per the Bank Act (Canada) (collectively
referred to as senior officers). Board members who are also Executive Committee members are included as senior officers.
Compensation of key management personnel
$ millions, for the year ended October 31 2022 2021
Directors
Senior
officers Directors
Senior
officers
Short-term benefits
(1)
$3 $23 $3 $18
Post-employment benefits – 3 – 3
Share-based benefits
(2)
1 38 1 30
Termination benefits
(3)
– 2 – 3
Total compensation $4 $66 $4 $5 4
(1) Comprises salaries, statutory and non-statutory benefits related to senior officers and fees related to directors recognized during the year. Also includes annual incentive
plan payments related to senior officers on a cash basis.
(2) Comprises grant-date fair values of awards granted in the year.
(3) Comprises payments made in the period to key management personnel and former key management personnel. Prior period amounts were restated to conform to the
current period presentation .
Refer to the following Notes for additional details on related-party transactions:
Share-based payment plans
See Note 17 for details of these plans offered to directors and senior officers.
Post-employment benefit plans
See Note 18 for related-party transactions between CIBC and the post-employment benefit plans.
Equity-accounted associates and joint ventures
See Note 25 for details of our investments in equity-accounted associates and joint ventures.
186 CIBC 2022 ANNUAL REPORT

Consolidated financial statements
Note 25 Investments in equity-accounted associates and joint ventures
Joint ventures
CIBC is a 50/50 joint venture partner with The Bank of New York Mellon in two joint ventures: CIBC Mellon Trust Company and CIBC Mellon Global
Securities Services Company (collectively referred to as CIBC Mellon), which provide trust and asset servicing, both in Canada. As at October 31,
2022, the carrying value of our investments in the joint ventures was $426 million (2021: $592 million), which was included in Corporate and Other.
As at October 31, 2022, loans to the joint ventures totalled nil (2021: $5 million) and undrawn credit commitments totalled $130 million (2021:
$122 million).
CIBC, The Bank of New York Mellon, and CIBC Mellon have, jointly and severally, provided indemnities to customers of the joint ventures in
respect of
securities lending transactions. See Note 21 for additional details.
There was no unrecognized share of losses of any joint ventures, either for the year or cumulatively. In 2022 and 2021, none of our joint
ventures experienced any significant restrictions to transfer funds in the form of cash dividends or distributions, or repayment of loans or advances.
The following table provides the summarized aggregate financial information related to our proportionate interest in the equity-accounted joint
ventures:
$ millions, for the year ended October 31 2022 2021
Net income $52 $ 51
OCI (218) (44)
Total comprehensive income (loss) $ (166) $7
Associates
As at October 31, 2022, the total carrying value of our investments in associates was $206 million (2021: $66 million). These investments comprise:
listed associates with a carrying value of $33 million (2021: nil) and a fair value of $33 million (2021: nil), based on quoted prices in an active market
categorized as level 1 valuation inputs within the fair value hierarchy; and unlisted associates with a carrying value of $173 million (2021: $66 million)
and a fair value of $197 million (2021: $89 million), based on non-observable valuation inputs categorized as level 3 valuation inputs within the fair
value hierarchy. Of the total carrying value of our investments in associates, $18 million (2021: $9 million) was included in Canadian Personal and
Business Banking, $33 million (2021: nil) in Canadian Commercial Banking and Wealth Management, $7 million (2021: nil) in U.S. Commercial
Banking and Wealth Management, $109 million (2021: $37 million) in Capital Markets, and $39 million (2021: $20 million) in Corporate and Other.
As at October 31, 2022, loans to associates totalled nil (2021: $34 million) and undrawn credit commitments totalled $1 million (2021: $1 million).
We also had commitments to invest up to nil (2021: nil) in our associates.
There was no unrecognized share of losses of any associate, either for the year or cumulatively. In 2022 and 2021, none of our associates
experienced any significant restrictions to transfer funds in the form of cash dividends or distributions, or repayment of loans or advances.
The following table provides the summarized aggregate financial information related to our proportionate interest in equity-accounted
associates:
$ millions, for the year ended October 31 2022 2021
Net income (loss) $ (5) $4
OCI – 1
Total comprehensive income (loss) $(5) $5
CIBC 2022 ANNUAL REPORT 187

Consolidated financial statements
Note 26 Significant subsidiaries
The following is a list of significant subsidiaries in which CIBC, either directly or indirectly, owns 100% of the voting shares, except where noted.
$ millions, as at October 31, 2022
Subsidiary name
(1)
Address of head
or principal office
Book value of
shares owned
by CIBC
(2)
Canada and U.S.
CIBC Asset Management Inc. Toronto, Ontario, Canada $ 444
CIBC BA Limited Toronto, Ontario, Canada –
(3)
CIBC Bancorp USA Inc. Chicago, Illinois, U.S. 10,595
Canadian Imperial Holdings Inc. New York, New York, U.S.
CIBC Inc. New York, New York, U.S.
CIBC World Markets Corp. New York, New York, U.S.
CIBC Bank USA Chicago, Illinois, U.S.
CIBC Private Wealth Group, LLC Atlanta, Georgia, U.S.
CIBC Delaware Trust Company Wilmington, Delaware, U.S.
CIBC National Trust Company Atlanta, Georgia, U.S.
CIBC Private Wealth Advisors, Inc. Chicago, Illinois, U.S.
CIBC Investor Services Inc. Toronto, Ontario, Canada 25
CIBC Life Insurance Company Limited Toronto, Ontario, Canada 23
CIBC Mortgages Inc. Toronto, Ontario, Canada 230
CIBC Securities Inc. Toronto, Ontario, Canada 2
CIBC Trust Corporation Toronto, Ontario, Canada 591
CIBC World Markets Inc. Toronto, Ontario, Canada 306
CIBC Wood Gundy Financial Services Inc. Toronto, Ontario, Canada
CIBC Wood Gundy Financial Services (Quebec) Inc. Montreal, Quebec, Canada
INTRIA Items Inc. Mississauga, Ontario, Canada 100
International
CIBC Australia Ltd Sydney, New South Wales, Australia 19
CIBC Capital Markets (Europe) S.A. Luxembourg 550
CIBC Cayman Holdings Limited George Town, Grand Cayman, Cayman Islands 1,742
CIBC Cayman Bank Limited George Town, Grand Cayman, Cayman Islands
CIBC Cayman Capital Limited George Town, Grand Cayman, Cayman Islands
CIBC Cayman Reinsurance Limited George Town, Grand Cayman, Cayman Islands
CIBC Investments (Cayman) Limited George Town, Grand Cayman, Cayman Islands 2,820
FirstCaribbean International Bank Limited (91.7%) Warrens, St. Michael, Barbados
FirstCaribbean International Bank and Trust Company (Cayman) Limited (91.7%) George Town, Grand Cayman, Cayman Islands
CIBC Fund Administration Services (Asia) Limited (91.7%) Hong Kong, China
FirstCaribbean International Bank (Bahamas) Limited (87.3%) Nassau, The Bahamas
Sentry Insurance Brokers Ltd. (87.3%) Nassau, The Bahamas
FirstCaribbean International Bank (Barbados) Limited (91.7%) Warrens, St. Michael, Barbados
FirstCaribbean International Bank (Cayman) Limited (91.7%) George Town, Grand Cayman, Cayman Islands
FirstCaribbean International Finance Corporation (Netherlands Antilles) N.V. (91.7%) Curacao, Netherlands Antilles
FirstCaribbean International Bank (Curacao) N.V. (91.7%) Curacao, Netherlands Antilles
FirstCaribbean International Bank (Jamaica) Limited (91.7%) Kingston, Jamaica
FirstCaribbean International Bank (Trinidad and Tobago) Limited (91.7%) Maraval, Port of Spain, Trinidad & Tobago
FirstCaribbean International Trust Company (Bahamas) Limited (91.7%) Nassau, The Bahamas
FirstCaribbean International Wealth Management Bank (Barbados) Limited (91.7%) Warrens, St. Michael, Barbados
CIBC World Markets (Japan) Inc.
188 CIBC 2022 ANNUAL REPORT
Tokyo, Japan 48
(1) Each subsidiary is incorporated or organized under the laws of the state or country in which the principal office is situated, except for Canadian Imperial Holdings Inc.,
CIBC Inc., CIBC World Markets Corp., CIBC Private Wealth Group, LLC, CIBC Private Wealth Advisors, Inc., and CIBC Bancorp USA Inc., which were incorporated or
organized under the laws of the State of Delaware, U.S.; CIBC National Trust Company, which was organized under the laws of the U.S.; and CIBC World Markets (Japan)
Inc., which was incorporated in Barbados.
(2) The book value of shares of subsidiaries is shown at cost and may include non-voting common and preferred shares. These amounts are eliminated upon consolidation.
(3) The book value of shares owned by CIBC is less than $1 million.
In addition to the above, we consolidate certain SEs where we have control over the SE. See Note 6 for additional details.

Consolidated financial statements
Note 27 Financial instruments – disclosures
Certain disclosures required by IFRS 7 are provided in the shaded sections of the “MD&A – Management of risk”, as permitted by IFRS. The
following table provides a cross referencing of those disclosures in the MD&A.
Description Section
For each type of risk arising from financial instruments, an entity shall disclose: the exposure to risks and how they
arise; objectives, policies and processes used for managing the risks; methods used to measure the risk; and
description of collateral.
Risk overview
Credit risk
Market risk
Liquidity risk
Operational risk
Reputation and legal risks
Conduct risk
Regulatory compliance risk
Credit risk: gross exposure to credit risk, credit quality and concentration of exposures. Credit risk
Market risk: trading portfolios – Value-at-Risk (VaR); stressed VaR, incremental risk charge, non-trading portfolios –
interest rate risk, foreign exchange risk and equity risk.
Market risk
Liquidity risk: liquid assets, maturity of financial assets and liabilities, and credit commitments. Liquidity risk
We have provided quantitative disclosures related to credit risk consistent with Basel guidelines in the “Credit risk” section of the MD&A. The table
below sets out the categories of the on-balance sheet exposures that are subject to the credit risk framework as set out in the CAR Guideline issued
by OSFI under the different Basel approaches based on the carrying value of those exposures in our consolidated financial statements. The credit
risk framework includes CCR exposures arising from OTC derivatives, repo-style transactions and trades cleared through CCPs, as well as
securitization exposures. Items not subject to the credit risk framework include exposures that are subject to the market risk framework, amounts
that are not subject to capital requirements or are subject to deduction from capital, and amounts relating to CIBC’s insurance subsidiaries, which
are excluded from the scope of regulatory consolidation.
$ millions, as at October 31
AIRB
approach
Standardized
approach
Other
credit risk
(1)
Total
subject to
credit risk
Not
subject to
credit risk
Total
consolidated
balance sheet
2022 Cash and deposits with banks $ 47,670 $ 13,724 $ 2,458 $ 63,852 $ 9 $ 63,861
Securities 110,695 14,678 – 125,373 50,506 175,879
Cash collateral on securities borrowed 15,320 6 – 15,326 – 15,326
Securities purchased under resale agreements 69,213 – – 69,213 – 69,213
Loans 457,858 57,650 1,663 517,171 2,985 520,156
Allowance for credit losses (2,317) (756) – (3,073) – (3,073)
Derivative instruments 43,031 4 – 43,035 – 43,035
Customers’ liability under acceptances 11,247 327 – 11,574 – 11,574
Other assets 28,951 423 7,834 37,208 10,418 47,626
Total credit exposures $ 781,668 $ 86,056 $ 11,955 $ 879,679 $ 63,918 $ 943,597
2021 Total credit exposures $ 688,150 $ 69,886 $ 11,275 $ 769,311 $ 68,372 $ 837,683
(1) Includes credit risk exposures arising from other assets that are subject to the credit risk framework but are not included in the standardized or AIRB frameworks, including
other balance sheet assets which are risk-weighted at 100%, significant investments in the capital of non-financial institutions, and amounts below the thresholds for capital
deduction that are risk-weighted at 250%.
CIBC 2022 ANNUAL REPORT 189

Consolidated financial statements
Note 28 Offsetting financial assets and liabilities
The following table identifies the amounts that have been offset on the consolidated balance sheet in accordance with the requirements of IAS 32
“Financial Instruments: Presentation”, and also those amounts that are subject to enforceable netting agreements but do not qualify for offsetting on
the consolidated balance sheet either because we do not have a currently enforceable legal right to set-off the recognized amounts, or because we
do not intend to settle on a net basis or to realize the asset and settle the liability simultaneously.
$ millions, as at October 31
Amounts subject to enforceable netting agreements
Amounts not
subject to
enforceable
netting
agreements
(4)
Net amounts
presented on
the consolidated
balance sheet
Gross
amounts of
recognized
financial
assets
Gross
amounts
offset on the
consolidated
balance sheet
(1)
Net
amounts
Related amounts not set-off on
the consolidated balance sheet
Financial
instruments
(2)
Collateral
received
(3)
Net
amounts
2022 Financial assets
Derivatives $ 39,731 $ (4) $ 39,727 $ (25,999) $ (5,974) $ 7,754 $ 3,308 $ 43,035
Cash collateral on securities borrowed 15,326 – 15,326 – (14,893) 433 – 15,326
Securities purchased under resale
agreements 72,489 (3,276) 69,213 – (65,720) 3,493 – 69,213
$ 127,546 $ (3,280) $ 124,266 $ (25,999) $ (86,587) $ 11,680 $ 3,308 $ 127,574
Financial liabilities
Derivatives $ 47,369 $ (4) $ 47,365 $ (25,999) $ (12,910) $ 8,456 $ 4,975 $ 52,340
Cash collateral on securities lent 4,853 – 4,853 – (4,730) 123 – 4,853
Obligations related to securities sold
under repurchase agreements 80,447 (3,276) 77,171 – (73,605) 3,566 – 77,171
$ 132,669 $ (3,280) $ 129,389 $ (25,999) $ (91,245) $ 12,145 $ 4,975 $ 134,364
2021 Financial assets
Derivatives $ 53,285 $ (22,668) $ 30,617 $ (16,585) $ (6,375) $ 7,657 $ 5,295 $ 35,912
Cash collateral on securities borrowed 12,368 – 12,368 – (12,121) 247 – 12,368
Securities purchased under resale
agreements 71,777 (4,205) 67,572 – (66,423) 1,149 – 67,572
$ 137,430 $ (26,873) $ 110,557 $ (16,585) $ (84,919) $ 9,053 $ 5,295 $ 115,852
Financial liabilities
Derivatives $ 49,607 $ (22,668) $ 26,939 $ (16,585) $ (6,617) $ 3,737 $ 5,162 $ 32,101
Cash collateral on securities lent 2,463 – 2,463 – (2,331) 132 – 2,463
Obligations related to securities sold
under repurchase agreements 76,085 (4,205) 71,880 – (70,567) 1,313 – 71,880
$ 128,155 $ (26,873) $ 101,282 $ (16,585) $ (79,515) $ 5,182 $ 5,162 $ 106,444
(1) Comprises amounts related to financial instruments which qualify for offsetting. This amount excludes derivatives which are settled-to-market (STM) as STM derivatives are
settled on a daily basis, resulting in derecognition, rather than offsetting, of the related amounts. Beginning October 2022, a majority of derivatives cleared through LCH
was elected to be STM, consistent with derivatives cleared through CME.
(2) Comprises amounts subject to set-off under enforceable netting agreements, such as ISDA agreements, derivative exchange or clearing counterparty agreements, global
master repurchase agreements, and global master securities lending agreements. Under such arrangements, all outstanding transactions governed by the relevant
agreement can be offset if an event of default or other predetermined event occurs.
(3) Collateral received and pledged amounts are reflected at fair value, but have been limited to the net balance sheet exposure so as not to include any over-collateralization.
(4) Includes exchange-traded derivatives and derivatives which are STM.
The offsetting and collateral arrangements discussed above and other credit risk mitigation strategies used by CIBC are further explained in the
“Credit risk” section of the MD&A. Certain amounts of securities received as collateral are restricted from being sold or re-pledged.
Note 29 Interest income and expense
The table below provides the consolidated interest income and expense by accounting categories.
$ millions, for the year ended October 31
Interest
income
Interest
expense
2022 Measured at amortized cost
(1)(2)
$ 19,140 $ 8,778
Debt securities measured at FVOCI
(1)
855 n/a
Other
(3)
2,184 760
Total $ 22,179 $ 9,538
2021 Measured at amortized cost
(1)(2)
$ 12,816 $ 2,830
Debt securities measured at FVOCI
(1)
349 n/a
Other
(3)
1,576 452
Total $ 14,741 $ 3,282
(1) Interest income for financial instruments that are measured at amortized cost and debt securities that are measured at FVOCI is calculated using the effective interest rate method.
(2) Includes interest income on sublease-related assets and interest expense on lease liabilities under IFRS 16.
(3) Includes interest income and expense and dividend income for financial instruments that are mandatorily measured and designated at FVTPL and equity securities
designated at FVOCI.
n/a Not applicable.
190 CIBC 2022 ANNUAL REPORT

Consolidated financial statements
Note 30 Segmented and geographic information
CIBC has four SBUs – Canadian Personal and Business Banking, Canadian Commercial Banking and Wealth Management, U.S. Commercial
Banking and Wealth Management, and Capital Markets. These SBUs are supported by Corporate and Other.
Canadian Personal and Business Banking provides personal and business clients across Canada with financial advice, services and solutions
through banking centres, as well as mobile and online channels to help make their ambitions a reality.
Canadian Commercial Banking and Wealth Management provides high-touch, relationship-oriented banking and wealth management services
to middle-market companies, entrepreneurs, high-net-worth individuals and families across Canada, as well as asset management services to
institutional investors.
U.S. Commercial Banking and Wealth Management provides high-touch, relationship-oriented banking and wealth management services
across the
U.S., focused on middle-market and mid-corporate companies, entrepreneurs, high-net-worth individuals and families, as well as
personal and small business banking services in four U.S. Midwestern markets.
Capital Markets provides integrated global markets products and services, investment banking advisory and execution, corporate banking
solutions and top-ranked research
to our clients around the world. It includes Direct Financial Services which focuses on expanding CIBC’s digital
capabilities to provide a cohesive set of direct banking, direct investing and innovative multi-currency payment solutions for CIBC’s clients.
Corporate and Other includes the following functional groups – Technology, Infrastructure and Innovation, Risk Management, People, Culture
and Brand, Finance and Enterprise
Strategy, as well as other support groups. The expenses of these functional and support groups are generally
allocated to the business lines within the SBUs. The majority of the functional and support costs of CIBC Bank USA are recognized directly in the
U.S. Commercial Banking and Wealth Management SBU. Corporate and Other also includes the results of CIBC FirstCaribbean and other strategic
investments, as well as other income statement and balance sheet items not directly attributable to the business lines.
Business unit allocations
Revenue, expenses, and other balance sheet resources related to certain activities are generally allocated to the lines of business within the SBUs.
Treasury activities impact the financial results of the SBUs. Each line of business within our SBUs is charged or credited with a market-based
cost of funds on assets
and liabilities, respectively, which impacts the revenue performance of the SBUs. This market-based cost of funds takes into
account the cost of maintaining sufficient regulatory capital to support business requirements, including the cost of preferred shares. Once the
interest and liquidity risks inherent in our client-driven assets and liabilities are transfer priced into Treasury, they are managed within CIBC’s risk
framework and limits. Capital is attributed to the SBUs based on the estimated amount of regulatory capital required to support their businesses,
which is intended to consistently measure and align the costs with the underlying benefits and risks associated with SBU activities. Earnings on
unattributed capital remain in Corporate and Other.
We review our transfer pricing methodologies on an ongoing basis to ensure they reflect changing market environments and industry
practices.
We use a Product Owner/Customer Segment/Distributor Channel allocation management model to measure and report the results of
operations
of various lines of business within our SBUs. The model uses certain estimates and methodologies to process internal transfers between
the impacted lines of business for sales, renewals and trailer commissions as well as certain attributable costs. Periodically, the sales, renewals and
trailer commission rates paid to customer segments for certain products/services are revised and applied prospectively.
The non-interest expenses of the functional and support groups are generally allocated to the business lines within the SBUs based on
appropriate criteria and methodologies. The basis of allocation is reviewed periodically to reflect changes in support to business lines. Other costs
not directly attributable to business lines remain in Corporate and Other.
We recognize provision for credit losses on both impaired (stage 3) and performing (stages 1 and 2) loans in the respective SBUs.
CIBC 2022 ANNUAL REPORT 191

Consolidated financial statements
Results by reporting segments and geographic areas
$ millions, for the year ended October 31
Canadian
Personal
and Business
Banking
Canadian
Commercial
Banking
and Wealth
Management
U.S.
Commercial
Banking
and Wealth
Management
Capital
Markets
Corporate
and Other
CIBC
Total Canada
(1)
U.S.
(1)
Caribbean
(1)
Other
countries
(1)
2022 Net interest income
(2)
$ 6,657 $ 1,672 $ 1,655 $ 2,814 $ (157) $ 12,641 $ 9,870 $ 1,732 $ 873 $ 166
Non-interest income
(3)(4)
2,252 3,582 802 2,187 369 9,192 6,467 1,551 718 456
Total revenue 8,909 5,254 2,457 5,001 212 21,833 16,337 3,283 1,591 622
Provision for (reversal of)
credit losses 876 23 218 (62) 2 1,057 864 191 1 1
Amortization and impairment
(5)
226 2 113 6 700 1,047 824 136 67 20
Other non-interest expenses 4,749 2,654 1,215 2,431 707 11,756 9,299 1,690 535 232
Income (loss) before income
taxes 3,058 2,575 911 2,626 (1,197) 7,973 5,350 1,266 988 369
Income taxes
(2)
809 680 151 718 (628) 1,730 1,195 320 116 99
Net income (loss) $ 2,249 $ 1,895 $ 760 $ 1,908 $ (569) $ 6,243 $ 4,155 $ 946 $ 872 $ 270
Net income (loss) attributable to:
Non-controlling interests $ – $ – $ – $ – $ 23 $ 23 $ – $ – $ 23 $ –
Equity shareholders 2,249 1,895 760 1,908 (592) 6,220 4,155 946 849 270
Average assets
(6)(7)
$ 305,070 $ 84,693 $ 53,983 $ 284,259 $ 172,208 $ 900,213 $ 685,956 $ 147,723 $ 43,123 $ 23,411
192 CIBC 2022 ANNUAL REPORT
2021 Net interest income
(2)
$ 5,954 $ 1,291 $ 1,449 $ 2,701 $ 64 $ 11,459 $ 9,159 $ 1,470 $ 672 $ 158
Non-interest income
(3)(4)
2,196 3,379 745 1,819 417 8,556 6,230 1,365 622 339
Total revenue 8,150 4,670 2,194 4,520 481 20,015 15,389 2,835 1,294 497
Provision for (reversal of)
credit losses 350 (39) (75) (100) 22 158 320 (165) 21 (18)
Amortization and impairment
(5)
213 27 109 11 657 1,017 812 128 60 17
Other non-interest expenses 4,201 2,416 1,012 2,106 783 10,518 8,423 1,382 504 209
Income (loss) before income
taxes 3,386 2,266 1,148 2,503 (981) 8,322 5,834 1,490 709 289
Income taxes
(2)
892 601 222 646 (485) 1,876 1,320 381 101 74
Net income (loss) $ 2,494 $ 1,665 $ 926 $ 1,857 $ (496) $ 6,446 $ 4,514 $ 1,109 $ 608 $ 215
Net income (loss) attributable to:
Non-controlling interests $ – $ – $ – $ – $ 17 $ 17 $ – $ – $ 17 $ –
Equity shareholders 2,494 1,665 926 1,857 (513) 6,429 4,514 1,109 591 215
Average assets
(6)(7)
$
27
2,645
$
70,070
$
46,733
$ 255,063 $ 165,110 $ 8
09,621
$ 624,791 $ 130,302 $ 36,777 $
17,75
1
(1) Net income and average assets are allocated based on the geographic location where they are recorded.
(2) Capital Markets net interest income and income taxes include taxable equivalent basis (TEB) adjustments of $211 million (2021: $204 million) with an equivalent offset in
Corporate and Other.
(3) The fee and commission income within non-interest income consists primarily of underwriting and advisory fees, deposit and payment fees, credit fees, card fees,
investment management and custodial fees, mutual fund fees and commissions on securities transactions. Underwriting and advisory fees are earned primarily in Capital
Markets with the remainder earned in Canadian Commercial Banking and Wealth Management. Deposit and payment fees are earned primarily in Canadian Personal and
Business Banking, with the remainder earned mainly in Canadian Commercial Banking and Wealth Management, Capital Markets and Corporate and Other. Credit fees are
earned primarily in Canadian Commercial Banking and Wealth Management, Capital Markets, and U.S. Commercial Banking and Wealth Management. Card fees are
earned primarily in Canadian Personal and Business Banking, with the remainder earned mainly in Corporate and Other. Investment management and custodial fees are
earned primarily in Canadian Commercial Banking and Wealth Management and U.S. Commercial Banking and Wealth Management, with the remainder earned mainly in
Corporate and Other. Mutual fund fees are earned primarily in Canadian Commercial Banking and Wealth Management and U.S. Commercial Banking and Wealth
Management. Commissions on securities transactions are earned primarily in Capital Markets and Canadian Commercial Banking and Wealth Management.
(4) Includes intersegment revenue, which represents internal sales commissions and revenue allocations under the Product Owner/Customer Segment/Distributor Channel
allocation management model.
(5) Comprises amortization and impairment of buildings, right-of-use assets, furniture, equipment, leasehold improvements, software and other intangible assets, and goodwill.
(6) Assets are disclosed on an average basis as this measure is most relevant to a financial institution and is the measure reviewed by management.
(7) Average balances are calculated as a weighted average of daily closing balances.
The following table provides a breakdown of revenue from our reporting segments:
$ millions, for the year ended October 31 2022 2021
Canadian Personal and Business Banking $ 8,909 $ 8,150
Canadian Commercial Banking and Wealth Management
Commercial banking $ 2,278 $ 1,827
Wealth management 2,976 2,843
$ 5,254 $ 4,670
U.S. Commercial Banking and Wealth Management
Commercial banking $ 1,613 $ 1,444
Wealth management
(1)
844 750
$ 2,457 $ 2,194
Capital Markets
(2)
Global markets $ 2,322 $ 2,076
Corporate and investment banking 1,700 1,616
Direct financial services 979 828
$ 5,001 $ 4,520
Corporate and Other
(2)
International banking $ 778 $ 687
Other (566) (206)
$ 212 $ 481
(1) Includes revenue related to the U.S. Paycheck Protection Program.
(2) Capital Markets revenue includes a TEB adjustment of $211 million (2021: $204 million) with an equivalent offset in Corporate and Other.

Consolidated financial statements
Note 31 Future accounting policy changes
IFRS 17 “Insurance Contracts” (IFRS 17)
IFRS 17 “Insurance Contracts” (IFRS 17), issued in May 2017, replaces IFRS 4 “Insurance Contracts”. On June 25, 2020, the IASB issued
amendments to IFRS 17 partly aimed at helping companies implement the standard. IFRS 17, incorporating the amendments, is effective for annual
reporting periods beginning on or after January 1, 2023, which for us will be November 1, 2023. IFRS 17 provides comprehensive guidance on the
recognition, measurement, presentation and disclosure of insurance contracts we issue and reinsurance contracts we hold. IFRS 17 is to be applied
retrospectively unless impracticable. We expect changes in the timing of revenue recognition for our insurance contracts and changes to our
insurance contract liabilities as a result of IFRS 17.
We continue to evaluate the effect of this standard on our consolidated financial statements.
CIBC 2022 ANNUAL REPORT 193

Quarterly review
Condensed consolidated statement of income
Unaudited, $ millions, for the three months ended Oct. 31 Jul. 31 Apr. 30
2022
Jan. 31 Oct. 31 Jul. 31 Apr. 30
2021
Jan. 31
Net interest income $ 3,185 $ 3,236 $ 3,088 $ 3,132 $ 2,980 $ 2,893 $ 2,747 $ 2,839
Non-interest income 2,203 2,335 2,288 2,366 2,084 2,163 2,185 2,124
Total revenue 5,388 5,571 5,376 5,498 5,064 5,056 4,932 4,963
Provision for (reversal of) credit losses 436 243 303 75 78 (99) 32 147
Non-interest expenses 3,483 3,183 3,114 3,023 3,135 2,918 2,756 2,726
Income before income taxes 1,469 2,145 1,959 2,400 1,851 2,237 2,144 2,090
Income taxes 284 479 436 531 411 507 493 465
Net income $ 1,185 $ 1,666 $ 1,523 $ 1,869 $ 1,440 $ 1,730 $ 1,651 $ 1,625
Net income attributable to non-controlling
interests $7 $6 $5 $5 $4 $5 $4 $4
Preferred shareholders and other equity
instrument holders 37 46 47 41 47 30 51 30
Common shareholders 1,141 1,614 1,471 1,823 1,389 1,695 1,596 1,591
Net income attributable to equity shareholders $ 1,178 $ 1,660 $ 1,518 $ 1,864 $ 1,436 $ 1,725 $ 1,647 $ 1,621
Condensed consolidated balance sheet
Unaudited, $ millions, as at Oct. 31 Jul. 31 Apr. 30
2022
Jan. 31 Oct. 31 Jul. 31 Apr. 30
2021
Jan. 31
Assets
Cash and deposits with banks $ 63,861 $ 45,334 $ 48,020 $ 43,350 $ 56,997 $ 50,296 $ 47,197 $ 63,293
Securities 175,879 176,849 172,273 179,003 161,401 157,478 155,122 150,493
Securities borrowed or purchased under
resale agreements 84,539 75,412 79,047 81,071 79,940 76,206 74,679 75,953
Loans
Residential mortgages 269,706 267,727 261,986 257,109 251,526 245,045 234,747 226,594
Personal and credit card 61,908 60,433 59,056 53,801 53,031 52,101 53,004 52,680
Business and government 188,542 179,577 172,475 164,697 150,213 144,130 136,567 134,863
Allowance for credit losses (3,073) (2,823) (2,823) (2,838) (2,849) (2,926) (3,200) (3,484)
Derivative instruments 43,035 36,284 46,665 33,066 35,912 34,360 35,313 34,165
Customers’ liability under acceptances 11,574 11,681 11,736 10,618 10,958 10,817 11,002 10,322
Other assets 47,626 46,316 45,713 41,787 40,554 38,560 38,447 38,029
$ 943,597 $ 896,790 $ 894,148 $ 861,664 $ 837,683 $ 806,067 $ 782,878 $ 782,908
Liabilities and equity
Deposits
Personal $ 232,095 $ 228,909 $ 225,229 $ 220,082 $ 213,932 $ 210,683 $ 207,028 $ 206,090
Business and government 397,188 378,363 368,969 362,362 344,388 332,974 313,201 310,445
Bank 22,523 23,271 22,495 19,794 20,246 18,708 17,140 18,666
Secured borrowings 45,766 47,914 48,794 47,470 42,592 40,604 39,194 38,726
Derivative instruments 52,340 39,439 45,054 29,236 32,101 29,291 34,121 32,158
Acceptances 11,586 11,685 11,767 10,656 10,961 10,879 11,071 10,380
Obligations related to securities lent or sold
short or under repurchase agreements 97,308 87,170 88,901 93,980 97,133 90,059 89,594 97,743
Other liabilities 28,117 24,856 28,701 25,261 24,961 22,931 23,196 22,078
Subordinated indebtedness 6,292 6,359 6,291 5,531 5,539 5,653 5,653 4,693
Equity 50,382 48,824 47,947 47,292 45,830 44,285 42,680 41,929
$ 943,597 $ 896,790 $ 894,148 $ 861,664 $ 837,683 $ 806,067 $ 782,878 $ 782,908
194 CIBC 2022 ANNUAL REPORT

Select financial measures
Unaudited, as at or for the three months ended Oct. 31 Jul. 31 Apr. 30
2022
Jan. 31 Oct. 31 Jul. 31 Apr. 30
2021
Jan. 31
Return on common shareholders’ equity 10.1 % 14.6 % 14.0 % 17.4 % 13.4 % 17.1 % 17.1 % 17.0 %
Return on average assets
(1)
0.50 % 0.73 % 0.71 % 0.85 % 0.68 % 0.85 % 0.85 % 0.81 %
Average common shareholders’
equity ($ millions)
(1)
$ 44,770 $ 43,875 $ 43,155 $ 41,610 $ 40,984 $ 39,263 $ 38,189 $ 37,067
Average assets ($ millions)
(1)
$ 947,830 $ 899,963 $ 881,909 $ 870,553 $ 835,931 $ 806,768 $ 795,373 $ 799,948
Average assets to average common equity
(1)
21.2 20.5 20.4 20.9 20.4 20.5 20.8 21.6
Capital and leverage
(2)
CET1 ratio 11.7 % 11.8 % 11.7 % 12.2 % 12.4 % 12.3 % 12.4 % 12.3 %
Tier 1 capital ratio 13.3 % 13.2 % 13.2 % 13.8 % 14.1 % 13.7 % 13.9 % 13.8 %
Total capital ratio 15.3 % 15.3 % 15.3 % 15.7 % 16.2 % 16.0 % 16.2 % 15.8 %
Leverage ratio 4.4 % 4.3 % 4.2 % 4.3 % 4.7 % 4.6 % 4.7 % 4.7 %
Net interest margin 1.33 % 1.43 % 1.44 % 1.43 % 1.41 % 1.42 % 1.42 % 1.41 %
Net interest margin on average
interest-earning assets 1.51 %
1.61 % 1.61 % 1.60 % 1.58 % 1.60 % 1.59 % 1.58 %
Operating leverage (4.7)% 1.1 % (4.0)% (0.1)% 1.7 % (0.6)% 5.8 % 13.3 %
Efficiency ratio 64.6 % 57.1 % 57.9 % 55.0 % 61.9 % 57.7 % 55.9 % 54.9 %
(1) Average balances are calculated as a weighted average of daily closing balances.
(2) RWA and our capital ratios are calculated pursuant to OSFI’s CAR Guideline, the leverage ratio is calculated pursuant to OSFI’s Leverage Requirements Guideline, and
LCR and NSFR are calculated pursuant to OSFI’s LAR Guideline, all of which are based on BCBS standards. For additional information, see the “Capital management” and
“Liquidity risk” sections of the MD&A.
Common share information
Unaudited, as at or for the three months ended Oct. 31 Jul. 31 Apr. 30
2022
Jan. 31 Oct. 31 Jul. 31 Apr. 30
2021
Jan. 31
Weighted-average basic shares
outstanding (thousands)
(1)
905,120 903,742 902,489 901,870 900,937 899,180 896,910 894,563
Per share
(1)
– basic earnings $ 1.26 $ 1.79 $ 1.63 $ 2.02 $ 1.54 $ 1.88 $ 1.78 $ 1.78
– diluted earnings 1.26 1.78 1.62 2.01 1.54 1.88 1.78 1.78
– dividends 0.830 0.830 0.805 0.805 0.730 0.730 0.730 0.730
– book value
(2)
49.95 48.97 48.09 47.43 45.83 45.03 43.35 42.62
Closing share price
(1)(3)
61.87 64.78 71.01 79.81 75.09 72.54 63.89 54.49
Dividend payout ratio 65.9 % 46.4 % 49.4 % 39.8 % 47.3 % 38.7 % 41.0 % 41.1 %
(1) On April 7, 2022, CIBC shareholders approved a two-for-one share split (Share Split) of CIBC’s issued and outstanding common shares. Each shareholder of record at the
close of business on May 6, 2022 (Record Date) received one additional share on May 13, 2022 (Payment Date) for every one share held on the Record Date. All common
share numbers and per common share amounts have been adjusted to reflect the Share Split as if it was retroactively applied to all periods presented. The dividend per
share amounts include the impact of rounding.
(2) Common shareholders’ equity divided by the number of common shares issued and outstanding at end of period.
(3) The high and low price during the period, and closing price on the last trading day of the period, on the TSX.
CIBC 2022 ANNUAL REPORT 195

Ten-year statistical review
Condensed consolidated statement of income
Unaudited,
$ millions, for the year ended October 31
2022 2021 2020 2019 2018 2017 2016 2015 2014 2013
Net interest income $ 12,641 $ 11,459 $ 11,044 $ 10,551 $ 10,065 $ 8,977 $ 8,366 $ 7,915 $ 7,459 $ 7,453
Non-interest income 9,192 8,556 7,697 8,060 7,769 7,303 6,669 5,941 5,904 5,252
Total revenue 21,833 20,015 18,741 18,611 17,834 16,280 15,035 13,856 13,363 12,705
Provision for credit losses 1,057 158 2,489 1,286 870 829 1,051 771 937 1,121
Non-interest expenses 12,803 11,535 11,362 10,856 10,258 9,571 8,971 8,861 8,512 7,608
Income before income taxes 7,973 8,322 4,890 6,469 6,706 5,880 5,013 4,224 3,914 3,976
Income taxes 1,730 1,876 1,098 1,348 1,422 1,162 718 634 699 626
Net income $ 6,243 $ 6,446 $ 3,792 $ 5,121 $ 5,284 $ 4,718 $ 4,295 $ 3,590 $ 3,215 $ 3,350
Net income (loss) attributable to
non-controlling interests $ 23 $ 17 $ 2 $ 25 $ 17 $ 19 $ 20 $ 14 $ (3) $ (2)
Preferred shareholders and other
equity instrument holders 171 158 122 111 89 52 38 45 87 99
Common shareholders 6,049 6,271 3,668 4,985 5,178 4,647 4,237 3,531 3,131 3,253
Net income attributable
to equity shareholders $ 6,220 $ 6,429 $ 3,790 $ 5,096 $ 5,267 $ 4,699 $ 4,275 $ 3,576 $ 3,218 $ 3,352
196 CIBC 2022 ANNUAL REPORT
Condensed consolidated balance sheet
Unaudited, $ millions, as at October 31 2022 2021 2020 2019 2018 2017 2016 2015 2014 2013
Assets
Cash and deposits with banks $ 63,861 $ 56,997 $ 62,518 $ 17,359 $ 17,691 $ 14,152 $ 14,165 $ 18,637 $ 13,547 $ 6,379
Securities 175,879 161,401 149,046 121,310 101,664 93,419 87,423 74,982 59,542 71,984
Securities borrowed or purchased
under resale agreements 84,539 79,940 74,142 59,775 48,938 45,418 33,810 33,334 36,796 28,728
Loans
Residential mortgages 269,706 251,526 221,165 208,652 207,749 207,271 187,298 169,258 157,526 150,938
Personal and credit card 61,908 53,031 53,611 56,406 55,731 53,315 50,373 48,321 47,087 49,213
Business and government 188,542 150,213 135,546 125,798 109,555 97,766 71,437 65,276 56,075 48,207
Allowance for credit losses (3,073) (2,849) (3,540) (1,915) (1,639) (1,618) (1,691) (1,670) (1,660) (1,698)
Derivative instruments 43,035 35,912 32,730 23,895 21,431 24,342 27,762 26,342 20,680 19,947
Customers’ liability under
acceptances 11,574 10,958 9,606 9,167 10,265 8,824 12,364 9,796 9,212 9,720
Other assets 47,626 40,554 34,727 31,157 25,714 22,375 18,416 19,033 16,098 14,588
$ 943,597 $ 837,683 $ 769,551 $ 651,604 $ 597,099 $ 565,264 $ 501,357 $ 463,309 $ 414,903 $ 398,006
Liabilities and equity
Deposits
Personal $ 232,095 $ 213,932 $ 202,152 $ 178,091 $ 163,879 $ 159,327 $ 148,081 $ 137,378 $ 130,085 $ 125,034
Business and government 397,188 344,388 311,426 257,502 240,149 225,622 190,240 178,850 148,793 134,736
Bank 22,523 20,246 17,011 11,224 14,380 13,789 17,842 10,785 7,732 5,592
Secured borrowings 45,766 42,592 40,151 38,895 42,607 40,968 39,484 39,644 38,783 49,802
Derivative instruments 52,340 32,101 30,508 25,113 20,973 23,271 28,807 29,057 21,841 19,724
Acceptances 11,586 10,961 9,649 9,188 10,296 8,828 12,395 9,796 9,212 9,721
Obligations related to securities
lent or sold short or under
repurchase agreements 97,308 97,133 89,440 69,258 47,353 43,708 24,550 20,149 23,764 20,313
Other liabilities 28,117 24,961 22,167 19,069 18,266 15,305 12,919 12,223 10,932 10,862
Subordinated indebtedness 6,292 5,539 5,712 4,684 4,080 3,209 3,366 3,874 4,978 4,228
Non-controlling interests 201 182 181 186 173 202 201 193 164 175
Shareholders’ equity 50,181 45,648 41,154 38,394 34,943 31,035 23,472 21,360 18,619 17,819
$ 943,597 $ 837,683 $ 769,551 $ 651,604 $ 597,099 $ 565,264 $ 501,357 $ 463,309 $ 414,903 $ 398,006

Select financial measures
Unaudited,
as at or for the year ended October 31 2022 2021 2020 2019 2018 2017 2016 2015 2014 2013
Return on equity 14.0 % 16.1 % 10.0 % 14.5 % 16.6 % 18.3 % 19.9 % 18.7 % 18.3 % 21.4 %
Return on average assets
(1)
0.69 % 0.80 % 0.52 % 0.80 % 0.88 % 0.87 % 0.84 % 0.79 % 0.78 % 0.83 %
Average common shareholders’
equity ($ millions)
(1)
$ 43,354 $ 38,881 $ 36,792 $ 34,467 $ 31,184 $ 25,393 $ 21,275 $ 18,857 $ 17,067 $ 15,167
Average assets ($ millions)
(1)
$ 900,213 $ 809,621 $ 735,492 $ 639,716 $ 598,441 $ 542,365 $ 509,140 $ 455,324 $ 411,481 $ 403,546
Average assets to average
common equity
(1)
20.8 20.8 20.0 18.6 19.2 21.4 23.9 24.1 24.1 26.6
Capital and leverage – Basel III
CET1 ratio
(2)
11.7 % 12.4 % 12.1 % 11.6 % 11.4 % 10.6 % 11.3 % 10.8 % 10.3 % 9.4 %
Tier 1 capital ratio 13.3 % 14.1 % 13.6 % 12.9 % 12.9 % 12.1 % 12.8 % 12.5 % 12.2 % 11.6 %
Total capital ratio 15.3 % 16.2 % 16.1 % 15.0 % 14.9 % 13.8 % 14.8 % 15.0 % 15.5 % 14.6 %
Leverage ratio 4.4 % 4.7 % 4.7 % 4.3 % 4.3 % 4.0 % 4.0 % 3.9 % n/a n/a
Net interest margin 1.40 % 1.42 % 1.50 % 1.65 % 1.68 % 1.66 % 1.64 % 1.74 % 1.81 % 1.85 %
Net interest margin on average
interest-earning assets 1.58 % 1.59 % 1.69 % 1.84 % 1.88 % 1.85 % 1.88 % 2.00 % 2.05 % 2.12 %
Operating leverage (1.9)% 5.3 % (4.0)% (1.5)% 2.4 % 1.6 % 7.3 % (0.4)% (6.7)% (3.9)%
Efficiency ratio 58.6 % 57.6 % 60.6 % 58.3 % 57.5 % 58.8 % 59.7 % 63.9 % 63.7 % 59.9 %
(1) Average balances are calculated as a weighted average of daily closing balances.
(2) RWA and our capital ratios are calculated pursuant to OSFI’s CAR Guideline, the leverage ratio is calculated pursuant to OSFI’s Leverage Requirements Guideline, and
LCR and NSFR are calculated pursuant to OSFI’s LAR Guideline, all of which are based on BCBS standards. For additional information, see the “Capital management” and
“Liquidity risk” sections of the MD&A.
Condensed consolidated statement of changes in equity
Unaudited,
$ millions, for the year ended October 31 2022 2021 2020 2019 2018 2017 2016 2015 2014 2013
Balance at beginning of year $ 45,830 $ 41,335 $ 38,580 $ 35,116 $ 31,237 $ 23,673 $ 21,553 $ 18,783 $ 17,994 $ 16,367
Adjustment for change in
accounting policy – – 148
(1)
6
(2)
(91)
(3)
– – – –
(4)
7
(5)
Premium on purchase of
common shares (105) – (166) (79) (313) – (209) (9) (250) (422)
Changes in share capital
Preferred and other equity
instruments
598 750 750 575 453 797 – (31) (675) –
Common 375 443 317 348 695 4,522 213 31 29 (16)
Changes in contributed surplus 5 (7) (8) (11) (1) 65 (4) 1 (7) (3)
Changes in OCI 570 (339) 647 122 317 (338) (248) 933 145 325
Net income 6,220 6,429 3,790 5,096 5,267 4,699 4,275 3,576 3,218 3,352
Dividends and distributions
Preferred and other equity
instruments
(171) (158) (122) (111) (89) (52) (38) (45) (87) (99)
Common (2,954) (2,622) (2,592) (2,488) (2,356) (2,121) (1,879) (1,708) (1,567) (1,523)
Non-controlling interests 19 1 (5) 13 (25) 1 8 29 (11) 5
Other (5) (2) (4) (7) 22 (9) 2 (7) (6) 1
Balance at end of year $ 50,382 $ 45,830 $ 41,335 $ 38,580 $ 35,116 $ 31,237 $ 23,673 $ 21,553 $ 18,783 $ 17,994
(1) Represents the impact of adoption of IFRS 16 “Leases”.
(2) Represents the impact of adoption of IFRS 15 “Revenue from Contracts with Customers”.
(3) Represents the impact of adoption of IFRS 9 “Financial Instruments”.
(4) Represents the impact of adoption of IFRS 10 “Consolidated Financial Statements”.
(5) Represents the impact of adoption of amendments to IAS 19 “Employee Benefits”.
CIBC 2022 ANNUAL REPORT 197

Common share information
Unaudited, as at or for the
year ended October 31
2022 2021 2020 2019 2018 2017 2016 2015 2014 2013
Weighted-average basic
shares outstanding
(thousands)
(1)
903,312 897,906 890,870 888,648 886,163
(2)
825,271 790,778 794,426 795,241 801,760
Per share
(1)
– basic earnings $ 6.70 $ 6.98 $ 4.12 $ 5.61 $ 5.84 $ 5.63 $ 5.36 $ 4.45 $ 3.94 $ 4.06
– diluted earnings 6.68 6.96 4.11 5.60 5.82 5.62 5.35 4.44 3.93 4.05
– dividends 3.270 2.920 2.910 2.800 2.660 2.540 2.375 2.150 1.970 1.900
– book value
(3)
49.95 45.83 42.03 39.94 36.92 33.28 28.30 25.63 44.30 40.36
Closing share price
(1)(4)
61.87 75.09 49.69 56.16 56.84 56.78 50.25 50.14 51.45 44.35
Dividend payout ratio 48.8 % 41.8 % 70.7 % 49.9 % 45.5 % 45.6 % 44.3 % 48.4 % 50.0 % 46.8 %
(1) On April 7, 2022, CIBC shareholders approved a two-for-one share split (Share Split) of CIBC’s issued and outstanding common shares. Each shareholder of record at the
close of business on May 6, 2022 (Record Date) received one additional share on May 13, 2022 (Payment Date) for every one share held on the Record Date. All common
share numbers and per common share amounts have been adjusted to reflect the Share Split as if it was retroactively applied to all periods presented. The dividend per
share amounts include the impact of rounding.
(2) Excludes 4,021,780 common shares (adjusted for the Share Split noted above) which were issued and outstanding but which had not been acquired by a third-party as at
October 31, 2017. These shares were issued as a component of our acquisition of The PrivateBank.
(3) Common shareholders’ equity divided by the number of common shares issued and outstanding at end of year.
(4) The closing price on the last trading day of the year, on the TSX.
Preferred shares and other equity instruments
(1)
Unaudited, for the year ended
October 31
2022 2021 2020 2019 2018 2017 2016 2015 2014 2013
Preferred shares
Class A
Series 26 $– $ – $ – $ – $ – $ – $ – $ – $ 1.4375 $ 1.4375
Series 27 – – – – – – – 0.3500 1.4000 1.4000
Series 29 – – – – – – – 0.6750 1.3500 1.3500
Series 33 – – – – – – – – 1.0031 1.3375
Series 35 – – – – – – – – 0.8125 1.6250
Series 37 – – – – – – – – 1.2188 1.6250
Series 39 0.9283 0.9283 0.9283 0.9633 0.9750 0.9750 0.9750 0.9750 0.3793 –
Series 41 0.9773 0.9773 0.9673 0.9375 0.9375 0.9375 0.9375 0.8203 – –
Series 43 0.7858 0.7858 0.8714 0.9000 0.9000 0.9000 0.9000 0.5764 – –
Series 45
(2)
0.8250 1.1000 1.1000 1.1000 1.1000 0.4551 – – – –
Series 47 1.1250 1.1250 1.1250 1.1250 0.8769 – – – – –
Series 49 1.3000 1.3000 1.3000 0.9990 – – – – – –
Series 51 1.2875 1.2875 1.2875 0.5256 – – – – – –
Other equity instruments
Limited Recourse
Capital Notes
(3)
Series 1 4.375 % 4.375 % 4.375 % – % – % – % – % – % – % – %
Series 2 4.000 % 4.000 % – % – % – % – % – % – % – % – %
Series 3 7.150 % –% –% –% –% –% –% –% –% –%
(1) The dividends and distributions are adjusted for the number of days during the year that the share and other equity instruments are outstanding at the time of issuance and
redemption.
(2) Series 45 preferred shares were redeemed on July 29, 2022.
(3) Represents the annual interest rate percentage applicable to the LRCNs issued as at October 31 for each respective year.
198 CIBC 2022 ANNUAL REPORT

Shareholder information
Fiscal Year
November 1st to October 31st
Key Dates
Reporting dates 2023
First quarter results – Friday, February 24, 2023
Second quarter results – Thursday, May 25, 2023
Third quarter results – Thursday, August 31, 2023
Fourth quarter results – Thursday, November 30, 2023
Annual Meeting of Shareholders 2023
CIBC’s Annual Meeting of Shareholders will be held on April 4, 2023. For more details, please visit our Annual Meeting webpage at
https://www.cibc.com/en/about-cibc/investor-relations/annual-meeting.html.
Common shares of CIBC (CM) are listed on the Toronto Stock Exchange and the New York Stock Exchange. Preferred
shares are listed on the Toronto Stock Exchange.
Dividends
Quarterly dividends were paid on CIBC common and preferred shares in 2022:
Common shares
(1)
Record date Payment date Dividends per share
Number of common shares
on record date
Sep 28/22 Oct 28/22 $0.830 905,122,577
Jun 28/22 Jul 28/22 $0.830 903,857,263
Mar 28/22 Apr 28/22 $0.805 902,498,850
Dec 29/21 Jan 28/22 $0.805 901,626,696
Preferred shares
Stock Series 39 Series 41 Series 43 Series 47 Series 49 Series 51 Series 56
Ticker symbol
CM.PR.O CM.PR.P CM.PR.Q CM.PR.S CM.PR.T CM.PR.Y n/a
Quarterly dividend $0.232063 $0.244313 $0.196438 $0.281250 $0.325000 $0.321875 n/a
Semi-annual dividend n/a n/a n/a n/a n/a n/a $36.825000
(1) On April 7, 2022, CIBC shareholders approved a two-for-one share split (Share Split) of CIBC’s issued and outstanding common shares. Each shareholder of record at the
close of business on May 6, 2022 (Record Date) received one additional share on May 13, 2022 (Payment Date) for every one share held on the Record Date. All common
share numbers and per common share amounts have been adjusted to reflect the Share Split as if it was retroactively applied to all periods presented.
2023 dividend payment dates
(Subject to approval by the CIBC Board of Directors)
Record dates Payment dates
December 28, 2022 January 27, 2023
March 28, 2023 April 28, 2023
June 28, 2023 July 28, 2023
September 28, 2023 October 27, 2023
Eligible dividends
CIBC designates any and all dividends paid or deemed for Canadian federal, provincial or territorial income tax purposes to be paid on or after
January 1, 2006 to be “eligible dividends”, unless otherwise indicated in respect of dividends paid subsequent to this notification, and hereby
notifies all recipients of such dividends of this designation.
Regulatory capital
Information on CIBC’s regulatory capital instruments and regulatory capital position may be found at https://www.cibc.com/en/about-cibc/investor-
relations/regulatory-capital-instruments.html.
Credit ratings
Credit rating information can be found on pages 80–81 in this Annual Report.
Shareholder investment plan
All Canadian and U.S. resident registered holders of CIBC common shares and designated Class A preferred shares may participate in one or more
of the following options and pay no brokerage commissions or service charges:
Dividend reinvestment option – Canadian residents may have dividends reinvested in additional CIBC common shares.
Share purchase option – Canadian residents may purchase up to $50,000 of additional CIBC common shares during the fiscal year.
Stock dividend option – U.S. residents may elect to receive stock dividends on CIBC common shares.
Further information is available through TSX Trust Company and on the CIBC website at www.cibc.com.
CIBC 2022 ANNUAL REPORT 199
Transfer agent and registrar
For information relating to shareholdings, shareholder investment plan, dividends, direct dividend deposit, dividend reinvestment accounts and lost
certificates, or to eliminate duplicate mailings of shareholder material, please contact:
TSX Trust Company, P.O. Box 700, Postal Station B, Montreal, QC, H3B 3K3,
416 682-3860 or 1 800 258-0499 (Canada and the U.S. only), fax 1 888 249-6189, Email: shareholderinquiries@tmx .com,
website: www.tsxtrust.com.
Common and preferred shares are transferable in Canada at the offices of our agent, TSX Trust Company, in Toronto, Montreal, Calgary and
Vancouver.
In the U.S., common shares are transferable at:
Computershare Inc., By Mail: P.O. Box 43078 Providence, RI 02940; By Overnight Delivery: 150 Royall St., Canton,
MA 02021, 1 800-522-6645,
website: www.computershare.com/investor.
Registered shareholders can opt to have their shares recorded electronically in the Direct Registration System (DRS). Please contact our transfer
agent for details.
How to reach us:
CIBC Head Office
81 Bay Street, CIBC SQUARE,
Toronto, Ontario, Canada
M5J 0E7
SWIFT code: CIBCCATT
Website: www.cibc.com
Investor Relations
Email:
Corporate Secretary
Email:
Client Complaint Appeals Office
(CCAO)
Toll-free across Canada: 1-888-947-5207
Email:
mailbox.clientcomplaintappeals @cibc.com
CIBC Telephone Banking
Toll-free across Canada: 1 800 465-2422
Communications and Public Affairs
Email:
Client Care
Toll-free across Canada: 1 800 465-2255
Email: [email protected]
Where to find more information
CIBC Annual Report 2022
Additional print copies of the Annual Report will be available in March 2023 and may be obtained by emailing Mailbox.InvestorRe[email protected].
The Annual Report is also available online at www.cibc.com/ca/investor-relations/annual-reports.html.
Des exemplaires supplémentaires du Rapport annuel seront disponibles en mars 2023 et peuvent être commandés par courriel à
[email protected]. Le Rapport annuel est aussi disponible à l’adresse www.cibc.com/ca/investor-relations/annual-reports-fr.html.
CIBC Sustainability Report and Public Accountability Statement 2022
This report reviews our economic, environmental, social and governance activities over the past year and will be available in March 2023 at
https://www.cibc.com/en/about-cibc/corporate-responsibility.html.
Management Proxy Circular 2023
The Management Proxy Circular contains information for shareholders about CIBC’s annual meeting, including information relating to the election of
CIBC’s directors, appointment of auditors and shareholder proposals, as well as other matters. The 2023 Proxy Circular will be available in March
2023 at www.cibc.com.
Corporate Governance
CIBC’s Statement of Corporate Governance Practices describes the governance framework that guides the Board and management in fulfilling their
obligations to CIBC and our shareholders. This statement and other information on Corporate Governance at CIBC, including our CIBC Code of
Conduct for all employees and Directors, can be found on our corporate website at www.cibc.com/ca/inside-cibc/governance/governance-
practices.html.
Regulatory Filings
In Canada with the Canadian Securities Administrators at www.sedar.com.
In the U.S. with the U.S. Securities and Exchange Commission at www.sec.gov/edgar.shtml.
Incorporation
Canadian Imperial Bank of Commerce (CIBC) is a diversified financial institution governed by the Bank Act (Canada). CIBC was formed through the
amalgamation of The Canadian Bank of Commerce and Imperial Bank of Canada in 1961.
The Canadian Bank of Commerce was originally incorporated as Bank of Canada by special act of the legislature of the Province of Canada in
1858. Subsequently, the name was changed to The Canadian Bank of Commerce and it opened for business under that name in 1867. Imperial
Bank of Canada was incorporated in 1875 by special act of the Parliament of Canada and commenced operations in that year.
Trademarks
Trademarks used in this Annual Report which are owned by Canadian Imperial Bank of Commerce, or its subsidiaries in Canada and/or other
countries include, “Ambitions Made Real”, “CIBC Agility”, “CIBC Bank USA Smart Account”, the CIBC logo, “CIBC eAdvantage”, “CIBC
FirstCaribbean International Bank”, “CIBC ForeignCash Online”, “CIBC Global Money Transfer”, “CIBC GoalPlanner”, “CIBC Investor’s Edge”, “CIBC
Miracle Day”, “CIBC Mobile Banking”, “CIBC Private Wealth”, “CIBC Smart”, “CIBC Smart Planner”, “CIBC SmartBanking”, “Simplii Financial” and
“Wood Gundy”. All other trademarks mentioned in this annual report which are not owned by Canadian Imperial Bank of Commerce or its
subsidiaries, are the property of their respective owners.
200 CIBC 2022 ANNUAL REPORT
Board of Directors:
Katharine B. Stevenson
Chair of the Board
CIBC
Corporate Director
Toronto, Ontario, Canada
Joined in 2011
Michelle L. Collins
(AC)
President
Cambium LLC
Chicago, Illinois, U.S.A.
Joined in 2017
Christine E. Larsen
(RMC)
Corporate Director
Montclair, New Jersey, U.S.A.
Joined in 2016
Jane L. Peverett
(AC, CGC – Chair)
Corporate Director
West Vancouver, British Columbia,
Canada
Joined in 2009
Ammar Aljoundi
(RMC)
President and Chief Executive Officer
Agnico Eagle Mines Limited
Toronto, Ontario, Canada
Joined in 2022
Luc Desjardins
(MRCC)
President and Chief Executive Officer
Superior Plus Corp.
Toronto, Ontario, Canada
Joined in 2009
Nicholas D. Le Pan
(AC, CGC)
Corporate Director
Ottawa, Ontario, Canada
Joined in 2008
Martine Turcotte
(CGC, MRCC)
Corporate Director
Verdun, Québec, Canada
Joined in 2014
Charles J. G. Brindamour
(RMC)
Chief Executive Officer
Intact Financial Corporation
Toronto, Ontario, Canada
Joined in 2020
Victor G. Dodig
President and Chief Executive Officer
CIBC
Toronto, Ontario, Canada
Joined in 2014
Mary Lou Maher
(AC – Chair)
Corporate Director
Toronto, Ontario, Canada
Joined in 2021
Barry L. Zubrow
(CGC, RMC – Chair)
Chief Executive Officer
ITB LLC
West Palm Beach, Florida, U.S.A.
Joined in 2015
Nanci E. Caldwell
(CGC, MRCC)
Corporate Director
Woodside, California, U.S.A.
Joined in 2015
Kevin J. Kelly
(MRCC – Chair)
Corporate Director
Toronto, Ontario, Canada
Joined in 2013
William F. Morneau
Corporate Director
Toronto, Ontario, Canada
Joined in 2022
AC – Audit Committee
CGC – Corporate Governance Committee
MRCC – Management Resources and Compensation Committee
RMC – Risk Management Committee
CIBC 2022 ANNUAL REPORT 201

