
The Long Term Care Community Coalition
209 West 29
th
Street, Suite 6252, New York, NY 10001
www.nursinghome411.org
©2021 The Long Term Care Community Coalition
A digital version of this report is available at
nursinghome411.org/survey-enforcement.
Broken Promises
An assessment of federal data on nursing home oversight
and the impact of lax enforcement on residents and families.

Broken Promises: An Assessment of Federal Data on Nursing Home Oversight
Table of Contents
I. Introduction ............................................................................................................................. 4
HOW TO READ THIS REPORT ............................................................................................................................................. 4
BACKGROUND: THE GOVERNMENT’S BROKEN PROMISES ...................................................................................................... 4
CMS REGIONAL OFFICES/LOCATIONS ................................................................................................................................ 7
METHODOLOGY, METRICS, & TERMINOLOGY ...................................................................................................................... 9
Survey Sample ...................................................................................................................................................... 9
Annual Citation Rates ........................................................................................................................................... 9
Antipsychotic Drugging and Pressure Ulcers ........................................................................................................ 9
LIMITATIONS ............................................................................................................................................................... 11
II. Data and Analysis .................................................................................................................. 12
OVERALL CITATIONS ..................................................................................................................................................... 12
Introduction ........................................................................................................................................................ 12
Key Findings ....................................................................................................................................................... 12
State Findings ..................................................................................................................................................... 13
Regional Findings ............................................................................................................................................... 13
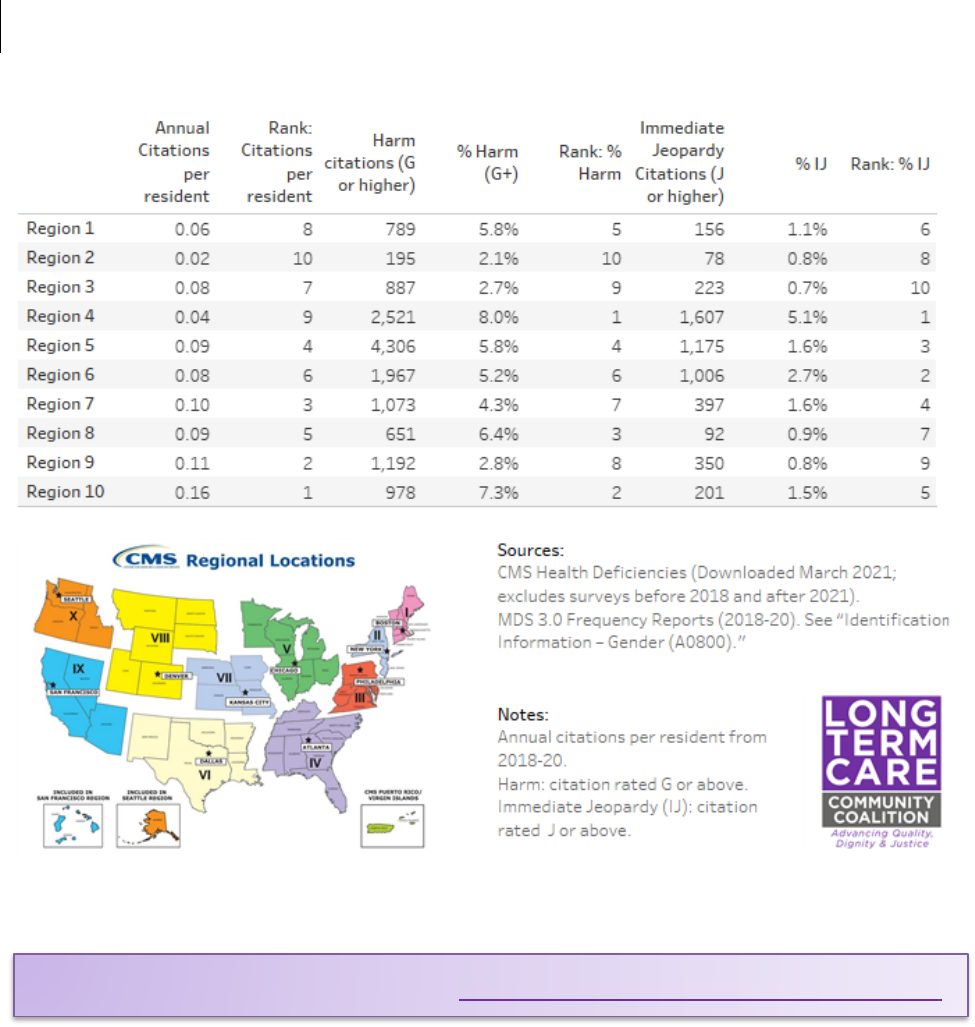
Data: Map and Tables ........................................................................................................................................ 14
ANTIPSYCHOTIC DRUGGING ........................................................................................................................................... 17
Introduction ........................................................................................................................................................ 17
Key Findings ....................................................................................................................................................... 18
Data: Maps and Tables ...................................................................................................................................... 19
INFECTION CONTROL .................................................................................................................................................... 22
Introduction ........................................................................................................................................................ 22
Key Findings ....................................................................................................................................................... 23
Data: Map and Tables ........................................................................................................................................ 24
PRESSURE ULCERS ........................................................................................................................................................ 27
Introduction ........................................................................................................................................................ 27
Key Findings ....................................................................................................................................................... 27
Data: Map and Tables ........................................................................................................................................ 28
QUALITY OF LIFE .......................................................................................................................................................... 31
Introduction ........................................................................................................................................................ 31
Key Findings ....................................................................................................................................................... 32
Data: Map and Tables ........................................................................................................................................ 33
RESIDENT RIGHTS ........................................................................................................................................................ 36
Introduction ........................................................................................................................................................ 36
Key Findings ....................................................................................................................................................... 37
Data: Map and Tables ........................................................................................................................................ 38
STAFFING ................................................................................................................................................................... 41
Introduction ........................................................................................................................................................ 41
Key Findings ....................................................................................................................................................... 42
Data: Map and Tables ........................................................................................................................................ 43
FINES......................................................................................................................................................................... 46
Introduction ........................................................................................................................................................ 46
Key Findings ....................................................................................................................................................... 46
Data: Map and Tables ........................................................................................................................................ 47
III. Discussion & Recommendations ........................................................................................... 50
DISCUSSION: A FAILURE TO ENFORCE .............................................................................................................................. 50
RECOMMENDATIONS: ................................................................................................................................................... 51

Long Term Care Community Coalition
3
IV. Appendix ................................................................................................................................ 54
SCOPE & SEVERITY GRID ............................................................................................................................................... 54
HEALTH DEFICIENCIES (2018-20)................................................................................................................................... 54
PAYROLL-BASED JOURNAL (PBJ) DATA (Q4 2019) ........................................................................................................... 55
MDS FREQUENCY REPORTS ........................................................................................................................................... 55
PENALTIES .................................................................................................................................................................. 55
F-TAG LIST ................................................................................................................................................................. 55
This report includes maps and tables developed using Tableau, a data
visualization software. For a more interactive and user-friendly experience,
we recommend viewing the online version of this report at
nursinghome411.org/survey-enforcement.
Visit www.nursinghome411.org for free resources including
fact sheets, webinars, staffing data, facility ratings, and more!
Questions? Contact us at [email protected].
This report was researched and written with the generous
support of The New York Community Trust.

Broken Promises: An Assessment of Federal Data on Nursing Home Oversight
I. Introduction
How to read this report
Part I (this introduction) provides critical background information on nursing home
enforcement and context for the data presented in this report and our findings. It also provides
useful information on the components of the research, including methodology, sources, and
the role of the CMS Regional Offices.
Part II (Data and Analysis) is the main section of this report, presenting data on and insights into
nursing home enforcement. It covers several key topics which we believe are both important
and useful in assessing the effectiveness of government efforts to ensure that nursing homes
are held accountable for providing good care, including Overall Citations, Antipsychotics,
Infection Control, Pressure Ulcers, Quality of Life, Resident Rights, Staffing, and Fines. Each
category includes:
• An introduction,
• Key findings,
• A map depicting rates of (1) state enforcement, (2) states’ identification of harm or immediate
jeopardy, (3) U.S. totals and averages,
• A table with state data, and
• A table with regional data.
Part III (Discussion & Recommendations) contains a discussion of our findings on oversight and
enforcement at the state, regional, and federal levels and how these data can inform public
policy moving forward. Further, it offers seven recommendations for CMS to ensure that State
Agencies – and the Regional Offices charged with overseeing them – fulfil their shared mission
to protect residents.
Part IV (Appendix) provides references and sources with links to original datasets.
Background: The Government’s Broken Promises
U.S. nursing homes provide care, support services, and housing to over one million people
every day and millions of people each year. In addition to those individuals, their families and
loved ones have a substantial personal stake in the quality of care and quality of life nursing
homes provide. With the advent of the aging “Baby Boomer” generations, these numbers will
undoubtedly rise. As reported in U.S. News and World Report, “[s]omeone turning age 65 today
has almost a 70% chance of needing some type of long-term care, and 20% of people will need
it for longer than five years.”
1
1
Levine, David and Esposito, Lisa, U.S. News and World Report, “How to Pay For Nursing Home Costs” (October 15,
2021), citing LongTermCare.gov. Available at http://health.usnews.com/health-news/best-nursing-
homes/articles/2013/02/26/how-to-pay-for-nursing-home-costs.

Long Term Care Community Coalition
5
While many of us have – or will have – a personal stake in nursing home care, all of us will share
a financial stake. Spending on care in U.S. nursing homes and continuing care retirement
communities totaled $168.5 billion in 2018.
2
The average rate for nursing home care in the U.S.
is now over $250 per day.
3
The large share of these costs is paid by taxpayers through the
Medicaid and Medicare programs.
Despite the significant need for both long-term and short-term nursing home care – and the
billions of dollars we invest every year – significant problems in resident care, quality of life, and
dignity are pervasive across the country. Our laws and regulatory standards are strong,
providing that each resident be treated with dignity and receive the care and services that
they need to attain, and maintain, their highest practicable physical, emotional, and social
well-being. The fact that this level of care is the exception, rather than the rule, is a result of
the failure (in fact multiple failures, every day) to adequately enforce those standards and
protections.
In short, nursing homes too often have inadequate
care staff and fail to provide appropriate care with
dignity because nothing is stopping them from doing
otherwise. As the data in this report indicate, the
government is breaking its promise to ensure that
residents are safe and treated with dignity. There is
often little or no punishment when nursing homes fail
to provide care that meets the standards they are paid
to achieve, even when such failures result in significant resident suffering or avoidable death.
The systemic acceptance of subpar care does not only perpetuate resident neglect and abuse;
it has a significant financial cost. As noted above, taxpayers pay for the majority of nursing
home care. We count on the federal Centers for Medicare and Medicaid Services (CMS) and the
State Survey Agencies (SAs) to assure that public monies are spent appropriately. When care is
poor it means we are not getting good value for the money we spend. And when that poor care
results in the need for additional care, whether it be medication to fight an unnecessary
infection or hospitalization due to a medication error, the public foots the bill for that, too.
This report builds on LTCCC’s 2015 study, “Safeguarding NH Residents & Program Integrity: A
National Review of State Survey Agency Performance,”
4
which reviewed nursing home quality
2
National Center for Health Statistics, National health expenditures, average annual percent change, and percent
distribution, by type of expenditure: United States, selected years 1960–2018 (data compiled from various sources
by the Centers for Medicare & Medicaid Services). https://www.cdc.gov/nchs/fastats/health-expenditures.htm
Note: CMS does not provide separate data for nursing homes and continuing care retirement communities.
3
Genworth, 2020 Cost of Care Survey. https://www.genworth.com/corporate/about-genworth/industry-
expertise/cost-of-care.html
4
https://nursinghome411.org/national-report-safeguarding-nh-residents-program-integrity-a-national-review-of-
state-survey-agency-performance/.
As the data in this report
indicate, the government is
breaking its promise to ensure
that residents are safe and
treated with dignity.

Broken Promises: An Assessment of Federal Data on Nursing Home Oversight
assurance indicators based on a resident-centered approach. Though oversight is typically
assessed on a facility basis, the 2015 study and this report assess enforcement rates adjusted for a
state’s nursing home resident population. In our view this is critical, since the purpose of nursing
home standards is to ensure that residents, as individuals, receive care that complies with
professional standards and are treated with dignity.
This report presents the results of an analysis of survey and enforcement data at the state,
regional, and federal levels with a focus on all U.S. states and the 10 Regional Offices of the
federal Centers for Medicare and Medicaid Services (CMS) tasked with overseeing the
performance of the state enforcement agencies in their respective regions of the country. To
assess performance in enforcement, we assessed the surveyor citation rate and citation
severity in seven critical areas of nursing home care based on surveys (inspections) over the
most recent three-year period (2018-20). These areas are:
• Overall Citations
• Antipsychotic Drugging,
• Infection Control,
• Pressure Ulcers,
• Quality of Life,
• Resident Rights, and
• Sufficient Staffing.
For each area of nursing home care, we provide key enforcement performance metrics
including citation rates (how often a state/region cited its nursing homes, adjusted for resident
population) and percent of G+ citations (the proportion of citations categorized as having
caused any resident harm or immediate jeopardy). Individual care categories (excluding Overall
Citations) also include examples of so-called "no harm” deficiencies (citations categorized as A
through F).
5
,
6
Note: Federal Fines (average dollar amount and frequency, adjusted for resident population) are
also assessed in this report.
States and regions are ranked in each enforcement performance metric (most
frequent/severe citation rates and penalties ranking first; least frequent/severe ranking last).
Wherever possible, we provide color-coded maps that illustrate state and regional disparities in
enforcement performance.
The wide range of enforcement data provided in this report can be used to identify strengths
and weaknesses among states in respect to their ability to ensure nursing home safety
5
Most “no harm” examples obtained from The Elder Justice “No Harm” Newsletter at
https://nursinghome411.org/news-reports/elder-justice/. The example provided in Quality of Life is available at
https://nursinghome411.org/wp-content/uploads/2021/10/QOL-F675-Pico-Rivera.pdf.
6
See the Appendix for the Scope & Severity Grid which surveyors used to rank deficiencies.

Long Term Care Community Coalition
7
standards are realized for their residents. Additionally, it can be used to gain insights into regional
trends based on performance among the 10 CMS Regional Offices covering the country. Lastly,
the federal data can be used to provide context for state and regional data, and in most cases,
demonstrate the universality of U.S. nursing home enforcement performance trends.
CMS Regional Offices/Locations
CMS’s Regional Offices are responsible for overseeing the enforcement agencies of the states
within their region of the country. The 10 regional offices are located in Boston, New York,
Philadelphia, Atlanta, Dallas, Kansas City, Chicago, Denver, San Francisco, and Seattle. More
information on each CMS Region and its nursing home demographics (based on MDS Reports)
7
are listed in the map and table below. Note: CMS has renamed the Regional Offices as
“Locations.” However (as of October 2021), the term “Regional Office” still appears on the CMS
website. For this reason, and because it is more descriptive, this report uses “Regional Office.”
7
MDS 3.0 Frequency Reports (Q4 2019) available at https://www.cms.gov/Research-Statistics-Data-and-
Systems/Computer-Data-and-Systems/Minimum-Data-Set-3-0-Public-Reports/Minimum-Data-Set-3-0-Frequency-
Report.
Figure 1: Map of CMS Regional Locations.

Broken Promises: An Assessment of Federal Data on Nursing Home Oversight
CMS
Region
Regional
Office
Location
States
Resident
Population
(Avg.
2018-20)
% Non-
White
% 85+
%
Male
1
Boston
Connecticut, Maine, Massachusetts,
New Hampshire, Rhode Island,
Vermont
81,394
14.6%
42.3%
35.2%
2
New York
New Jersey, New York, Puerto Rico,
Virgin Islands
147,034
35.5%
38.1%
38.6%
3
Philadelphia
Delaware, District of Columbia,
Maryland, Pennsylvania, Virginia,
West Virginia
142,490
24.2%
37.7%
36.0%
4
Atlanta
Alabama, Florida, Georgia, Kentucky,
Mississippi, North Carolina, South
Carolina, Tennessee
249,017
29.7%
32.8%
36.3%
5
Chicago
Illinois, Indiana, Michigan,
Minnesota, Ohio, Wisconsin
260,895
20.3%
35.5%
37.5%
6
Dallas
Arkansas, Louisiana, New Mexico,
Oklahoma, Texas
158,662
33.3%
31.9%
37.3%
7
Kansas City
Iowa, Kansas, Missouri, Nebraska
87,815
11.5%
40.1%
35.5%
8
Denver
Colorado, Montana, North Dakota,
South Dakota, Utah, Wyoming
39,270
16.5%
38.3%
38.8%
9
San
Francisco
Arizona, California, Hawaii, Nevada,
Pacific Territories
124,822
45.4%
30.3%
43.0%
10
Seattle
Alaska, Idaho, Oregon, Washington
27,943
15.8%
30.1%
41.0%

Long Term Care Community Coalition
9
Methodology, Metrics, & Terminology
Survey Sample
This report explored citations from surveys conducted from 2018 to 2020. A total of 290,289
citations were recorded for surveys conducted during this three-year period.
8
See Appendix -
Health Deficiencies (2018-20) for more on citations data.
Federal rules require that the state survey agencies conduct a standard survey of their state’s
nursing homes, evaluating compliance with minimum standards, on average of once every 12
months (with a window of 9-15 months for an individual facility’s inspection). Though the
COVID-19 pandemic led to restrictions on state survey agency activities during 2020, we
determined to include citations for this year to provide the most up-to-date data and gain
insights into variations in enforcement during this period.
Annual Citation Rates
Annual citation rates for most categories (Overall Citations, Infection Control, Quality of Life,
Resident Rights, and Sufficient Staffing) were calculated per total resident population (based
on MDS 3.0 Frequency Reports from 2018-20).
9
Some citations were scaled to per 100, per
1,000, or per 10,000 residents.
Annual citation rates were determined by dividing the three-year rate by three.
Antipsychotic Drugging and Pressure Ulcers
Citation rates for Inappropriate Antipsychotic Drugging and Substandard Pressure Ulcer Care
were calculated by dividing the number of AP and PU citations, respectively, by the number of
residents receiving antipsychotics (RAP) and the number of residents diagnosed with unhealed
pressure ulcers (RPU) during the fourth quarter of 2019, based on MDS data.
10
These metrics
are referred to as RAP Citation Rate and RPU Citation Rate. This methodology was chosen to
reflect the specific information we have on reported residents receiving antipsychotics and
those with identified (and reported) pressure ulcers. The fourth quarter of 2019 was selected
because it is the most recent full quarter prior to the COVID-19 pandemic.
8
Citation data based on CMS’s Health Deficiencies which include health citations from surveys conducted in the
three-year period from 2018 to 2020. Downloaded March 2021. Most recent dataset available at:
https://data.cms.gov/provider-data/dataset/r5ix-sfxw.
9
Average residents in 12 quarterly MDS 3.0 Frequency Reports (“A0800: Identification Information – Gender) from
2018-20. Available at https://www.cms.gov/Research-Statistics-Data-and-Systems/Computer-Data-and-
Systems/Minimum-Data-Set-3-0-Public-Reports/Minimum-Data-Set-3-0-Frequency-Report.
10
MDS 3.0 Frequency Reports (Q4 2019) for antipsychotics (N0410A: Medications - Medications Received –
Antipsychotics) and pressure ulcers (M0210: Skin Conditions - Unhealed Pressure Ulcers). Available at
https://www.cms.gov/Research-Statistics-Data-and-Systems/Computer-Data-and-Systems/Minimum-Data-Set-3-
0-Public-Reports/Minimum-Data-Set-3-0-Frequency-Report.

Broken Promises: An Assessment of Federal Data on Nursing Home Oversight
Antipsychotic Drugging Acronyms
AP = Antipsychotic drug
RAP = Number of residents receiving antipsychotics
RAP % = Percentage of total residents receiving
antipsychotics
AP Citation Rate = Number of AP citations per total
resident population
RAP Citation Rate = Number of antipsychotic drugging citations per 1k residents receiving
antipsychotics
Pressure Ulcer Acronyms
PU = Pressure Ulcers
RPU = Number of residents with a reported pressure ulcer
RPU % = Percentage of total residents with reported
pressure ulcers
PU Citation Rate = Number of PU citations per total
resident population
RPU Citation Rate = Number of PU citations per 100
residents with reported pressure ulcers
“Harm” and “Immediate Jeopardy”
CMS categorizes deficiencies into four levels of severity based on letters A through L.
Level 1: No actual harm with potential for minimal harm (A, B, C).
Level 2: No actual harm with potential for more than minimal harm that is not immediate
jeopardy (D, E, F).
Level 3: Actual harm that is not immediate jeopardy (G, H, I).
Level 4: Immediate jeopardy to resident health or safety (J, K, L).
Key Harm and Immediate Jeopardy metrics:
• % G+ Citations: Number of G+ citations (G, H, I, J, K L) / total citations (A through L).
• % Immediate Jeopardy Citations: Number of J, K, or L citations / total citations (A through L).
Note: In this report, we review state, regional, and national citation rates by 1) Overall citations
(no matter the severity) and 2) G+ citations (those in which the surveyors have found either
harm or immediate jeopardy). This distinction is important. Overall citation rates reflect the
extent to which state surveyors have identified a violation of minimum standards. However, the
RAP Citation Rate measures
the number of antipsychotic
drugging citations per 1,000
residents receiving
antipsychotics (RAP).
RPU Citation Rate measures
the number of PU citations
per 100 residents with
reported pressure ulcers
(RPU).

Long Term Care Community Coalition
11
identification of resident harm is critical because, in the absence of identification of harm, it is
extremely unlikely that a facility will face any penalty.
11
Limitations
This report offers a wide variety of data on nursing home enforcement at the state and regional
levels. It can be used to inform consumers, legislators, and the public during a critical moment
in long-term care policymaking.
Limitations include:
• Data accuracy: Datasets may provide varying levels of accuracy. For example, recent reports
have indicated an underreporting of rates of both pressure ulcers
12
and antipsychotic
drugging
13
of residents.
• State/regional differences: Conditions in a certain state/region may contribute to differences
in performance metrics in nursing home care and/or nursing home enforcement. For
example, unique geographic conditions in Alaska (as well as the state’s small population) may
create different environments for surveyors that could lead to differences in enforcement
performance metrics. Further, differences in resident demographics (i.e., age/race/gender)
may contribute to disparities in care and/or enforcement outcomes.
14
• Limited surveys in 2020 due to COVID-19: In response to the COVID-19 pandemic, CMS
limited state survey agency activity nationwide for a good part of 2020 to infection control
surveys and investigations of allegations of immediate jeopardy. This led to fewer surveys and
citations than normally occur in a year. Only 52,000 citations were recorded in 2020
compared to 124,000 in 2019 and 115,000 in 2018. However, since the COVID-19 restrictions
on state survey agencies were imposed nationwide, we determined that it would be most
useful to include citations for this year since it provides the most up-to-date data available, as
well as insights into how states and regions responded to the pandemic.
11
For more information and insights into the identification of resident harm, see The Elder Justice “No Harm”
Newsletter at https://nursinghome411.org/news-reports/elder-justice/.
12
Integra Med Analytics, Underreporting in Nursing Home Quality Measures (Aug 25, 2020).
https://www.nursinghomereporting.com/post/underreporting-in-nursing-home-quality-measures
13
Thomas, K., Gebeloff, R., and Silver-Greenberg, J., The New York Times, “Phony Diagnoses Hide High Rates of
Drugging at Nursing Homes,” (Sept 11, 2021). https://www.nytimes.com/2021/09/11/health/nursing-homes-
schizophrenia-antipsychotics.html
14
While an investigation of the potential impact of disparities in the resident population on state or regional
survey performance is beyond the scope of this study, the authors hope that these data may be useful for further
research in this area.

Broken Promises: An Assessment of Federal Data on Nursing Home Oversight
II. Data and Analysis
Overall Citations
Introduction
• Fundamentally, a state’s oversight of nursing home care boils down to two components: (1)
its ability to identify and cite a facility when a failure to meet standards (i.e., a deficiency)
exists and (2) its ability to appropriately rate the deficiencies it finds in terms of their “scope
and severity.”
• This section provides baseline information on the extent to which states are substantiating
problems and identifying when they result in harm or immediate jeopardy to one or more
residents (i.e., a rating of G or higher in the federal scope and severity grid).
15
It contains state
and regional data on overall citations including key findings, a map data visualization, and
tables.
• The accurate identification and rating of harm or immediate jeopardy is crucial because, in the
absence of such a finding, it is highly unlikely that the facility will be penalized for the
substandard care, abuse, or neglect. In other words, a facility will generally face no negative
repercussions for substandard care unless harm or immediate jeopardy are identified by the
state survey agency.
Key Findings
• Annually, surveyors substantiated one violation for every 13 nursing home residents in the
three-year period from 2018 to 2020 (0.07 citations per resident per year).
• Of the 290,289 total citations over three years, 95% were identified as causing neither harm
nor immediate jeopardy to any resident in the facility (5% were categorized as Harm (G or
above), including 1.8% of citations that were Immediate Jeopardy (J or above)).
• Infection Prevention & Control (F880) citations accounted for 7.8% of all deficiencies. As the
U.S. Government Accountability Office noted in a May 2020 report, “most nursing homes
were cited for infection prevention and control deficiencies (82% of those surveyed from
2013-2017). About half of these homes had persistent problems and were cited across
multiple years.”
16
15
See the Appendix for the scope and severity grid used by surveyors to rate deficiencies. For more information on
the role of the state survey agencies, see “A Practical Guide to the State Operations Manual,” available at
nursinghome411.org/survey-enforcement.
16
Infection Control Deficiencies Were Widespread and Persistent in Nursing Homes Prior to COVID-19 Pandemic,
GAO-20-576R (May 20, 2020). Available at https://www.gao.gov/products/gao-20-576r.

Long Term Care Community Coalition
13
• Antipsychotics (F758), Pressure Ulcers (F686), and Resident Rights (F550) are issues of concern
to both state and federal policymakers (not to mention residents and their families). Yet they
only accounted for roughly 2% of citations (each).
• Though most U.S. nursing homes persistently fail to meet CMS’s threshold for safe staffing,
Sufficient Staffing (F725) accounted for just 1% of citations.
• Quality of Life (F675) is crucial for residents and an essential component of the federal
requirements for nursing homes. Yet violations of a resident’s right to a decent quality of life
and treatment with dignity accounted for only 0.1% of citations.
State Findings
• State citation levels and identification of harm or immediate jeopardy (G+ on the scope and
severity scale) varied considerably.
• State enforcement in both citation rates and identification of harm or immediate jeopardy
were largely consistent across the categories of nursing home care evaluated in this study.
• In an average year in New York, which had the lowest citation rate in the country, there was
one citation for every 50 residents. In Alaska, which had the highest citation rate in the
country, there was one citation for every four residents.
• Our analysis did not reveal a strong association between a state’s enforcement frequency
(citation rate) and the likelihood that it would identify resident harm or immediate jeopardy
when making a citation.
• New Jersey and New York, both of which are in CMS Region 2, ranked in the bottom-quintile
in most citation rate metrics evaluated in this report.
Regional Findings
• As with the states, regional enforcement rates and the extent to which harm or immediate
jeopardy were identified varied considerably. Regional performance was often consistent
across the categories we assessed.
• Region 2 ranked at the bottom on most enforcement metrics. Region 10 ranked first or
second in most enforcement metrics. Region 10 is the least populated CMS region.

Broken Promises: An Assessment of Federal Data on Nursing Home Oversight
Data: Map and Tables
Total Citation Rate and Severity by State (2018-20)
Figure 2: Annual citations per resident during the three-year period from 2018-20. Darker shades indicate lower citation rates;
larger circles indicate lower proportion of Harm (G+) citations. See Figure 3 for info on Alaska, Hawaii, and Puerto Rico.

Long Term Care Community Coalition
15
Figure 2: Citation rate and severity by state (2018-20).

Long Term Care Community Coalition
17
Antipsychotic Drugging
Introduction
• Antipsychotic (AP) medications are highly potent drugs that are indicated to treat specific
conditions and diagnoses, such as schizophrenia. Unfortunately, inappropriate antipsychotic
drugging of nursing home residents, particularly those with dementia, is a prevalent problem
in facilities across the country. Too often, these drugs are used as a form of chemical restraint,
to sedate residents rather than provide appropriate care.
17
• AP drugs carry a “black-box” warning from
the Food and Drug Administration
18
because
they greatly increase the risks of stroke,
heart attack, diabetes, Parkinsonism, and
falls. They can also significantly diminish
social and emotional well-being. Importantly,
these drugs are not clinically indicated for the
treatment of the so-called behavioral and
psychological symptoms of dementia.
• A September 2021 New York Times report,
“Phony Diagnoses Hide High Rates of
Drugging at Nursing Homes,” found that
diagnoses of schizophrenia among nursing
home residents have increased dramatically in the years since CMS launched its “Partnership”
to improve dementia care and reduce antipsychotic drugging. This is likely because a nursing
home’s publicly reported rate of antipsychotic drugging is risk-adjusted to exclude residents
who receive these drugs but have been given a diagnosis of schizophrenia, Huntington’s
Disease, or Tourette’s Syndrome.
19
• This section contains state and regional data on AP drugging rates and AP citations (F758 -
Free from Unnecessary Psychotropic Meds/PRN Use), including key findings, a map data
visualization, and tables. Note: F758 comprises citations for any inappropriate psychotropic
drugging. Thus, it captures inappropriate antipsychotic drugging as well as the inappropriate
17
For more information and resources on the inappropriate use of antipsychotic drugs in nursing homes, visit our
Dementia Care Advocacy Toolkit at https://nursinghome411.org/learn/dementia-care-advocacy-toolkit/.
18
Public Health Advisory: Deaths with Antipsychotics in Elderly Patients with Behavioral Disturbances, U.S. Food
and Drug Administration (April 11, 2005). Available in the FDA’s archived web page, https://wayback.archive-
it.org/7993/20170113112252/http://www.fda.gov/Drugs/DrugSafety/PostmarketDrugSafetyInformationforPatient
sandProviders/ucm053171.htm.
19
Thomas, Katie, Gebeloff, Robert, and Silver-Greenberg, Jessica, “Phony Diagnoses Hide High Rates of Drugging at
Nursing Homes,” The New York Times (Sep 11, 2021). Available at
https://www.nytimes.com/2021/09/11/health/nursing-homes-schizophrenia-antipsychotics.html.
No stop date: A “No Harm”
Antipsychotics Deficiency (F758)
At a Florida nursing home, a resident
was receiving PRN (as needed)
antipsychotic medication for several
months without justification for
ongoing use and without a stop date on
the order. Despite the risks posed by
the potentially life-threatening side-
effects of psychotropics, the surveyor
cited the violation as no harm.

Broken Promises: An Assessment of Federal Data on Nursing Home Oversight
use of other psychoactive drugs, such as antidepressants. There is no F-tag that solely
addresses antipsychotics.
• Methodology: Citation Rates for inappropriate antipsychotic drugging (RAP Citation Rate)
were calculated based on AP citations (F758) from 2018-20 and the number of residents
receiving antipsychotics (RAP) in the fourth quarter of 2019 (MDS 3.0 Frequency Report (Q4
2019), N0410A: Medications - Medications Received - Antipsychotic).
Key Findings
• Though the use of chemical restraints has been prohibited for 30 years, and CMS has focused
specifically on eliminating the inappropriate use of AP drugs in U.S nursing homes since 2012,
close to 20% of facility residents – over a quarter-
million people – were administered one or more
antipsychotic drug.
• Federal data indicate an average of just eight (8.1) AP
citations per year for every 1,000 residents reported to
be receiving antipsychotics.
• Of the 6,157 AP citations recorded over the entire three-
year period, 31 (less than one percent) were categorized
as harm (G+). In other words, even when surveyors substantiate inappropriate resident
drugging, 99.5% of the time they find no resident harm.
• CMS Region 2 (NJ, NY, PR) ranked at the bottom in respect to annual citation rates, recording
8.1 AP citations for every 1,000 RAP. Regions 1 and 2 recorded zero G+ AP citations, meaning
that surveyors in those regions never identified inappropriate drugging as harmful to
residents. Regions 3, 4, and 8 each recorded 1 citation at G+.
• Region 10 (serving the northwest) ranked 1st in Annual RAP citation rate (26.1 per 1k
residents) and in % Harm AP citations (1.35%).
• Smaller states/territories including Alaska, Puerto Rico, Wyoming, Utah, Oregon, Delaware,
Idaho, and Hawaii recorded higher RAP citation rates, while Washington and Oregon ranked
in the top 10.
• The states with the lowest RAP citation rates (Alabama, Louisiana, Mississippi, Kentucky,
Georgia) were all located in the southern United States in Regions 4 and 6 (see Figure 6).
• These findings indicate that, despite years of training for both state surveyors and nursing
home staff on the dangers of antipsychotic drugs,
o Widespread antipsychotic drugging persists and
o State surveyors are disinclined to hold nursing home accountable for it.
What is RAP Citation Rate?
RAP Citation Rate measures
the number of antipsychotic
drugging citations per 1,000
residents receiving
antipsychotics (RAP).

Long Term Care Community Coalition
19
• A Journal of the American Geriatrics Society
20
study found disproportionate increases in
schizophrenia diagnoses among Black nursing home residents with Alzheimer's and related
dementia (ADRD). Correlation analysis of our data indicates a weak-moderate (r=-0.35)
negative association between a state’s share of Black residents and its RAP citation rate. In
other words, states with more Black residents were less likely to identify AP drugging
violations, adjusting for share of populations receiving antipsychotics.
Data: Maps and Tables
RAP Antipsychotic Citation Rate and Severity by State (2018-20)
20
Fashaw-Walters, Shekinah, McCreedy, Ellen, Bynum, Julie, Thomas, Kali, and Shireman, Theresa,
“Disproportionate increases in schizophrenia diagnoses among Black nursing home residents with ADRD,” Journal
of the American Geriatrics Society (Sep 30, 2021). Available at
https://agsjournals.onlinelibrary.wiley.com/doi/10.1111/jgs.17464.
Figure 5: Annual RAP Citation Rate (AP citations (F758) per 1k residents receiving antipsychotics) during the three-year period
from 2018-20. Darker shades indicate lower RAP rates; larger circles indicate lower proportion of Harm (G+) citation. See Figure
6 for info on Alaska, Hawaii, and Puerto Rico.

Broken Promises: An Assessment of Federal Data on Nursing Home Oversight
Figure 6: RAP citation (F758) rate and AP citation severity by state (2018-20).


Broken Promises: An Assessment of Federal Data on Nursing Home Oversight
Infection Control
Introduction
• Substandard infection prevention and control practices are a longstanding and widespread
problem in U.S. nursing homes.
• According to the U.S. Centers for Disease Control and Prevention, 1 to 3 million serious
infections occur every year in nursing home and assisted living facilities and as many as
388,000 residents die each year due to infections.
21
[Note: This figure was reported prior to
the COVID-19 pandemic.]
• The U.S. Government Accountability Office found that, prior to the pandemic, “most nursing
homes were cited for infection prevention and control deficiencies (82% of those surveyed
from 2013-2017). About half of these homes had persistent problems and were cited across
multiple years.”
22
• The extent of inadequate infection
prevention and control practices in U.S.
nursing homes was a growing concern in
the years prior to the pandemic. In fact,
when CMS revised the federal
requirements for nursing homes in 2016,
one of the few substantive changes it
made was to require that nursing homes
have an infection preventionist on, at
least, a part-time basis.
• Many infections can be prevented and
controlled through basic precautions,
such as hand hygiene. Even in respect to
addressing the spread of COVID-19, both
the CDC and CMS focused on providing
education to the nursing home industry on basic sanitary protocols, such a “cough etiquette”
and the aforementioned hand hygiene.
21
https://www.cdc.gov/longtermcare/index.html.
22
Infection Control Deficiencies Were Widespread and Persistent in Nursing Homes Prior to COVID-19 Pandemic,
GAO-20-576R (May 20, 2020). Available at https://www.gao.gov/products/gao-20-576r.
Communal COVID dining: A “No Harm”
Infection Control Deficiency (F880)
In May 2020, a New York nursing home
continued communal dining and
violating COVID-19 health and safety
protocols at the peak of the pandemic.
Observations revealed 27 residents
seated in the dining room, most
unmasked and within six feet of each
other. The citation was cited as no
harm despite the facility’s failure to
provide a safe environment to help
prevent the spread of COVID.

Long Term Care Community Coalition
23
• In August 2020, then CMS administrator Seema Verma “warned nursing home operators that
‘significant deficiencies in infection control practices’ were responsible for increases in COVID-
19 deaths.”
23
• This section contains state and regional data on Infection control citations (F880 - Infection
Prevention & Control), including key findings, a map data visualization, and tables.
Key Findings
• Infection Control (F880) accounted for 7.8% of all deficiencies identified by surveyors during
the three-year period we reviewed. Annually, this was an average of 5.7 citations for every
1,000 residents in U.S. nursing homes.
• Of the 22,554 infection control citations, only 3.2% were categorized as causing harm or
putting any residents in immediate jeopardy (G+). This indicates that state surveyors rarely
identify substandard infection control practices as a serious problem or significant threat to
residents. As discussed in the introduction to this report, in the absence if identification of
harm or immediate jeopardy, a facility is unlikely to face any penalty. Essentially, from a
consumer perspective, this means that facilities are paid for deficient practices.
• Even in 2020, during which COVID-19 decimated nursing homes, state surveyors failed to
identify any harm or immediate jeopardy to a single resident 93.5% of the time that they
found inadequate infection control practices.
• East coast states (New York, Vermont, Georgia, New Hampshire, North Carolina) reported the
lowest IC citation rates
24
(see Figure 8).
• Region 2’s annual citation rate (2.1 per 1,000 residents) was roughly one quarter that of
Region 9’s (8.2). In other words, the federal data indicate that states in Region 9 (California,
Nevada, and Arizona) are roughly four times more likely than those in Region 2 (New York,
New Jersey, and Puerto Rico) to identify inadequate infection control practices in their state’s
nursing homes.
23
Jaffe, Susan, “Three States Limit Nursing Home Profits in Bid to Improve Care,” Annals of Long-Term Care (Oct
25, 2021). Available at https://www.hmpgloballearningnetwork.com/site/altc/news/three-states-limit-nursing-
home-profits-bid-improve-care?hmpid=dXNjZG9jQGdtYWlsLmNvbQ==.
24
States are listed in ascending order (i.e., NY had the lowest infection control citation rate in the country).

Broken Promises: An Assessment of Federal Data on Nursing Home Oversight
Data: Map and Tables
Infection Control Citation Rate and Severity by State (2018-20)
Figure 8: Annual Infection Control citations (F880) per 1k residents during the three-year period from 2018-20. Darker shades
indicate lower IC citation rates; larger circles indicate lower proportion of Harm (G+) citations. See Figure 9 for info on Alaska,
Hawaii, and Puerto Rico.

Long Term Care Community Coalition
25
Figure 9: Infection Control (F880) citation rate and severity by state (2018-20).


Long Term Care Community Coalition
27
Pressure Ulcers
Introduction
• According to the Centers for Disease Control and Prevention, “[p]ressure ulcers, also known as
bed sores… are serious medical conditions and one of the important measures of the quality
of clinical care in nursing homes.”
25
• While some pressure ulcers are unavoidable,
research indicates that, “[i]n the vast majority of
cases, appropriate identification and mitigation of risk
factors can prevent or minimize pressure ulcer (PU)
formation.”
26
• Nevertheless, 7.26% of U.S. nursing home residents
have unhealed pressure ulcers. This is likely a
significant undercount, since studies have found that
many nursing homes under-report these data.
27
• This section contains state and regional data on
pressure ulcer (PU) rates and citations (F686 -
Treatment/Services to Prevent/Heal Pressure Ulcers),
including key findings, a map data visualization, and
tables.
• Methodology: Citation Rates for pressure ulcers (PUs) were calculated based on PU citations
and the number of residents with unhealed pressure ulcers in the fourth quarter of 2019
(MDS 3.0 Frequency Report (Q4 2019), M0210: Skin Conditions - Unhealed Pressure Ulcers).
Key Findings
• Pressure ulcers are a problem for over 92,000 nursing home residents.
• Though they are a serious problem and largely preventable or treatable, states cite nursing
homes the equivalent of less than 3% of the time that a resident has a pressure ulcer.
25
NCHS Data Brief, No. 14 (Feb 2009), which incorporates Pressure Ulcers Among Nursing Home Residents: United
States, 2004. Available at www.cdc.gov/nchs/data/databriefs/db14.pdf.
26
Edsberg, L.; Langemo, D.; Baharestani, M.; Posthauer, M.; and Goldberg, M., “Unavoidable Pressure Injury: State
of the Science and Consensus Outcomes,” Journal of Wound, Ostomy & Continence Nursing: July/August 2014 -
Volume 41 - Issue 4 - p 313–334. Abstract available at
http://journals.lww.com/jwocnonline/Abstract/2014/07000/Unavoidable_Pressure_Injury__State_of_the_Science
.6.aspx.
27
See, for example, Integra Med Analytics, Underreporting in Nursing Home Quality Measures (Aug 2020), finding
that “over half of SNFs [nursing homes] under-reported by at least a factor of two.” Available at
https://www.nursinghomereporting.com/post/underreporting-in-nursing-home-quality-measures.
A wound unhealed: A “No Harm”
Pressure Ulcer Deficiency (F686)
At a Delaware nursing home, a
resident suffering a stage 3
pressure ulcer (an open, sunken
hole) was not turned or
repositioned by staff as the
facility’s skin practice guide
directed. The surveyor found that
the facility violated standard
recommended interventions for
pressure ulcers but did not cite
the deficiency as harm.

Broken Promises: An Assessment of Federal Data on Nursing Home Oversight
• Annual PU citation rates varied considerably by region and state. In Region 10, citation rates
for residents with an identified pressure ulcer (5.2 per 100) occurred at 12 times the rate as
they did in Region 2 (0.4 per 100).
• When States do cite a facility for inadequate pressure
ulcer care or prevention, they only identify this as
harmful to residents about 23% of the time. Since, by
definition, a pressure ulcer is a wound, what message
does this send to the industry? To the state’s residents
and families?
• The ability to identify resident harm varied by region and
state. In Region 10, 45% of PU citations were ranked as G+ compared to only 10% in Region 2.
• Identification of any resident harm resulting from substandard pressure ulcer care is rare in
many states. DC, Maine, and Puerto Rico failed to record a single G+ PU citation in the three-
year period while Alabama, Nevada, New Hampshire, New Jersey, and Vermont recorded
only one (1) PU citation as causing resident harm over the three-year period (see Figure 12).
As a result, for example, the data indicate that even when New Jersey surveyors substantiate
substandard pressure ulcer care in a nursing home, they only identify this as harmful to
residents 3% of the time.
Data: Map and Tables
RPU Pressure Ulcer Citation Rate and Severity by State (2018-20)
What is RPU Citation Rate?
RPU Citation Rate measures
the number of PU citations
per 100 residents with
reported pressure ulcers
(RPU).
Figure 11: Annual RPU Citation Rate (PU citations (F686) per 100 residents with unhealed pressure ulcers) during the three-year
period from 2018-20. Darker shades indicate lower RPU rates; larger circles indicate lower proportion of Harm (G+) citations. See
Figure 12 for info on Alaska, Hawaii, and Puerto Rico.

Long Term Care Community Coalition
29
Figure 12: RPU citation (F686) rate and PU citation severity by state (2018-20).


Long Term Care Community Coalition
31
Quality of Life
Introduction
• The 1987 federal Nursing Home Reform Law clearly recognizes Quality of Life (QOL) as an
integral and essential component of an individual’s overall well-being.
• The federal regulations for nursing homes reflect this importance, stating explicitly that
“[q]uality of life is a fundamental principle that applies to all care and services provided to
facility residents. Each resident must receive, and the facility must provide the necessary care
and services to attain or maintain the highest practicable physical, mental, and psychosocial
well-being, consistent with the resident's comprehensive assessment and plan of care.”
28
• The CMS guidance makes clear the intent of this requirement:
The intent of this requirement is to specify the facility’s responsibility to create and
sustain an environment that humanizes and individualizes each resident’s quality of life
by:
o Ensuring all staff, across all shifts and departments, understand the principles of
quality of life, and honor and support these principles for each resident; and
o Ensuring that the care and services provided are person-centered, and honor and
support each resident’s preferences, choices, values, and beliefs.
29
• The COVID-19 pandemic exposed both the importance of QOL to resident well-being and the
extent to which the nursing home industry was unprepared to meet their needs when
visitation was stopped. According to an assessment conducted for The Associated Press, “for
every two COVID-19 victims in long-term care, there is another who died prematurely of
other causes.”
30
• This section contains state and regional data on QOL citations (F675), including key findings, a
map data visualization, and tables.
28
42 CFR 483.24. Available at https://www.ecfr.gov/current/title-42/chapter-IV/subchapter-G/part-483#483.24.
29
CMS State Operations Manual, Appendix PP - Guidance to Surveyors for Long Term Care Facilities (Rev. 173, 11-
22-17). For more information, see LTCCC’s Fact Sheet: Dignity & Quality of Life Standards and other resources on
the federal guidelines in the Learning Center at www.nursinghome411.org/.
30
Sedensky, Matt and Condon, Bernard, “Not just COVID: Nursing home neglect deaths surge in shadows” (Nov 19,
2020). Available at https://apnews.com/article/nursing-homes-neglect-death-surge-
3b74a2202140c5a6b5cf05cdf0ea4f32.

Broken Promises: An Assessment of Federal Data on Nursing Home Oversight
Key Findings
• Quality of Life (F675) citations are rare, accounting
for one-tenth of one percent (0.1%) of all citations in
the three years we analyzed. Nationwide, the failure
to meet a resident’s quality of life needs and rights
was cited by surveyors at an annual rate of only 0.8
for every 10,000 residents.
• Of the 330 QOL citations reported nationwide from
2018-20, only 22 (6.7%) were categorized as Harm
(G+). In most states, surveyors never identified a
single instance in which a resident suffered harm
because of a QOL violation during the three-year
period assessed.
• Annual QOL citation rates exceeded 2 per 10k
residents in only four states: Alaska, California, DC,
and Montana (see Figure 15).
• Though citations for violating residents’ rights to a decent quality of life were miniscule
nationwide, variations among the CMS Regions were found. Region 9 (AZ, CA, HI, NV) had the
highest annual QOL citation rate (2.1 per 10k residents); Region 2 (NJ, NY, PR) had the lowest,
with a rate (0.2 per 10k residents), roughly one-tenth that of Region 9.
• These data indicate a profound disconnect between the regulatory requirements for resident
quality of life – including treatment with dignity and humanity – and their enforcement. The
federal guidelines state that specific principles of quality of life “will be used for determining
whether a resident’s quality of life is being supported and or enhanced” by a nursing home
and its staff. Yet, as our findings indicate, citations are exceedingly rare.
• This problem may be due, at least in part, to the CMS guidance being self-contradictory.
Though the requirements and their intent (as discussed in the above introduction) clearly
mandate a resident-centered approach that fosters dignity, choice, and self-determination,
the guidance also states that “[n]oncompliance at F675 identifies outcomes which rise to the
level of immediate jeopardy and reflect an environment of pervasive disregard for the quality
of life of the facility’s residents.” As discussed throughout this report, federal data show that
surveyors are extremely disinclined to cite a facility at the level of Immediate Jeopardy (IJ).
Thus, stating that a problem should be “pervasive” and rise to the level of IJ sends a message
that undermines the implementation of these important standards in the lives of residents.
[Though, as discussed above, less than seven percent (7%) of QOL citations are cited at a level
of harm or higher, indicating that surveyors are not understanding or correctly implementing
the guidance.] We strongly recommend that CMS resolve this conflict and take immediate,
meaningful steps to ensure that surveyors are effectively enforcing quality of life
requirements.
Don’t you know that it’s toxic:
A “No Harm” Quality of Life
Deficiency (F675)
At a California nursing home,
staff failed to monitor a
resident’s medication serum
levels. Though the resident
was put at greater risk of drug
toxicity and symptoms such as
muscle weakness, twitching,
blurred vision, confusion, and
dehydration, the violation was
not cited as causing harm or
immediate jeopardy.

Long Term Care Community Coalition
33
Data: Map and Tables
Quality of Life Citation Rate by State (2018-20)
Figure 14: Annual Quality of Life citations (F675) per 10k residents during the three-year period from 2018-20. Darker shades
indicate lower QOL citation rates. See Figure 15 for info on Alaska, Hawaii, and Puerto Rico.

Broken Promises: An Assessment of Federal Data on Nursing Home Oversight
Figure 4: Quality of Life (F675) citation rate and severity by state (2018-20).

Broken Promises: An Assessment of Federal Data on Nursing Home Oversight
Resident Rights
Introduction
• Under federal law, every nursing home resident has a right to a dignified existence, self-
determination, and communication with and access to persons and services inside and
outside the facility.
• The federal rules for nursing homes include the following requirements related to resident
rights:
o A facility must treat each resident
with respect and dignity and care
for each resident in a manner and in
an environment that promotes
maintenance or enhancement of
their quality of life, recognizing each
resident’s individuality;
o The facility must protect and
promote the rights of the resident;
o The facility must provide equal
access to quality care regardless of
diagnosis, severity of condition, or
payment source.; and
o A facility must establish and maintain identical policies and practices regarding
transfer, discharge, and the provision of services for all residents regardless of
payment source.
31
• CMS guidance explicitly states:
Each resident has the right to be treated with dignity and respect. All
staff activities and interactions with residents must focus on assisting
the resident in maintaining and enhancing his or her self-esteem and
self-worth and incorporating the resident’s preferences and choices.
Staff must respect each resident’s individuality when providing care
and services while honoring and valuing their input.
32
31
See LTCCC’s Fact Sheet: The Foundations of Resident Rights (referencing 42 CFR 483.10(a)), Resident Rights
Handouts, and other materials in our Learning Center, https://nursinghome411.org/learn/, for more information.
32
CMS State Operations Manual, Appendix PP, Resident Rights, Intent of §483.10(a)-(b)(1)&(2). Available at
https://www.cms.gov/Medicare/Provider-Enrollment-and-
Certification/GuidanceforLawsAndRegulations/Downloads/Appendix-PP-State-Operations-Manual.pdf.
Breakfast in a soiled bed: A “No Harm”
Resident Rights Deficiency (F550)
At a New York nursing home, a resident
was observed sitting naked while eating
from a tray placed on soiled linens. On
the floor next to the resident was a
soiled incontinence brief. Despite the
unsanitary and disrespectful conditions,
and the resident’s discomfort, this was
not cited as harm.

Long Term Care Community Coalition
37
• Despite strong requirements to foster and protect a resident’s rights, violations of these rights
are consistently the most widespread concern reported to the LTC Ombudsman Programs
across the country.
33
• This section of the report contains state and regional data on RR citations (F550), including key
findings, a map data visualization, and tables.
Key Findings
• Though, as noted above, resident rights violations are the most frequently raised complaint to
LTC Ombudsmen, Resident Rights (F550) accounted for only 2.0% of all state survey agency
citations reported during the three-year period. Annually, there was the equivalent of 1.5 RR
citation for every 1,000 nursing home residents.
• Only 74 (1.3%) of the 5,905 RR citations were categorized as Harm (G+). In other words, close
to 99% of the time that surveyors identify a violation of a resident’s rights they find that it
caused no harm to the resident. As discussed in the introduction to this report, in the
absence of a finding of harm or immediate jeopardy, it is extremely unlikely that a facility will
face any penalty for the substandard care or treatment. Practically speaking, this means that
nursing homes will get paid for treatment that violates the rights of their residents and not
have to worry about incurring fines or penalties for providing demeaning care or services.
• Federal data reveal that 23 states never identify any resident harm when they cite for a
violation of nursing home resident rights, based on the three years evaluated (see Figure 18).
• All but two states, Vermont, and Montana, identify resident harm less than 10% of the time
that they substantiate a violation of resident rights. However, both of those states scored in
the bottom half of the country in respect to the overall identification of resident rights
violations (i.e., at any level of scope or severity).
• Puerto Rico, Alaska, Washington, and Delaware – four of the least populated states – had the
highest rates of RR citations (see Figure 17).
• Region 2 (NJ, NY, PR) and Region 4 (serving the southeast) reported the lowest RR citation
rates; Regions 10 (northwest) and Region 9 (west) reported the highest (see Figure 19).
33
See LTC Ombudsman National and State Data, Administration for Community Living, Table A-3: Complaint
Summary: Nursing Facility Totals and Percents for FY 2015 as of 03/14/2017 (showing percentages of complaints
by group for the years 2010 – 2015). Available at https://acl.gov/programs/long-term-care-ombudsman/ltc-
ombudsman-national-and-state-data.

Broken Promises: An Assessment of Federal Data on Nursing Home Oversight
Data: Map and Tables
Resident Rights Citation Rate and Severity by State (2018-20)
Figure 6: Annual Resident Rights citations (F550) per 1k residents during the three-year period from 2018-20. Darker shades
indicate lower RR citation rates; larger circles indicate lower proportion of Harm (G+) citations. See Figure 18 for info on Alaska,
Hawaii, and Puerto Rico.

Long Term Care Community Coalition
39
Figure 7: Resident Rights (F550) citation rate and severity by state (2018-20).


Long Term Care Community Coalition
41
Staffing
Introduction
• Numerous studies have shown that nursing homes with higher staffing levels are better
equipped to meet their residents’ care needs. To ensure that residents receive good care and
are safe, the federal nursing home requirements mandate that facilities have sufficient staff,
with the appropriate competencies, to meet the clinical, emotional, and psycho-social
needs of every resident admitted and retained in the facility.
34
• Nevertheless, understaffing is a widespread and persistent problem in nursing homes
nationwide. This understaffing has serious repercussions for residents. As one study noted,
“[f]unctional ability, pressure ulcers, and weight loss are the most sensitive quality indicators
linked to staffing.”
35
• LTCCC’s quarterly reports on staffing in U.S. nursing homes
36
-- including a report on the first
quarter of 2021 — consistently find that most U.S. nursing homes are understaffed and fail to
meet the necessary threshold for total care staff (4.10 HPRD) as determined by a 2001
landmark federal study.
37
The 2001 study determined that 91% of facilities lacked sufficient
staff to provide decent care.
• Though nursing home industry lobbyists have
long argued that inadequate staffing is due to
insufficient funding, there are no reliable data to
support that claim. In fact, an increasing
percentage of nursing homes are operated by
for-profit companies, including profit-oriented
Real Estate Investment Trusts and Private Equity
firms. Importantly, a 2014 federal study found
that an astonishing one-third of the people who
go to nursing homes for Medicare rehab services
(which even nursing homes acknowledge are
highly profitable) are harmed within an average
of 15.5 days after entering the facility. That study
34
For more information, see LTCCC’s Fact Sheet: Requirements for Nursing Home Care Staff & Administration,
available at https://nursinghome411.org/fact-sheet-requirements-for-nursing-home-care-staff-administration/.
35
Bostick JE, Rantz MJ, Flesner MK, Riggs CJ, “Systematic review of studies of staffing and quality in nursing
homes,” J Am Med Dir Assoc. (Jul 2006). https://pubmed.ncbi.nlm.nih.gov/16843237/
36
Available at https://nursinghome411.org/data/staffing/.
37
Abt Associates (Prepared for the Centers for Medicare and Medicaid Services), Appropriateness of Minimum
Nurse Staffing Ratios in Nursing Homes, Report to Congress: Phase II Final (December 2001). Available at
https://theconsumervoice.org/uploads/files/issues/CMS-Staffing-Study-Phase-II.pdf.
‘It can be frightening’: A “No
Harm” Sufficient Staffing
Deficiency (F725)
A Michigan nursing home failed to
provide timely call light response
and adequate staffing to provide
care for 14 residents. “For the last
couple weeks there has only been
two people at night,” a resident
said. “I have had a [medical
condition]. It can be frightening.”

Broken Promises: An Assessment of Federal Data on Nursing Home Oversight
found that 59% of the time that harm is “clearly or likely preventable.”
38
In short,
reimbursement rates are not an accurate (or appropriate) excuse for insufficient staffing.
• This section contains state and regional data on staffing levels and Sufficient Nursing Staff (SS)
citations (F725), including key findings, a map data visualization, and tables.
Key Findings
• Though long recognized as one of the most serious and widespread problems in the nursing
home sector, sufficient staffing (SS) is rarely cited. Nationwide, SS citations totaled just 2,625
in the three-year period from 2018-20.
• State totals for SS citations ranged from 0 (DC and Puerto Rico) to 338 (Michigan) for the
three-year period. The median SS citation total was 24 (eight citations per state per year).
• Correlation analysis showed a positive association between staffing citation rates and staffing
levels. For example: Region 10 had the highest annual SS citation rate (2.4 per 1k residents)
and highest staffing ratio (4.30 Total Nurse Staff HPRD). Conversely, Region 2 had the lowest
annual SS citation rate (0.13 per 1,000 residents) and ranked ninth (out of 10 regions) in
staffing ratio (3.39 Total Nurse Staff HPRD). (See Figure 21).
• Though staffing is universally recognized as essential for resident safety and dignity, the
identification of resident harm or immediate jeopardy due to insufficient staffing is
extremely rare (a total of 105 G+ citations in three years) and unevenly distributed across
both the states and CMS Regions.
• Regions 1, 2, 3, and 7 reported a combined four G+ citations, with Region 2 surveyors
identifying zero (0) cases in which a resident was harmed or put in immediate jeopardy due to
inadequate staffing in the entire three-year period (see Figure 22).
• Given that it is extremely unlikely for a facility to be penalized without resident harm
identified, the dearth of G+ SS citations demonstrates a system-wide and persistent failure to
hold nursing homes accountable for the most basic of requirements. The lack of meaningful
enforcement of federal staffing requirements raises the question: Whose interests are the
state survey agencies working to protect – those of residents and families or those of the
nursing home industry?
38
Adverse Events in Skilled Nursing Facilities: National Incidence Among Medicare Beneficiaries (Feb. 2014).

Long Term Care Community Coalition
43
Data: Map and Tables
Staffing Citation Rate and Severity by State (2018-20)
Figure 20: Annual Sufficient Staffing citations (F725) per resident during the three-year period from 2018-20. Darker shades
indicate lower citation rates; larger circles indicate lower proportion of Harm (G+) citations. See Figure 21 for info on Alaska,
Hawaii, and Puerto Rico.
Staffing Data Notes
Staff HPRD (Hours Per Resident Day) is a staffing metric calculated by dividing a nursing home's daily staff
hours by its MDS census. (A nursing home averaging 300 total nurse staff hours & 100 residents per day would
have a 3.0 Total Nurse Staff HPRD (300/100 = 3.0)).
Total Nurse Staff combines hours from RNs (incl. Admin and DON), LPNs (incl. Admin), CNAs, Med Aide/Tech,
and NA in Training (NA TR). Total RN Staff combines hours from RNs (incl. Admin and DON).
A landmark 2001 federal study found that residents need 4.10 hours total care staff HPRD and 0.75 RN HPRD
to ensure they receive sufficient clinical care. Staffing averages for most states and regions fall below those
thresholds.

Broken Promises: An Assessment of Federal Data on Nursing Home Oversight
Figure 9: Sufficient Staffing (F725) citation rate and severity by state (2018-20). The last four columns provide state-level data
on average total nurse staffing, RN staffing, and state rankings for each, based on payroll-based journal data from Q4 2019.

Long Term Care Community Coalition
45
Interactive charts and maps are available at https://nursinghome411.org/survey-data-report/.
Figure 22: Sufficient staffing (F725) citation rate/severity and staffing levels, by region (2018-20). The last four columns provide
state-level data on average total nurse staffing, RN staffing, and state rankings for each, based on payroll-based journal data
from Q4 2019.

Broken Promises: An Assessment of Federal Data on Nursing Home Oversight
Fines
Introduction
• Fines, also known as Civil Monetary Penalties (CMPs), are a
critical tool for holding nursing homes accountable for
substandard care, abuse, and neglect. Fundamentally, when
substandard care is identified, the imposition of a fine
imposes a cost for the failure to meet the standards which
nursing homes voluntarily agree to meet or exceed.
• Conversely, when a fine (or other penalty) is not imposed for
substandard care, it sends a message to the facility (and
industry as a whole) that poor care is acceptable. This is of
special concern when substandard care harms residents or
puts them in jeopardy.
• This section contains state and regional data on frequency
(adjusted for resident population) and severity of fines,
including key findings, a map data visualization, and tables.
Key Findings
• Unfortunately, as these data indicate, nursing homes infrequently face financial penalties
when they fail to meet minimum standards. From a consumer perspective, the absence of a
financial incentive makes it unlikely that poorly performing nursing homes will change their
practices.
• Nationwide, with over 15,000 nursing homes serving over one million residents on any given
day, federal data indicate an average of 2,126 fines per year are imposed. This is the
equivalent of 1.6 fines per 1,000 nursing home residents.
• The average fine was $29,000 while the median fine was $11,700.
• Fine frequency and severity varied significantly by state and region.
• Comparing states, Montana had the highest amount in annual fines per resident ($206) while
Nevada had the lowest ($3). The median state annual fine per resident was $46.
• The average annual fine per resident in Region 10 ($120) was 10 times higher than the
average fine per resident in Region 2 ($12).
• Note: This report only includes fines reported in the federal database, which does not include
fines that are imposed by individual states. For information on state fines, consult the
individual state’s website.
As the data in this
report indicate, there is
often little or no
punishment when
nursing homes fail to
provide care that
meets the standards
they are paid to
achieve, even when
such failures result in
significant suffering.

Long Term Care Community Coalition
47
Data: Map and Tables
Annual Fine Amount ($) and Frequency by State (2018-20)
Figure 23: Fines during the three-year period from 2018-20. Darker shades indicate lower amount in fines ($) per resident;
larger circles indicate lower number of fines per resident. See Figure 24 for info on Alaska, Hawaii, and Puerto Rico.

Broken Promises: An Assessment of Federal Data on Nursing Home Oversight
Figure 10: Fine rates and severity by state (2018-20).


Broken Promises: An Assessment of Federal Data on Nursing Home Oversight
III. Discussion & Recommendations
Discussion: A Failure to Enforce
The results of this study indicate that, in the years leading into the COVID-19 pandemic and the
first year of the pandemic, the state and federal response to longstanding and often serious
problems in nursing homes was, overall, very weak. The failure to vigorously enforce the range
of minimum standards we reviewed – from basic
infection control to dementia care to treating residents
with humanity and dignity – fostered a system in which
poor care and demeaning conditions are rewarded and
facilities were woefully unprepared to deal with the
COVID-19 pandemic. The decimation of the U.S. nursing
home population, and the heartbreak suffered by
families, was the tragic (but not inevitable) result.
This report also provides insights into the regional
differences in the effectiveness of the State Survey
Agencies (SAs). While oversight of nursing home care is
generally weak nationwide, we identified often
significant differences among the CMS Regions and
patterns of differences (i.e., weaknesses) which, we
believe, should inform public policy going forward. As
discussed in depth in our companion piece to this report, A Practical Guide to the State
Operations Manual,
39
the 10 CMS Regional Offices are charged with ensuring that the SAs in
their region provide effective oversight and monitoring of nursing home care. A failure at the
state level reflects a failure at the regional level to ensure that the state surveyors and state
agency leadership are capable and willing to carry out their mission: to protect vulnerable
residents and the billions of dollars American taxpayers spend on nursing home care every year.
In short, the persistence of poor care in our nursing homes is the result of a cascade of
failures, at the facility, state, and federal levels. The results are, too frequently, catastrophic
for residents and families.
The nursing home industry has historically complained that uneven enforcement hurts nursing
homes (rather than residents and families) because it makes for an inconsistent environment in
which to do business; facilities do not know for what they are – or are not – going to be cited.
However, given that the federal regulations implementing the 1987 Nursing Home Reform Law
have been in effect for three decades, we would argue that providers are – or should be –
aware of minimum requirements. When nursing homes don’t suffer consequences for failing to
meet requirements, residents and the public pay the price. Nursing home industry
39
Available at https://nursinghome411.org/survey-enforcement/.
The failure to vigorously
enforce the range of
minimum standards we
reviewed… essentially
fostered a system in which
poor care and demeaning
conditions are rewarded and
facilities were woefully
unprepared to deal with the
COVID-19 pandemic.

Long Term Care Community Coalition
51
representatives often state that their industry is one of the most regulated in the country. But if
those regulations are not enforced, what does that actually mean?
Recommendations:
Fundamentally, we believe that there is a strong body of knowledge regarding how to
effectively identify and cite deficiencies. Refinement and improvement are always needed (such
as, for example, in respect to the serious problem with the guidance for citing Quality of Life
deficiencies identified in our report). However, overall, the federal guidance and process for
surveying facilities, together, provide a strong and practicable basis for quality assurance,
including the effective identification of substandard care and resident harm.
40
The problem is essentially due to three serious deficiencies in the functioning of our state and
federal survey agencies: (1) lack of will, (2) lack of knowledge, and/or (3) lack of resources.
To help address these issues, we recommend that CMS
ensure that State Agencies – and the Regional Offices
charged with overseeing them – fulfill their shared
mission to protect residents. Residents and families
count on their State Survey Agency (SA) to ensure that
providers are meeting standards of care, including
effective infection control, treatment with dignity, and
sufficient staffing. American taxpayers depend on CMS
and the SAs to assure financial integrity of the billions of
dollars spent annually on nursing home care. However,
too often, CMS and the state agencies treat the industry
as their client and prioritize the industry’s interests over
those of the residents, their families, and taxpayers.
LTCCC’s recommendations:
1. Ensure that the State Survey Agencies (SAs), and the CMS Regional Offices (ROs) overseeing
the SAs, focus efforts on implementing both the letter and the spirit of the law, regulations,
and the State Operations Manual. For example, an SA that conducts 100% of the federally
required surveys per year should not be considered to have fulfilled its duties to CMS (or the
public) if it is not effectively ensuring that standards are met consistently and that deficiencies
are appropriately cited and meaningfully corrected.
41
40
For detailed information on the requirements for state oversight activities, see, A Practical Guide to the State
Operations Manual, available at https://nursinghome411.org/survey-enforcement/.
41
See, for example, the OIG report, CMS Guidance to State Survey Agencies on Verifying Correction of Deficiencies
Needs To Be Improved To Help Ensure the Health and Safety of Nursing Home Residents, Audit (A-09-18-02000)
(Feb 7, 2019). Available at https://oig.hhs.gov/oas/reports/region9/91802000.asp.
Too often, CMS and the
state agencies treat the
industry as their client
and its interests as
paramount, rather than
those of vulnerable
residents, their families,
and taxpayers.

Broken Promises: An Assessment of Federal Data on Nursing Home Oversight
2. Develop and implement quality assurance processes to identify, assess, and address patterns
of low citations and infrequent identification of resident harm or immediate jeopardy in both
the states and regions.
3. Issue guidance to state survey agencies that each violation of regulations should be given its
own separate deficiency to stop “stacking” of f-tags. [Stacking is the combining of multiple
violations into one citation.]
4. Increase survey frequency to at least one survey per facility every 6-12 months (rather than 9-
15 months). It is the responsibility of state and federal oversight agencies to ensure that
residents are safe, receive decent care, and are treated humanely every day. The current 9-
15-month inspection cycle has proven to be insufficient and, in the face of any urgent
situation (from the COVID pandemic to a fire threat), potentially catastrophic.
5. Improve composition and competency of state (and federal) survey teams:
o Strongly encourage state survey offices to utilize permanently employed surveyors
with minimum reliance on contract surveyors.
o Improve the caliber of survey agency staff by ensuring that surveyors and managers
do not have conflicts of interest (including not being allowed to work in the nursing
home industry for at least two years after leaving government service and not being
assigned to the same facility for consecutive surveys), and ensuring appropriate wages
and benefits for state surveyors, especially RN surveyors, to attract and retain a high-
quality surveyor and professional workforce.
o Require states to report number and composition of survey staff. Composition to
include professional training/accreditation (i.e., nurse, dietician, social worker, etc.),
whether permanent or contract staff, and years of experience.
o Require all survey teams to be multidisciplinary (include individuals with a social work
background in addition to persons with a nursing background and experience).
o Train surveyors in both state and federal regulations and in the meaning and purpose
of the laws and regulations: to protect residents and ensure that each is provided
good care and quality of life in the facility.
o Require survey agencies to consult with individuals and entities with expertise and
experience in law enforcement, infection control, financial auditing and accounting,
and other disciplines useful for evaluating regulatory compliance.
o Ensure that surveyors are familiar with current care and quality of life practices and
standards. To accomplish this, annual training requirements for both state and federal
surveyors should include training on:
▪ Clinical standards of care, including for pressure ulcers, infection control, and
psychotropic drugging; and
▪ Current quality of life practices and standards, including for dementia care,
cultural competency (such as for communities of color and LGBT individuals),
and age and ability appropriate activities.

Long Term Care Community Coalition
53
o Continue to prohibit state surveyors from providing consultation and training activities
for the nursing home industry. Better monitoring of the state agencies is needed to
ensure that this prohibition is not violated.
6. Reinstate the definition of Immediate Jeopardy to include violations of minimum standards
that have a “potential” for serious harm definition. This definition was in place under the
Nursing Home Reform Law of 1987 but was abruptly changed in 2019 (QSO-19-09-ALL).
7. Review and refine the Scope and Severity grid. Numerous studies have indicated that the
improper identification of problems, including those relating to serious abuse and neglect of
residents, is widespread. For instance, most deficiencies are rated as D (no resident harm) and
– as our study found – very few violations are identified as G or higher (causing any resident
harm or immediate jeopardy).
For our full range of recommendations for improving nursing home safety,
dignity, and financial integrity, visit https://nursinghome411.org/recs-safety-
integrity/.

Broken Promises: An Assessment of Federal Data on Nursing Home Oversight
IV. Appendix
Scope & Severity Grid
Health Deficiencies (2018-20)
Citation data are based on CMS’s Health Deficiencies which include health citations from
surveys conducted in the three-year period from 2018 to 2020. This dataset includes the
nursing home that received the citation, location of the nursing home, associated inspection
date, survey data, citation tag number (F-tag), and scope/severity (A through L). Data are
presented as one citation per row. Downloaded March 2021. Most recent dataset available at:
https://data.cms.gov/provider-data/dataset/r5ix-sfxw.

Long Term Care Community Coalition
55
Payroll-Based Journal (PBJ) Data (Q4 2019)
State and regional staffing data are based on CMS’s Payroll Based Journal (PBJ) Nurse Staffing
Data from the fourth quarter of 2019. PBJ data provide information submitted by nursing
homes including rehabilitation services on a quarterly basis. PBJ data include three months of
daily reporting for all U.S. nursing homes. LTCCC determines state and regional averages by
calculating the average hours per resident per day (HPRD) for each state and region during the
three-month period. Available at: https://data.cms.gov/quality-of-care/payroll-based-journal-
daily-nurse-staffing/data/q4-2019.
MDS Frequency Reports
CMS’s MDS 3.0 Frequency Report summarizes information for residents in nursing homes at the
time of the report based on resident MDS assessment records. This report uses MDS data (Q4
2019) for the following categories:
• Age of resident (RSAGE),
• Identification Information – Gender (A0800),
• Note: “Total residents (2018-20)” was determined by averaging 12 quarters of resident data
from A0800 from 2018-20,
• Identification Information - Race/Ethnicity – White (A1000F),
• Medications - Medications Received – Antipsychotic (N0410A), and
• Skin Conditions - Unhealed Pressure Ulcers (M0210). [Note: These data are reported from
nursing homes and do not include residents with pressure ulcers that facilities have failed to
identify and/or report.]
Available at: https://www.cms.gov/Research-Statistics-Data-and-Systems/Computer-Data-and-
Systems/Minimum-Data-Set-3-0-Public-Reports/Minimum-Data-Set-3-0-Frequency-Report.
Penalties
Fines and penalties data obtained from CMS’s Penalties dataset, which provides a list of the
fines and payment denials received by nursing homes in the previous three years.
Downloaded March 2021. Most recent dataset available at: https://data.cms.gov/provider-
data/dataset/r5ix-sfxw.
F-Tag List
F-tags correspond to specific standards in the Code of Federal Regulations. When a facility is
cited for substandard care or services, the surveyor assigns the deficiency an F-tag that
corresponds to the standard which was violated.
Following are the F-tags that correspond to the standards discussed in this report:
• F550: Resident Rights,
• F686: Treatment/Services to Prevent/Heal Pressure Ulcers,

Broken Promises: An Assessment of Federal Data on Nursing Home Oversight
• F675: Quality of Life,
• F725: Sufficient Nursing Staff,
• F758: Free from Unnecessary Psychotropic Meds/PRN Use, and
• F880: Infection Prevention & Control.
The full list of F-tags is available at https://www.cms.gov/Medicare/Provider-Enrollment-and-
Certification/GuidanceforLawsAndRegulations/Downloads/List-of-Revised-FTags.pdf. For more
information on these and other regulatory standards, download our guide to the nursing home
quality standards or visit our Learning Center for fact sheets on individual standards of care at
https://nursinghome411.org/learn/.
