
CALIFORNIA SOLAR
INITIATIVE (CSI)
THERMAL TECHNICAL REPORT
Final
Submitted to:
California Public Utilities Commission
Prepared by:
1111 Broadway, Suite 1800
Oakland, CA 94607
www.itron.com/strategicanalytics
September 3, 2019
With Assistance From:
TESS LLC, Davis Energy Group,
Katin Engineering, and ASWB

CSI Thermal Technical Report Table of Contents| i
TABLE OF CONTENTS
ES. EXECUTIVE SUMMARY ........................................................................................................................................... ES-1
ES.1 OVERVIEW OF TECHNICAL REPORT ..................................................................................................................................................... ES-2
ES.2 PROGRAM FINDINGS ......................................................................................................................................................................... ES-3
ES.3 PROGRAM RECOMMENDATIONS ......................................................................................................................................................... ES-7
ES.4 REPORTING CONSIDERATIONS ......................................................................................................................................................... ES-10
1 INTRODUCTION ....................................................................................................................................................... 1-1
1.1 PROGRAM BACKGROUND .................................................................................................................................................................... 1-1
1.2 CSI-T PROGRAM OBJECTIVES .............................................................................................................................................................. 1-3
1.3 TECHNICAL REPORT OBJECTIVES ......................................................................................................................................................... 1-4
2 COMMERCIAL POOLS ............................................................................................................................................... 2-1
2.1 EVALUATION FINDINGS ...................................................................................................................................................................... 2-1
2.1.1 Pool Depth .............................................................................................................................................................................................. 2-3
2.1.2 Evaporation ............................................................................................................................................................................................ 2-5
2.1.3 Pool System Operation Differences and Impacts on Savings ............................................................................................................... 2-10
2.1.4 Pool Heating Load ................................................................................................................................................................................ 2-13
2.1.5 Zero Savers .......................................................................................................................................................................................... 2-15
2.1.6 Onsite Findings .................................................................................................................................................................................... 2-17
2.2 ANEMOMETER FINDINGS ................................................................................................................................................................... 2-18
2.3 SYSTEM COSTS .................................................................................................................................................................................. 2-19
2.4 COMMERCIAL POOL RECOMMENDATIONS ......................................................................................................................................... 2-20
3 COMMERCIAL & MULTIFAMILY RESIDENTIAL ............................................................................................................ 3-1
3.1 EVALUATION FINDINGS ...................................................................................................................................................................... 3-2
3.1.1 System Performance Issues ................................................................................................................................................................... 3-4
3.1.2 Water Usage ........................................................................................................................................................................................... 3-7
3.1.3 Updates to TRNSYS Models ................................................................................................................................................................... 3-11
3.2 COMMERCIAL/MULTIFAMILY SYSTEM COSTS ..................................................................................................................................... 3-12
3.3 COMMERCIAL/MULTIFAMILY SYSTEM PUMP POWER .......................................................................................................................... 3-14
3.4 GLYCOL STABILITY ........................................................................................................................................................................... 3-15
3.5 PERFORMANCE DATA PROVIDER (PDP) EVALUATION ......................................................................................................................... 3-17
3.6 COMMERCIAL AND MULTIFAMILY RESIDENTIAL RECOMMENDATIONS ................................................................................................ 3-18
4 SINGLE FAMILY RESIDENTIAL .................................................................................................................................. 4-1
4.1 EVALUATION FINDINGS ...................................................................................................................................................................... 4-1
4.1.1 Updates to SRCC Models ......................................................................................................................................................................... 4-2
4.1.2 Water Heating Load ................................................................................................................................................................................ 4-4
4.1.3 Single Family Pump Power ..................................................................................................................................................................... 4-7
4.2 SYSTEM COSTS .................................................................................................................................................................................... 4-7
4.3 SINGLE FAMILY RESIDENTIAL RECOMMENDATIONS ........................................................................................................................... 4-10
5 CONCLUSIONS AND RECOMMENDATIONS ................................................................................................................. 5-1
5.1 PROGRAM RECOMMENDATIONS .......................................................................................................................................................... 5-1

CSI Thermal Technical Report Table of Contents| ii
LIST OF FIGURES
Figure ES-1: Wind Speed Findings .......................................................................................................................................................................... ES-4
Figure 1-1: California Solar Initiative – Thermal Timeline .................................................................................................................................... 1-3
Figure 2-1: Commercial Pool Direct Forced Circulation Diagram ............................................................................................................................ 2-1
Figure 2-2: Commercial Pool Sample – Evaluated and Claimed Savings ............................................................................................................... 2-2
Figure 2-3: Pool Depth Results ............................................................................................................................................................................... 2-4
Figure 2-4: Change in Savings Due to Application of Actual Pool Depth ................................................................................................................ 2-5
Figure 2-5: Sheltering Factors ................................................................................................................................................................................ 2-6
Figure 2-6: Sheltering Results ................................................................................................................................................................................ 2-6
Figure 2-7: Activity Level Results ........................................................................................................................................................................... 2-7
Figure 2-8: Change in Savings Due to Modification of Evaporation Assumptions .................................................................................................. 2-8
Figure 2-9: Change in System Operation from Expectation ................................................................................................................................. 2-11
Figure 2-10: Effect of Optimal Operation on Savings ........................................................................................................................................... 2-13
Figure 2-11: Pool Load Comparison Between Expected and Actual ...................................................................................................................... 2-14
Figure 2-12: Example of Anemometer Installation .............................................................................................................................................. 2-18
Figure 2-13: Anemometer Comparisons to 10m Wind Speeds ............................................................................................................................. 2-19
Figure 2-14: Commercial Pool Cost Trends ........................................................................................................................................................... 2-20
Figure 3-1: Indirect Forced Circulation System Configurations .............................................................................................................................. 3-1
Figure 3-2: Integral Collector Storage Diagram ..................................................................................................................................................... 3-2
Figure 3-3: Commercial and Multifamily Sample – Evaluated and Claimed Savings ............................................................................................. 3-3
Figure 3-4: Example of Site with System Outage ................................................................................................................................................... 3-4
Figure 3-5: Example of Site with Months of Downtime Prior to System Repair ..................................................................................................... 3-5
Figure 3-6: Water Heating Load Comparison for Primary Building Types in Sample ............................................................................................. 3-9
Figure 3-7: Annual Average Water Heating Load Comparison for Primary Building Types in Sample................................................................. 3-10
Figure 3-8: Commercial and Multifamily Cost Trends .......................................................................................................................................... 3-13
Figure 3-9: Indirect Forced Circulation Glycol vs. Drainback Mean Costs by Program Year ................................................................................ 3-14
Figure 4-1: Single Family Sample – Expected and Evaluated Savings ................................................................................................................... 4-2
Figure 4-2: Comparison of Single Family Flow Rates versus the Number of People in the House ......................................................................... 4-5
Figure 4-3: Relationship Between Hot Water Load and Savings ............................................................................................................................ 4-6
Figure 4-4: Single Family Cost Trends .................................................................................................................................................................... 4-8
Figure 4-5: Cost Trends for Single Family Direct Integral Collector Systems ......................................................................................................... 4-9

CSI Thermal Technical Report Table of Contents| iii
Figure 4-6: Comparison of SF System Costs due to Aliso Canyon Natural Gas Leak ............................................................................................ 4-10
LIST OF TABLES
Table ES-1: Reasons for Discrepancies in Pool Loads from Expected .................................................................................................................... ES-4
Table 2-1: Percent Reduction of Savings Based on Onsite Findings System Design ............................................................................................... 2-9
Table 2-2: Factors Affecting Pool Loads .............................................................................................................................................................. 2-15
Table 3-1: Onsite Engineer Soiling Determination ................................................................................................................................................ 3-6
Table 3-2: Maximum Gallons per Day Guideline Table .......................................................................................................................................... 3-8
Table 3-3: Solar Pump Sample Findings .............................................................................................................................................................. 3-15
Table 3-4: Glycol Testing Results ......................................................................................................................................................................... 3-16
Table 4-1: Hot Water Heating Loads by Day Type ................................................................................................................................................. 4-6

CSI Thermal Technical Report Executive Summary|ES-1
ES. EXECUTIVE SUMMARY
The purpose of this report is to provide an in-depth analysis of findings from the California Solar Initiative
(CSI) Thermal Impact Report (Itron, 2019). A separate report will analyze the cost-effectiveness of the
program and how well the program is meeting the goals stated under Assembly Bill (AB) 797 (Irwin, 2017).
Established in 2010,
1
the CSI Thermal (CSI-T) program has provided incentives for the installation of solar
water heating (SWH) systems in single family, multifamily, commercial, industrial, and commercial pool
facilities across the state. The program has reported an annual natural gas displacement of over 5.1
million therms, an electricity displacement of 889 megawatt-hours (MWh), and over 6,200 system
installations statewide between the evaluation period of 2010 and 2017.
The CSI-T program was designed to promote the installation of SWH systems in the Pacific Gas & Electric
Company (PG&E), Southern California Edison Company (SCE), San Diego Gas and Electric Company
(SDG&E), and Southern California Gas Company (SCG) regions. The Center for Sustainable Energy (CSE)
acts as the program administrator (PA) for the CSI-T program in the SDG&E region, while the other three
utilities act as their own program administrators. The four goals of the program, as specified in AB 1470
(Huffman, 2007) are:
2
Significantly increase the size of the SWH market through achieving the displacement of 463
million therms and 275.7 million kilowatt-hours (kWh) over the 25-year life of the systems through
natural-gas and electric-displacing SWH systems, and achieve an expansion of the market for
other solar thermal technologies in addition to SWH through the installation of 200,000 solar
thermal systems in homes and businesses;
Support reductions in the cost of SWH systems of at least 16 percent through a program that
increases market size and encourages cost reductions through market efficiency and innovation;
Increase consumer confidence and understanding of SWH technologies and their benefits; and
Engage in market facilitation activities to reduce market barriers to SWH adoption, such as high
permitting costs, lack of access to information, and lack of trained installers.
1
California Public Utilities Commission (CPUC) Decision 10-01-022. January 21
st
, 2010.
http://docs.cpuc.ca.gov/PUBLISHED/FINAL_DECISION/112748.htm
2
As noted in the CSI Thermal Program Handbook. http://www.gosolarcalifornia.ca.gov/documents/CSI-
Thermal_Handbook.pdf. AB 797 authorized in October of 2017extended the program through July 2020 and
revised the program to increase allocations to low income buildings in disadvantaged communities.

CSI Thermal Technical Report Executive Summary|ES-2
ES.1 OVERVIEW OF TECHNICAL REPORT
This report assesses the durability, performance, and cost of various solar thermal technologies. The
report is set up in five sections:
Introduction to the program
Commercial Pool analysis
Commercial and Multifamily analysis
Single Family Residential analysis
Conclusion and Recommendations
Part of the evaluation team’s responsibility is to develop findings and recommendations to improve the
impacts of future programs. This requires comparison of the program accomplishments reported in the
tracking data (expected results)
3
to the evaluation findings (actual results). The difference between these
two analyses is described here:
Expected Results: These results are based on summaries of the public export of the CSI-T incentive
application database. Expected system energy savings reported in the public database are the
result of the CSI-T Public Calculator, a tool for determining the appropriate incentive level based
on a number of key inputs for a system application.
4
The evaluation team looked at the overall
population of CSI-T participants and claimed savings for each budget program.
Actual Results: These results are based on evaluation activities performed. These include
developing energy savings impacts and program-level gross realization rates (GRRs).
5
Unless otherwise stated, the evaluation team reports first-year, therm-equivalent savings for all systems,
meaning that the savings for electric- or propane-backup SWH systems are converted from kWh to
therms, as over 90 percent of the systems installed and 99 percent of the expected therms saved utilized
natural-gas backup auxiliary heating.
3
These program accomplishments are reported in the CSI Thermal incentive application database. The public
version of this can be downloaded from http://www.csithermalstats.org/download.html
, and is the version
used by the evaluation team for their analysis.
4
See https://www.csithermal.com/calculator/
5
GRRs are a metric to provide a comparison between actual and expected results and are defined as the ratio
between the two. To develop program-level GRRs, the site-level results need to be weighted up to the
population. More on this process can be found in the CSI Thermal Impact Report (Itron, 2019).

CSI Thermal Technical Report Executive Summary|ES-3
ES.2 PROGRAM FINDINGS
Commercial Pools
A total of 744 Commercial Pool systems were installed with assistance from the program between 2010
and 2017. The evaluation researched the following topics to meet the objectives of the technical report:
System costs and trends: Pool heaters were found to be the lowest priced systems in the program with
average system costs between $9 and $11 per expected therm saved. System prices did not seem to vary
much over the four years, although 2017 did see a slight increase in commercial pool installation costs
compared with other program years.
Analyze the Transient Energy System Simulation (TRNSYS) model to compare the system monitored
performance metering results to the TRNSYS expected performance modeling results: Much of this
background analysis was described in the recently released CSI Thermal Impact Report (Itron, 2019). The
evaluation team’s analysis identified several categories that affected the expected savings seen by SWH
systems. These include assumptions on pool depth and evaporation assumptions. Pool heater operation
was also highly variable, and it was often found that pool heater and solar water heater controls were not
optimally set to maximum SWH benefits. Seasonal operation details input into the original calculations
sometimes underestimated the annual operation of the pool. These factors are described below.
Pool Depth Assumptions: Current pool depth assumptions in the program savings calculator
overestimate expected savings results. The calculator assumed that all pools in the program were
eight ft. deep. Out of the 20 pools in the evaluation sample, the average depth was found to be
about five ft., only 60 percent of the assumed depth.
Evaporation Assumptions: There is a lack of research on appropriate activity levels (how much
splashing occurs in a pool) and sheltering from wind for commercial pools. Therefore, the
program made some general assumptions about these factors for pools which contributed to
overestimated savings. A higher rate of activity in a pool will increase evaporation in the pool, as
will a lack of sheltering from the wind. The current calculator assumptions were found to be
underestimating the level of sheltering and overestimating the amount of activity in many pools
in the sample.
System Operation: How much a solar pool heating system operates varies both throughout the
year and by site. The lack of optimized set point temperatures of SWH and auxiliary heaters
significantly affected several sampled facilities, in some cases by increasing, and other cases by
decreasing pool loads.

CSI Thermal Technical Report Executive Summary|ES-4
Seasonal Operation: Several facilities claimed to have assumed a seasonal operation of the pool, between
May and October. The evaluation team found that in many cases the pool was either heated year-round,
or there were numerous time periods throughout the year where the SWH and auxiliary heater were
turned off.
Analyze effect of wind on unglazed solar collectors: The current assumption in the calculator is that the
wind speeds at the height of the collector are 30 percent of the wind speeds measured at 10 meters (m)
in height. The 10m height is chosen to match both typical meteorological year (TMY) data and data at the
local weather station. The evaluation team installed anemometers at four different sites in attempts to
gather data to validate the wind speed
assumptions at the collector that are
used in the TRNSYS simulations. For
three of the sites, the average percent
of the 10m wind speed was calculated
between 11-24 percent, while the
fourth site, which sat on top of a hill on
a three-story building, saw an average
percent of the 10m wind speed to be
closer to 175 percent. The results are
shown in Figure ES-1.
Analyze pool heating load and compare to TRNSYS simulation: The analysis team performed a
comparison between the expected pool load from the system that was claimed by the program, and the
actual system simulated by the evaluation team. The expected pool load was based on the energy
supplied from the auxiliary heating unit simulated using the system details submitted in the program
tracking data. The actual system pool load was based on the energy supplied from the auxiliary heating
unit based on the actual onsite findings and typical weather, assuming that the pool was operating
optimally and assuming no solar was being provided to the pool. For over 60 percent of the systems
analyzed, the actual pool load was found to be lower than the expected pool heating load. Table ES-1
highlights some of the main reasons identified for these discrepancies in systems with both lower and
higher loads than what was expected.
TABLE ES-1: REASONS FOR DISCREPANCIES IN POOL LOADS FROM EXPECTED
Reasons for Lower than Expected Pool Loads Reasons for Higher than Expected Pool Loads
Auxiliary heating only enabled for several months a
year instead of the expected year-round operation.
Claimed seasonal operation pools were often found to
be heated year-round.
Lower pool volume than expected.
Extremely high pool setpoint temperatures.
Low pool setpoint temperatures.
FIGURE ES
-1: WIND SPEED FINDINGS

CSI Thermal Technical Report Executive Summary|ES-5
Commercial & Multifamily Programs
A total of 1,580 systems were installed with assistance from the program across the three Commercial
and Multifamily budget programs; Commercial/Multifamily, Low Income Multifamily, and Multifamily
Disadvantage Communities. At the end of 2017, these budget programs were found to save almost 2.5
million therms annually. The evaluation researched the following topics to meet the objectives of the
technical report:
System costs and trends: Indirect Forced Circulation (IFC) systems made up the majority of the
commercial and multifamily SWH systems installed throughout the program. Analyzing the
installation costs of these systems is therefore a good guide to understand cost trends for the
commercial and multifamily budget programs. However, IFC drainback and glycol freeze
protection systems were found to have very different costs, with drainback systems costing on
average over $10/expected therm less than glycol systems. Over the course of the program the
number of drainback systems appear to be increasing, although glycol systems continue to
account for the majority of systems installed. This has driven the overall cost of the systems lower
in recent years.
Analyze the TRNSYS model to compare the system monitored performance metering results to
the TRNSYS expected performance modeling results: The evaluation team identified several
factors that affected the actual savings of the systems. System performance and operation was
one factor that negatively affected several sites. The other large driver of performance
differences were the water heating load assumptions made in the savings calculators.
─ System Operation: Multiple systems saw periods of time when the system was not working,
or not working well. In some cases, these issues were fixed quickly, but in other cases the
problem persisted for significant lengths of time. This significant downtime or poor
performance indicates that it was likely facility operators were not aware of the issue.
─ Water Heating Load: Water heating loads varied greatly from the expected loads reported
by the applicant. But in 85 percent of apartments where water heating load was estimated,
the estimated water heating load matched the maximum gallons per day guidelines as
specified by the CSI-T Program Handbook. This suggests that contractors or building
managers who are entering their information into the rebate calculator either do not have a
good estimate of their hot water usage is or the applicants realize that the incentive is tied
to usage and therefore are entering the maximum allowable value.
Analyze Glycol Stability in SWH systems: Glycol was tested in a sample of 11 facilities, once in
2016 when the meters were installed and again in 2019 when the meters were removed. During
the first test, only one system was found to have a glycol pH level that was outside of the
recommended range. By 2019, six of these facilities were found to have glycol pH levels outside

CSI Thermal Technical Report Executive Summary|ES-6
of the recommended base level of eight. Based on these findings, it did not appear that many of
the facilities were actively monitoring and maintaining their glycol.
Single Family Programs
Single family residences made up 62 percent of the systems installed through the end of 2017 but only
eight percent of the total savings claimed through the program, for a total of 3,883 systems installed.
Systems installed at single family residences tend to be smaller than those installed at other locations.
These were installed across three different budget programs; Single Family Residential, Low Income Single
Family, and Single Family Residential – Disadvantage Communities. These program’s expected savings
were calculated using the Incentive Calculator.
6
This calculator is based on TRNSYS software to model
each system and produce an incentive, by calculating conventional energy displaced by solar energy. As
required by the program,
7
savings for single family systems must follow the savings specified by the Solar
Rating and Certification Corporation (SRCC) OG-300 ratings.
8
The calculator allows for minor
customization of savings based on zip code, backup water heater type, azimuth, tilt, and annual average
access to sun from this solar array.
The evaluation researched the following topics to meet the objectives of the technical report:
System costs and trends: Single family systems were identified as the highest priced system on
a cost per expected therms saved basis. This cost was found to increase until 2014, where it then
dropped between 2015 and 2017. Direct integral collector storage systems made up the majority
of systems installed in 2014 and 2015 and had an average cost per therm much higher than that
of other system types. In 2017, the cost of all direct integral collector storage systems dropped
to about a quarter of their 2014 peak. A single contractor made up over 90 percent of the system
installations that year, and their projects reported an average cost far lower than any other
contractor reported for these systems, driving the overall single family system costs down. The
upcoming CSI-T Cost Effectiveness will explore these cost trends in further detail.
Analyze the TRNSYS model to compare the system monitored performance metering results to
the TRNSYS expected performance modeling results: The evaluation team identified two main
drivers that produced significant discrepancies between actual savings and the savings expected
6
https://www.csithermal.com/calculator/. Accessed on 02/06/2019.
7
Decision 10-01-022. http://docs.cpuc.ca.gov/PUBLISHED/FINAL_DECISION/112748.htm#P80_1949
8
ICC-SRCC OG-300 Solar Water Heating System Certification Program provides proof of compliance for solar
water heating systems to the current ICC 901/SCRR 300 standard.
http://www.solar-rating.org/certification/system.html

CSI Thermal Technical Report Executive Summary|ES-7
by the program based on the standard SRCC model savings and the site-specific findings that the
team identified.
─ SRCC System Savings: Single family system savings are based on the SRCC OG-300 estimation
of annual savings combined with a solar orientation factor, calculated by measuring the tilt
and azimuth of the SWH installation. The downside of this is that very few site-specific
conditions are taken into account. The evaluation team made some revisions to the SRCC
modeled savings, the most noticeable one having to do with the way wrap-around heat
exchangers were modeled. Newer models for wrap-around heat exchangers reduced the
potential energy savings claimed as they were revised to better capture the physics of the
flow through the piping.
─ Water Heating Load: Expected savings are based on an American Society of Heating,
Refrigeration, and Air-Conditioning Engineers (ASHRAE)
9
value of 64.3 Gallons per Day (GPD)
hot water for all sites. This number does not account for the water conservations measures
undertaken by California or the number of people in the household. The evaluation team
reviewed the average daily hot water demand for each of the Single Family and Low Income
Single Family homes in the sample. A simple analysis confirmed that there appeared a basis
for claiming that the flow rates seemed to vary by the number of people in the household.
Although no strong correlation was identified for these facilities, there was a definite trend,
with households with more people typically seeing a higher flow rate.
ES.3 PROGRAM RECOMMENDATIONS
The detailed discussion above provides the basis for the following recommendations made by the
evaluation team. Many of these recommendations were included in the CSI Thermal Impact Report (Itron,
2019).
10
Icons next to the recommendations indicate which budget programs the recommendations
correspond to.
*Recommendation 1 – Update to commercial pool depth assumptions: The program calculators
should incorporate an average pool depth (or pool volume) when they calculate the savings and
incentives for the pools. Because many pools do not have a consistent depth all the way through, a
maximum and minimum depth should be entered, and an average pool depth calculated. An alternative
9
American Society of Heating, Refrigeration, and Air-Conditioning Engineers (ASHRAE) is a global professional
association.
10
Recommendations with an asterisk (*) next to them were included in the Impact Report.

CSI Thermal Technical Report Executive Summary|ES-8
approach could be to ask for the total volume (in gallons) of a pool, as a pool operator may know their
overall pool volume rather than the average depth.
*Recommendation 2 – Update to commercial pool sheltering assumptions: The baseline pool
sheltering factor should be reduced from three to 0.5 in the program calculator. It may be possible
to develop questions that ask about the pool surroundings to see if there is any justification for increasing
the pool sheltering factor on a site-by-site basis.
*Recommendation 3 – Update to commercial pool activity level assumptions: The baseline pool
activity factor should be left at one for most pools. It is plausible that it may be possible to develop
questions to ask the site contact that might be able to further refine the activity levels of the pools, like
at a minimum, asking how often the pool is used during different months of the year. The model also
does not consider an activity level set by season. It is not clear how that might affect savings, or whether
the model may be able to handle this complexity.
*Recommendation 4 – Optimize operational performance for commercial pools: Several
recommendations for future programs could be made to optimize the performance of commercial
pools. The first is to require automated pool controls which optimize auxiliary and SWH heater setpoints
and maximize the benefits of the solar heating. The second would be to require some sort of owner or
operator training on how to best operate the pool heaters or require a maintenance plan where the
systems are checked on a regular basis and issues are discussed to ensure they are being optimally
operated. Finally, the savings and incentives program calculations should incorporate check boxes
representing each month of the year for both auxiliary heating and SWH heating, to determine how the
customer believes the system will be operated throughout the year.
*Recommendation 5 – Require existing pool heaters or demonstrate that a pool heater was
eliminated: Consider updating program requirements so that for existing pools, the installation of
a SWH system must offset natural gas usage. This could be done by replacing an existing heater (an older
solar hot water heater would be eligible). Written exceptions could be considered if the customer is truly
wanting to try out solar heating prior to purchasing a natural gas heater, but these are more likely to be
the minority and should be considered on a case-by-case basis.
Recommendation 6 – Consider requiring usable metering for more facilities: Similar to
the CSI photovoltaics (PV) rules, it may be useful to consider requiring usable metering for
SWH applications above 30kW
th
. This will help give system operators an incentive to make sure that
systems are maximizing the amount of solar used, enabling more accurate inputs into the calculator
models, and verifying that system outages are easily identified and quickly fixed. Finding a way to link the

CSI Thermal Technical Report Executive Summary|ES-9
metering to the incentivized amounts would also be beneficial. However, the benefit of this needs to be
balanced with the added cost and complexity this requirement would add.
Recommendation 7 – Consider allowing collector height as a calculator input to determine wind
speeds: Given the large range of wind speeds identified, it may be useful to allow collector height
as input to the calculator. Additional research may be needed to attempt to identify a relationship
between collectors at varying heights and wind speed ratio to 10m wind speeds.
Recommendation 8 – Consider providing incentives for maintenance plans and
metering equipment and ensure facility maintenance personnel are fully trained
on the system operation. This should include training for maintenance and periodic testing of the glycol
systems. Several sites in the commercial and multifamily sample saw very poor performance, due to
limited solar usage, technical system issues, or customers completely unaware of the system existence.
Many of the facilities where poor performance was identified had customers which reported no issues
with the system. This could indicate that many operators are unaware of how the system performs, and
facilities could benefit from creative ways to ensure the customer is fully engaged with the system
operation.
Recommendation 9 – Further research into how water loads for commercial and multifamily
facilities (prioritizing multifamily facilities) is warranted to get a better grasp on actual hot water
load that should be used to estimate savings: The calculator’s maximum values come from the ASHRAE
handbook which is noted to have pre-dated low flow fixtures and handbooks. This suggests that the
maximum water usage table may over-estimate hot water load, especially in states like California which
has suffered major droughts and has operated under mandates to reduce water usage across many
regions.
Recommendation 10 – Establishing a more appropriate average default value will help ensure
that incentive calculations are not based on a maximum hot water load: Eighty-five percent of
apartments receiving SWH incentives used the maximum allowable table in the program handbook to
estimate their hot water demand. This is in spite of the fact that the tables have the footnote that states
that “The GPD table is only a maximum justification and predates low-flow fixtures and appliances. Data
should not be used for sizing requirements.”
Recommendation 11 – Providing a check-list to installers and those applying for
rebates may help to eliminate some of these more common configuration issues: It
is not clear whether many of these configuration issues are due to site-specific conditions which require
system adaptations to ensure the system will fit in the existing space, or if some best practices are just
being overlooked. Some configuration issues result in potential safety issues, while others result in poor

CSI Thermal Technical Report Executive Summary|ES-10
performance. Alerting installers to these more common issues may be beneficial to reducing these
occurrences.
*Recommendation 12 – The evaluation team suggests exploring further an average flow rate
based on the number of occupants in the home, based on a sufficient sample size of Californian
residents: The expected savings for single family residential SWH systems are based on daily water draws
of 64.3 gallons per day. The source for this value comes from ASHRAE,
11
and assumes six equal daily
draws of 10.7 gallons. However, out of the 19 single family homes that were sampled, 11 were found to
have a daily water heating load of less than half of this expected value. The number of occupants
appeared to have a considerable effect on the water draw, however this factor is not considered in the
expected savings.
Recommendation 13 – While the SRCC OG-300 ratings serve as a useful source of potential
savings, identifying a method of incorporating additional site-specific findings will result in a
better estimate of savings. Discussions with SRCC to confirm that updating savings assumptions will not
nullify the SRCC certification for the equipment is required before any additional steps may be taken. If a
new residential SWH modeling tool is developed, it may be beneficial to consider whether it will provide
more accurate and site-specific savings for residential systems.
ES.4 REPORTING CONSIDERATIONS
The results of the CSI-T program evaluation reveal that there can be a steep learning curve to
implementing an incentive program for a technology as complicated as SWH. Unlike technologies like PV,
SWH systems can be much more complicated to model and estimate savings due to their countless
different configurations, external factors affecting savings, and dependency on operation, setpoint, and
hot water load. Given the complexities of the technology, and the effect that operation errors play on
savings, these findings will provide some useful recommendations and insights into how future SWH
programs can improve their program realization rates and expected savings estimates.
11
ASHRAE 118.2 Method of Testing for Rating Residential Water Heaters.

CSI Thermal Technical Report Introduction|1-1
1 INTRODUCTION
The California Solar Initiative Thermal (CSI-T) Program has incentivized 6,207 projects as of December 31,
2017
1
and tracked over 5.3 million equivalent
2
therms in annual expected energy savings. This section
provides program policy background, an overview of the CSI-T Program objectives, and the synopsis of
the evaluation scope of work.
1.1 PROGRAM BACKGROUND
California’s history with Solar Water Heating (SWH) has been a blend of expansive growth followed by
sudden and deep contractions in the industry. Due to plentiful solar resources, high energy prices,
attractive federal and state tax credits as well as utility rebates, many Californians were quick to adopt
SWH technologies in the late 1970s and 1980s.
3
The SWH industry in the state grew rapidly; however, this
expansion was accompanied by growing pains. Several poorly designed and installed systems were sold
at excessive prices, and failed to perform as expected, creating a perception that SWH systems were both
costly and inefficient.
4
In addition, with the sudden drop in fossil fuel prices in 1986 and loss of solar tax
rebates, interest in SWH declined and the SWH industry largely disappeared. By 1990, over 95 percent of
all SWH dealers nationwide went out of business.
5
Developers of SWH in California retreated for the next
two decades and stayed in business by operating in niche markets such as pool heating and repairing
existing solar systems.
Since 2000, increasing energy costs, growing concerns over greenhouse gas (GHG) emissions and
improvements in SWH technology have led to a resurgent interest in SWH. A study by the National
Renewable Energy Laboratory (NREL) indicates the technical potential energy savings associated with
lower cost SWH systems could exceed 100 trillion British thermal units (Btu) of natural gas within
California.
6
Similarly, a report by Environment California notes that increased use of SWH in California
1
The data analyzed and reported on in this report matches the data used to derive program impacts in the CSI
Thermal Program Impact Report (Itron, 2019).
2
Unless otherwise stated, the evaluation team reports first-year, therm-equivalent savings for all systems,
meaning that the savings for electric- or propane-backup SWH systems are converted from kWh to therms, as
over 90 percent of the systems installed utilized natural-gas backup auxiliary heating.
3
California Energy Commission, 2006 Integrated Energy Policy Report Update, CEC-100-2006-001-CMF, January
2007, p. 61.
4
A. McDonald and J. Bills, “The Kentucky Solar Energy Guide: Chapter 6: A Brief History of the American Solar
Water Heating Industry,” out of print, but found at
http://www.appalachia-
spi.org/uploads/1/3/4/9/13498092/guide_for_website_2014.pdf, p. 39. Accessed 04/30/2019.
5
Sunvelope, History of Solar Water Heating, http://www.sunvelope.com/TechData.pdf
6
P. Denholm, et al., The Technical Potential of Solar Water Heating to Reduce Fossil Fuel Use and Greenhouse Gas
Emissions in the United States, National Renewable Energy Laboratory, NREL/TP-640-41157, March 2007.

CSI Thermal Technical Report Introduction|1-2
could reduce natural gas consumption, possibly causing lower gas prices, while simultaneously reducing
GHG emissions. In 2006, the California Public Utilities Commission (CPUC) initiated the Solar Water
Heating Pilot Program (SWHPP) as part of the larger California Solar Initiative (CSI).
7
Senate Bill (SB) 1
(Murray, 2006) was signed that same year, directing the CPUC and the California Energy Commission (CEC)
to implement CSI given specific requirements and budget limits. Goals of the SWHPP were twofold: 1) to
help promote the use of SWH and, 2) to evaluate the impacts of the pilot program on SWH equipment
prices, demand, and cost-effectiveness.
The SWHPP started in July 2007 as an 18-month incentive pilot program implemented in San Diego Gas
and Electric’s (SDG&E) territory and administered by the Center for Sustainable Energy (CSE, formerly
known as the California Center for Sustainable Energy). In July 2008 the CPUC modified the original
decision establishing the pilot program.
8
The modified decision contained a number of key changes to the
original 2006 decision including: 1) extending the SWHPP beyond the initial 18-month timeframe; 2)
allowing new residential and commercial construction to be eligible for the program; 3) extending the
market research evaluation work beyond the San Diego region; and, 4) requiring the CPUC Energy Division
to hold a workshop on the SWHPP evaluation plan within 60 days of the ruling.
In January 2009, Itron completed the Interim Evaluation Report of the SWHPP.
9
The following year, the
statewide California CSI-T Program was established.
10
Figure 1-1 below provides an overview of key events
in the history of the program and rebated capacity over time.
Initially the program only offered incentives to single family residential SWH systems and program
participation was relatively low. Shortly after, the program was expanded to multi-family and commercial
buildings. In March 2011, Itron completed the SWHPP Final Evaluation Report. In October of the same
year, the CPUC created the Low Income Solar Water Heating Program. Between 2011 and 2013 the
program saw relatively moderate growth compared to previous years.
On February 28, 2013, the CPUC approved Decision 13-02-018 incentivizing new technologies other than
those providing end-use hot water and on August 15, 2013, the CPUC approved Decision 13-08-004
incentivizing solar swimming pool heating (except for single family residences). The eligibility of pool
heating projects has dramatically changed the composition of the program. Since the inclusion of pool
heating projects, over half of the 2015 and 2016 projects were for the pool heating end-use.
7
CPUC Decision 06-01-024, January 12, 2006, http://docs.cpuc.ca.gov/published/Final_decision/52898.htm
8
CPUC Decision 08-06-029, July 2, 2008, http://docs.cpuc.ca.gov/published/FINAL_DECISION/84844.htm
9
www.cpuc.ca.gov/WorkArea/DownloadAsset.aspx?id=7646
10
CPUC Decision 10-01-022, January 21, 2010. http://docs.cpuc.ca.gov/published/final_decision/112748.htm

CSI Thermal Technical Report Introduction|1-3
The program was extended through July 31, 2020 when Assembly Bill (AB) 797 (Irwin, 2017)
11
was signed
on October 4, 2017. The overall budget of $250 million was not changed, but AB 797 did increase the
allocations devoted to low income residential housing and buildings in disadvantaged communities, as
well as adding emphasis for industrial applications.
FIGURE 1-1: CALIFORNIA SOLAR INITIATIVE – THERMAL TIMELINE
* The capacity shown is based on the year that the incentive was approved.
** The impact evaluation has only gone through the end of 2017, so the expected impacts of 2018 have not been analyzed
or included here.
1.2 CSI-T PROGRAM OBJECTIVES
The CSI-T Program was designed to promote the installation of solar water heating systems in the Pacific
Gas & Electric Company (PG&E), Southern California Edison Company (SCE), SDG&E, and Southern
California Gas Company (SCG) service territories. The four goals of the program as defined by AB 1470
(Huffman, 2007) and Decision 10-01-022 are as follows:
Significantly increase the size of the SWH market through achieving the displacement of 463
million therms and 275.7 million kilowatt-hours (kWh) over the 25-year life of the systems through
natural-gas and electric-displacing SWH systems, and achieve an expansion of the market for
other solar thermal technologies in addition to SWH;
Support reductions in the cost of SWH systems of at least 16 percent through a program that
increases market size and encourages cost reductions through market efficiency and innovation;
11
Assembly Bill No. 797. https://leginfo.legislature.ca.gov/faces/billNavClient.xhtml?bill_id=201720180AB797

CSI Thermal Technical Report Introduction|1-4
Increase consumer confidence and understanding of SWH technologies and their benefits; and
Engage in market facilitation activities to reduce market barriers to SWH adoption, such as high
permitting costs, lack of access to information, and lack of trained installers.
AB 797 was established with the following intent:
Promote solar thermal systems and other technologies that directly reduce demand for natural
gas in homes and businesses;
Build a mainstream market for solar thermal systems that directly reduces demand for natural
gas in homes, businesses, schools, industrial, agricultural, government buildings, and buildings
occupied by nonprofit organizations;
Solar thermal system incentives should be a cost-effective investment by gas customers;
Encourage the cost-effective deployment of solar thermal systems in residential, commercial,
industrial, and agricultural markets and in each end-use application sector in a balanced manner.
1.3 TECHNICAL REPORT OBJECTIVES
This report is a technical follow up to the CSI Thermal Program Impact Report (Itron, 2019) that evaluated
program achievements between 2010 and 2017. The purpose of this follow up technical report is to assess
the durability, performance, costs, and benefits of various solar thermal technologies. The report covered
the following:
Review and analyze the costs and performance of solar thermal technologies that have
participated in the CSI-T Program. Compare actual and expected performance.
Analyze the Transient Energy System Simulation (TRNSYS) model to compare system monitored
performance metering results to TRNSYS expected performance modeling results.
Identify and describe system failures.
Analyze the glycol stability in SWH systems.
Analyze effect of wind on unglazed solar collectors.
Analyze pool heating load and compare to TRNSYS simulations.
Leverage metered data and the study’s analysis to provide recommendations to improve the CSI-
T program.

CSI Thermal Technical Report Commercial Pools|2-1
2 COMMERCIAL POOLS
Commercial pools made up 12 percent of the total systems installed through the end of 2017, and 32
percent of the total therm savings expected through the program. Ninety-eight percent of the SWH
systems installed through the program utilized direct pool heating with drainback freeze protection.
Although direct forced circulation systems are largely disallowed in the CSI-T, the Commercial Pool
program is the exception as long as it is not used for freeze protection. For these systems, the pool water
is circulated directly through the solar collectors and back into the pool and therefore requires either
manual or automatic gravity draining to prevent the potential for freezing. Figure 2-1 below shows an
example of the direct forced circulation system designed for a pool.
FIGURE 2-1: COMMERCIAL POOL DIRECT FORCED CIRCULATION DIAGRAM
The very small number of remaining pools in the program were recorded as utilizing glycol freeze
protection. Due to the small percentage of these systems, the evaluation team did not randomly choose
any of these pools in their sample, and not much detail can be provided about these systems.
2.1 EVALUATION FINDINGS
There were 744 systems installed with assistance from the Commercial Pool Budget Program between
2010 and the end of 2017. At the end of 2017, the evaluation team found that these systems saved nearly
514,000 therms annually. The evaluation team surveyed a sample of 25 commercial pools. As seen from
Figure 2-2 below, the project-level savings vary wildly for individual systems. The evaluation sample saw
a range of claimed savings between 669 therms and 2,518 therms. For most facilities in the sample, the
evaluation team found that the program significantly overestimated the savings that the SWH system
would provide.

CSI Thermal Technical Report Commercial Pools|2-2
FIGURE 2-2: COMMERCIAL POOL SAMPLE – EVALUATED AND CLAIMED SAVINGS
The program expected savings were calculated using the Commercial Pool Incentive Calculator.
1
This
calculator is based on TRNSYS software to model each system and produce an incentive, based on
conventional energy displaced by solar energy. Thermal Energy Systems Specialists (TESS), based in
Madison, Wisconsin and one of the key developers of TRNSYS, collaborated with the CSI Thermal Program
Administrators (PAs) to create the incentive calculator for this program.
There were several major factors that were found to contribute to the differences between the claimed
savings and the evaluated savings:
Pool depth: The depth of the pool affects how much energy is required to heat the pool. The
incentive calculator set the depth at eight feet (ft). The evaluation team found that was
overestimating the pool depth, and therefore overestimating volume of water in the pool.
Pool Sheltering: How sheltered a pool is from the wind will affect how much water and heat is
lost to the wind due to evaporation. The incentive calculator assumes a baseline value of three,
which represents a town with a moderate building density.
Pool Activity Levels: The activity level of a pool, or how often a pool is used, affects how much
water and heat is lost due to splashing and pool use. The incentive calculator assumes a baseline
value of one indicating a slightly choppy water surface as with a private pool.
1
https://www.csithermal.com/calculator/pool/. Accessed on 03/25/2019.

CSI Thermal Technical Report Commercial Pools|2-3
Pool System Operation: The pool temperature setpoints (temperature at which auxiliary heater
turns on and off, or temperature at which water is sent up to the solar collectors) were often not
set to optimal temperatures. Additionally, many sites did not seem to heat the pool when
expected, and therefore the SWH was used less during the year than expected.
Additionally, a small number of sites were identified as ‘zero savers’ given their systems had either been
removed, or they had no existing natural gas heater or planned heating, so the systems were not
displacing natural gas. It should be noted that current program rules allow for incentives in these
situations but because these systems are not displacing natural gas, the evaluation team cannot count
these as program savings.
2.1.1 Pool Depth
Pool depth affects how much energy is required to heat a pool. In general, the deeper the pool the more
energy needed to heat the pool up to a given temperature.
2
A pool depth of eight ft is assumed in the
calculator, giving lots of potential for a pool, even in hotter inland climates, to utilize significant solar
energy before heating up. However, the evaluation team found that the average depth of pools is much
less than eight ft. As part of the TRNSYS simulation, an optimization algorithm was run to come up with
an average pool depth at each of the pools in the sample. These averages were double checked from
onsite records, photos, and google earth images. At a site-level, the average depths were found to be
between 3.5 ft and 7.5 ft deep.
An average pool depth was calculated and weighted by the pool area. For the sample of pools, the
weighted-average pool depth was found to be about five ft deep, about 60 percent of the depth used to
calculate savings in the program calculators. Figure 2-3 displays the individual site-level pool depths for
each of the sampled sites. The actual depth of these pools is much lower than the baseline assumption in
the calculator. Assuming a pool depth of eight ft likely over-estimates the energy that will be saved due
to installing SWH.
2
However, shallower pools have more surface area for a given volume so have more evaporation and may show
higher heating needs in certain conditions.

CSI Thermal Technical Report Commercial Pools|2-4
FIGURE 2-3: POOL DEPTH RESULTS
Once the evaluation team had determined the refined pool depth for each of the sampled facilities, the
next step was to quantify the effect that the change of pool depth had on the savings at the site.
3
The
evaluation of the sampled sites compared the simulation results claimed by the program to the same
results using a refined pool depth developed from the evaluation team’s analysis. These results ranged
from 3.5 to 7.5 ft in depth. The site-specific findings are shown below in Figure 2-4. Applying the actual
pool depth to the simulation was found to produce a percent change in savings of anywhere between
zero percent to 37 percent. The site that saw no change to savings was found to have a refined pool depth
of 7.5 ft. The surface area of the pool is also an important factor to consider. The facility that saw the
largest reduction in savings due to the change in pool depth also had a surface area of about 1,100 ft
2
,
making it one of the pools in the sample with the largest volume of water. Across the sample of sites that
were analyzed, applying the actual pool depth to the simulations resulted in an average reduction in
savings of 21 percent.
3
It is important to note that pool depth affects the site differently, depending on what point in the analysis the
pool depth is changed. For example, if the pool depth is altered on system configuration that has been entered
into the tracking system, the percent change in the savings may be different from if the pool depth change was
applied to the simulation results from the system configuration identified through the onsite visit.
CSI Thermal Technical Report Commercial Pools|2-5
FIGURE 2-4: CHANGE IN SAVINGS DUE TO APPLICATION OF ACTUAL POOL DEPTH
As the pool calculator already asks for the pool surface area, the evaluation team recommends that
the program calculators should also incorporate a pool depth when they calculate the savings and
incentives for the pools. Because many pools do not have a consistent depth all the way through, a
maximum and minimum depth should be entered, and an average pool depth calculated. An alternative
approach could be to ask for the total volume (in gallons) of a pool, as a pool operator may know their
overall pool volume rather than the average depth.
2.1.2 Evaporation
Evaporation is another factor that is modeled in the TRNSYS simulation engine. The amount of
evaporation that a pool experiences is a product of two factors; sheltering (how much the wind is blocked,
more sheltering means less losses) and activity level (how much the pool is used; more splashing means
more losses). Both of these factors are also determined as part of the same optimization used to calculate
the overall pool depth for the model. The optimization algorithm sets the error function as the difference
in the simulated and measured temperatures for those periods where the main pool pump is operating,
and the metered data has not been missing for at least an hour to estimate these best-fit parameters.
Sheltering
Sheltering is a measure of how much the pool is sheltered from wind. A pool that is fully exposed to wind
like near open fields would be expected to lose heat faster than a pool surrounded by high-rise buildings
that would shelter the pool from the effects of wind.
4
This sheltering impact was often overestimated in
the original calculators. The sheltering variable, a factor between zero and ten, drives the algorithm that
4
When tall buildings are close together, they may have the potential to funnel wind and cause a venturi effect.
The flow of wind becomes constricted and the velocity must increase. This has the possibility of actually
increasing evaporation due to wind. This may be more common in a downtown setting with a number of tall
skyscrapers, but likely less common where many of the pools are installed.

CSI Thermal Technical Report Commercial Pools|2-6
estimates how much
energy the pool loses to
evaporation. See Figure
2-5. A higher sheltering
factor means more heat
loss to evaporation for a
given windspeed. A
value of zero represents
a pool with no wind-
induced evaporation
while ten represents
open water conditions.
The base assumption in
the calculator is three, which represents a town with a moderate building density. The results for this are
found below in Figure 2-6.
FIGURE 2-6: SHELTERING RESULTS
5
5
Sheltering results are not measured directly from the onsite visit but are calculated based on an optimization
algorithm which sets an error function as the difference in the simulated and measured temperatures. See the
description above under section header 2.1.2.
FIGURE
2-5: SHELTERING FACTORS

CSI Thermal Technical Report Commercial Pools|2-7
At the site level, the sheltering results were found to range between zero and 4.625, although the majority
of the sites were found to be far less than one. One site was set at the baseline assumption of three, and
two sites were found to be above four. One site was found to be just above one, while all other sites were
found to be 0.625 or less.
It is recommended that the baseline pool sheltering factor should be reduced for all pools to 0.5. It
may be possible to develop questions that ask about the pool surroundings to see if there is any justification
for increasing the pool sheltering factor on a site-by-site basis.
Activity Level
Activity level is a factor from zero to four, with zero representing a calm pool and four representing an
extremely choppy pool with artificially created waves. The baseline activity level in the calculator assumes
a value of one indicating a slightly choppy water surface as with a private pool. The results for these are
found in Figure 2-7.
FIGURE 2-7: ACTIVITY LEVEL RESULTS
The activity level results ranged from zero to two, with six sites left at the baseline assumption of one,
nine sites with an activity level factor of zero, and five sites found to have an activity level factor of two.
All of the pools with an activity level of two were found in SoCalGas or SDG&E regions. One site was a
hotel, while the others were all apartments or condos.

CSI Thermal Technical Report Commercial Pools|2-8
The evaluation team recommends that the baseline pool activity factor should be left at one for most
pools. It is plausible that it may be possible to develop questions to ask the site contact that might be able
to further refine the activity levels of the pools, like at a minimum, asking how often the pool is used during
different months of the year. The model also does not consider an activity level set by season. It is not
clear how that might affect savings, or whether the model may be able to handle this complexity.
Once the evaluation team had determined the refined pool evaporation assumptions for each of the
sampled facilities, the next step quantified how the change in evaporation assumptions affected the
savings at the site.
6
The analysis compared the simulation results of the sampled sites, as they were
claimed by the program, to the same results but using the refined evaporation assumptions developed
from the evaluation team’s analysis. The site-specific findings are shown below in Figure 2-8. Applying
the updated evaporation assumption findings to the models reflected by the public tracking data
7
showed
a decrease in savings across all sampled sites. This decrease in savings ranged from 14 percent to 69
percent. Across the sample of sites that were analyzed, applying only the actual evaporation assumptions
to the simulations resulted in an average reduction in savings of 52 percent. The large decrease in savings
shown below indicate the extent that evaporation assumptions in the model affect the savings.
FIGURE 2-8: CHANGE IN SAVINGS DUE TO MODIFICATION OF EVAPORATION ASSUMPTIONS
6
It is important to note that pool evaporation assumptions effect the site differently, depending on what point in
the analysis the evaporation assumptions are changed. For example, if the evaporation assumptions are altered
on system configuration that has been entered into the tracking system, the percent change in the savings may
be different from if the evaporation assumption change was applied to the simulation results from the system
configuration identified through the onsite visit.
7
Public tracking data can be downloaded from: http://www.csithermalstats.org/download.html.

CSI Thermal Technical Report Commercial Pools|2-9
Combined Effect of Pool Depth and Evaporation Assumptions
Applying the refined pool depth and modified evaporation factors to a model do not result in linear
changes to savings. For example, a 25 percent reduction in savings for pool combined with a 25 percent
reduction in savings due to modified evaporation factors will likely not result in a 50 percent reduction in
savings. The following table shows the effect of these factors at different points within the analysis;
changes in savings based on the refined pool depth, changes in savings based on modified evaporation
findings (sheltering and activity level), and then the combination of the two factors.
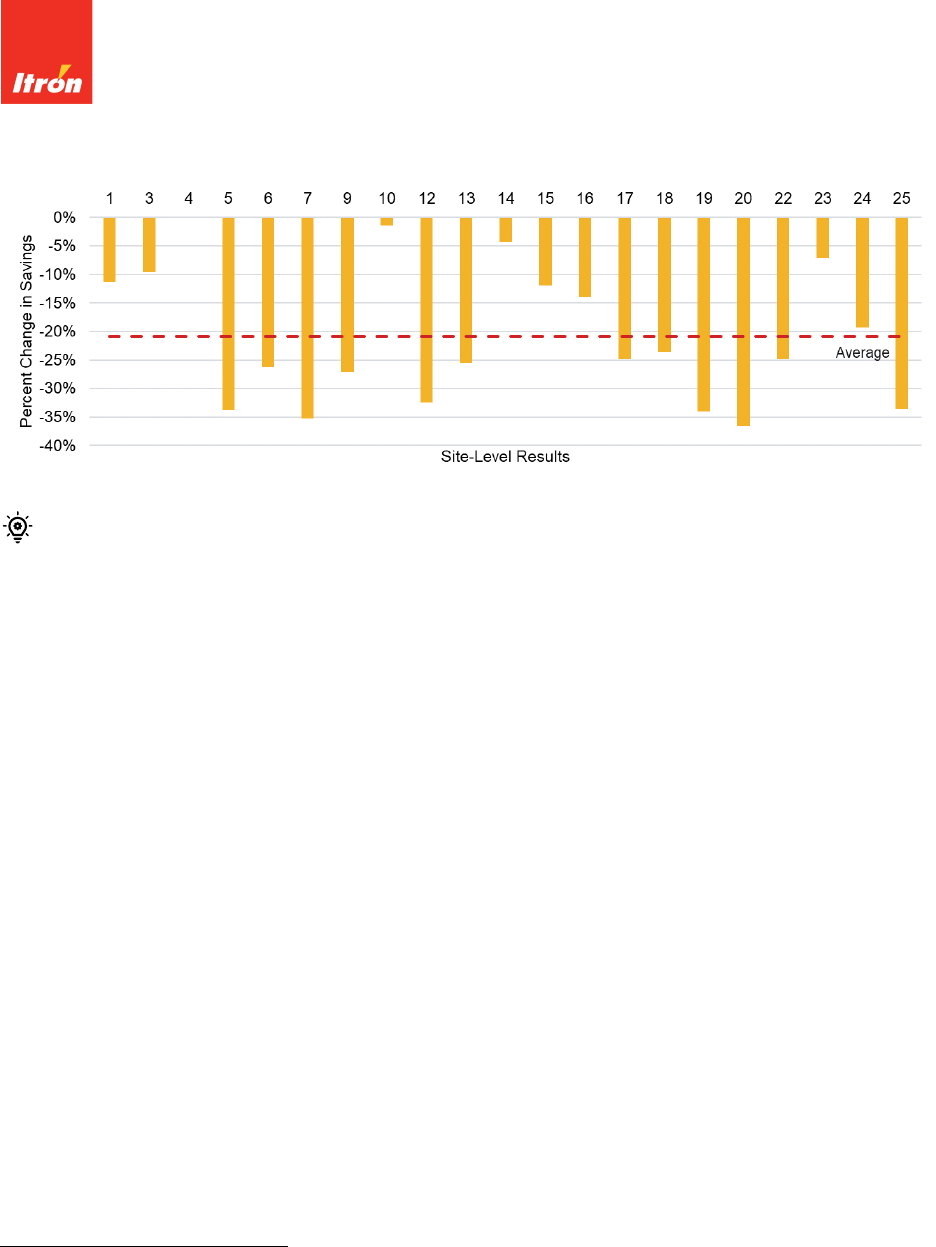
Table 2-1 shows the effects of the changes to the model based on the system design as identified during
the onsite visit. Many times, the onsite visit identified differences in system designs from what was
recorded in the public tracking data. For the sites in the sample, the average percent reduction to savings
was 16 percent, based on updating the pool depths to the refined depth. The percent reduction for
modifying the evaporation factors resulted in an average reduction in savings of 37 percent. The effect
of the two variables combined resulted in an average percent reduction of 43 percent, with a range of 17
percent to 55 percent for the site-specific values.
TABLE 2-1: PERCENT REDUCTION OF SAVINGS BASED ON ONSITE FINDINGS SYSTEM DESIGN
Site Number
Refined Pool
Depth
Modified Evaporation
Findings
Combination of Evaporation
and Pool Depth
1
9%
57%
54%
3
8%
10%
17%
4
1%
55%
42%
5
33%
47%
54%
6
6%
34%
36%
7
34%
32%
55%
9
24%
43%
48%
10
1%
34%
35%
12
18%
28%
38%
13
22%
27%
42%
14
4%
43%
44%
15
7%
44%
45%
16
5%
41%
47%
17
26%
43%
49%
18
21%
25%
42%
19
20%
41%
44%
20
20%
30%
38%
22
14%
37%
39%
23
6%
42%
44%
24
17%
28%
38%
25
37%
33%
50%
Average
16%
37%
43%

CSI Thermal Technical Report Commercial Pools|2-10
Sky Temperature
Sky temperature is an important driver for both pool models and unglazed solar collectors. Although the
temperature in outer space approaches absolute zero, the temperature of earth’s atmosphere, or the sky
temperature, increases based on the presence of other particles which emit long-wave radiation. The
temperature is highly dependent on variables such as altitude, humidity, cloud cover, and the presence
of other air-borne particles such as dust, pollen, pollution, etc. Unfortunately, there is no cost-effective
way for long term metering of sky temperatures. With existing equipment, net-long wave radiation can
be measured, and sky temperatures can be backed out if ambient temperature is known, but the
equipment to do so is expensive.
There are a number of different algorithms for estimating sky temperatures, but the validity of these
models are typically unknown, given their night time temperature assumptions are typically based on the
last hour of sunlight. This can cause issues when you have a sunny day, but clouds roll in overnight. This
would drastically increase the actual sky temperature, but it would not be reflected in the model.
The original TRNSYS models utilize their own internal algorithms to calculate sky temperatures based on
typical meteorological year (TMY) 3 data.
8
For the evaluation, a similar algorithm is used, but relies on
actual weather data from the closest California Irrigation Management Information System (CIMIS)
station.
9
It is important to note that while the algorithm to calculate sky temperatures stayed consistent
in the CSI-T calculator and the evaluation team analysis, the algorithm used may account for some of the
differences seen between metered data and simulated data. It is also possible that some of these
differences can be attributed to higher-than-normal activity in the pool, like a pool party. It is often
difficult to tell. While the evaluation does not explore differences due to sky temperatures, it is an
important factor to note.
2.1.3 Pool System Operation Differences and Impacts on Savings
An additional analysis on system operation reviewed days when the system was not operating as
expected. This could be when the solar thermal system was running but not expected to run, or more
often, when the SWH system was expected to send water up to the solar arrays but was not. There were
14 sites in the sample which were affected by this and can be seen below in Figure 2-9. The figure shows
the number of months where the system operation was found to be different than expected. One
seasonal site (site number three below) operated 23 days more than expected. However, the remainder
8
TMY3 are datasets of hourly values of solar radiation and meteorological elements for a one-year period.
https://rredc.nrel.gov/solar/old_data/nsrdb/1991-2005/tmy3/
9
The California Department of Water Resources manages over 145 automated weather stations in California.
https://cimis.water.ca.gov/

CSI Thermal Technical Report Commercial Pools|2-11
of the sites showed from about a month to a full year of downtime when the system was expected to be
running. In some cases, it appears that the system was shut down for summer months due to pool
temperatures rising too much. But in most cases, there doesn’t seem to be an apparent reason for why
these systems are shut down during certain times of the year. For many of these sites, the system was
started and stopped several times throughout the year, rather than showing continuous outage. That
indicates intermittent operation where someone appears to make a conscious decision to shut down or
start up the SWH systems.
FIGURE 2-9: CHANGE IN SYSTEM OPERATION FROM EXPECTATION
Temperature Setpoints
Other issues were discovered which resulted in limited SWH system usage, which have to do with system
temperature setpoints. Four sites in the sample were identified to have suboptimal auxiliary heating and
SWH heater setpoints:
Site number seven had a SWH temperature setpoint of approximately 87.5 ºF throughout the
year. However, the pool auxiliary heater setpoint was found to be 87 ºF most of the year, meaning
that the auxiliary heater would bring the pool up to 87 ºF, and the SWH would only increase the
pool about half a degree before it also shut off.
Site number 12 saw the SWH temperature setpoint set at 89.5 ºF, but the auxiliary heater setpoint
varied wildly throughout the year, hitting a temperature as high as 105 ºF. This negated the
potential benefit of the SWH system.
Site number 16 saw low SWH temperature setpoints between 76 to 80 ºF, meaning the SWH was
not operating for most of the summer months (June through September).

CSI Thermal Technical Report Commercial Pools|2-12
On average, site number 22 only experienced a 0.5 ºF difference between the auxiliary heater and
the SWH setpoint. However, another factor also penalized the SWH system performance. The
auxiliary heater was enabled from 5:00 am to 7:15 pm in the heating season. But at 10:00 am
every day when there is good solar radiation, the auxiliary heater seems to go dormant and the
solar arrays are activated. This means that the auxiliary heater pre-heats the pool prior to the
SWH system turning on.
Night-Time Solar Losses
The team found evidence of solar pumps running at night, sending heated water up to the solar collector,
at several commercial pools. Running the water through the collectors at night will often drop the pool
temperatures as the heat from the pool is lost to the atmosphere through the collectors. The evaluation
team looked at pool temperatures, as well as pool heater set-point temperatures to determine whether
this practice appeared to be purposeful. In some of the pools in the hotter regions of the state, the pool
temperatures were found to get extremely warm – upwards of 100 degrees, during warmer months.
When this was the case, it appeared that site contacts intentionally ran water through the collectors in
the evening in attempts to cool the pool. However, there were several pools where this did not seem to
be the case and cooled the pool excessively or when the pool did not need cooling. The evaluation team
discovered that the auxiliary heater was often turned on in the morning after to increase the pool
temperature and account for the energy losses during that evening.
Pool Operation Effect on Savings
Overall, the night-time pump operation and different than expected operation significantly reduced the
savings of the systems in the sample. The evaluation team compared the evaluated savings at the site
against the evaluated savings at the site if the solar pool heating system was optimally operated. These
are shown below in Figure 2-10. Seven of the sites in the sample would have seen over a 100 percent
increase in their actual savings, had the systems been operating optimally. There was only one facility in
the sample, site number three, which appears to be operating closely to what was expected. Although
this facility did see close to 50 days of downtime when the system was expecting to be operating, it was
found to be during winter months, where not much savings were expected. The yellow bars show results
for optimal operation but consider the effect of incorporating the refined depth results for each site.
Finally, the red bars indicate the overall results for each site, if the facility had optimized its operation,
considered actual depth for the pools, and had incorporated the updated site specific evaporation
assumptions discussed in the section above. The evaluation team found that savings for many of these
sites would have increased significantly had they been operated as expected.

CSI Thermal Technical Report Commercial Pools|2-13
FIGURE 2-10: EFFECT OF OPTIMAL OPERATION ON SAVINGS
* Four of the sites in the sample, 1, 15, 16, and 24, were all found to either have no auxiliary heater, or auxiliary heating systems
were non-functioning during the metering period. Two others, sites 23 and 25 were found to be completely off and therefore
have no savings, so no percent increase in savings due to optimal operation could be calculated.
The evaluation identified significant limitations in the way the sampled SWH pool systems are
controlled throughout the year. These included temperature setpoints as well as seasonal operation of
the pools. Several recommendations for future programs could be made here. The first is to require
automated pool controls which optimize auxiliary and SWH heater setpoints and maximize the benefits of
the solar heating. The second would be to require some sort of owner or operator training on how to best
operate the pool heaters or require a maintenance plan where the systems are checked on a regular basis
and issues are discussed to ensure they are being optimally operated. Finally, the savings and incentives
program calculations should incorporate check boxes representing each month of the year for both
auxiliary heating and SWH heating, to determine how the customer believes the system will be operated
year-round.
2.1.4 Pool Heating Load
Heating load is a prime driver of solar thermal savings since, unlike solar photovoltaic (PV) where excess
energy can be exported to the grid, solar thermal can only offset up to the existing onsite heating load.
Therefore, the analysis team performed a comparison between the expected pool load from the system

CSI Thermal Technical Report Commercial Pools|2-14
that was claimed by the program, and the actual system simulated by the evaluation team. The expected
pool load was based on the energy supplied from the auxiliary heating unit simulated using the system
details submitted in the program tracking data. The actual system pool load was based on the energy
supplied from the auxiliary heating unit based on the actual onsite findings and typical weather, assuming
that the pool was operating optimally, and assuming no solar was being provided to the pool. This
comparison is shown below in Figure 2-11.
FIGURE 2-11: POOL LOAD COMPARISON BETWEEN EXPECTED AND ACTUAL
For 13 of the 21 sites, the evaluation team found that the actual pool load was lower than the expected
pool heating load, meaning that the amount of auxiliary heating was overestimated. For the remaining
eight sites, the pool loads of the actual systems were found to be higher than the evaluated loads, and in
some cases, many times higher. The sites where the actual load was less than 50 percent or greater than
150 percent from the expected load have been highlighted. The average pool load was around 173
percent of the expected pool load for the sites in the sample. The pool load is affected by several main
factors, most of which have already been discussed. These include the volume of water in the pool, the
operation of the pool over the year and the assumed setpoint temperature compared with the actual
findings. Further explanation of the factors that affected the large differences in loads from expected
results to actual results are highlighted below in Table 2-2.

CSI Thermal Technical Report Commercial Pools|2-15
TABLE 2-2: FACTORS AFFECTING POOL LOADS
Site Number
Change in
Load
Factors
9
Decrease
in Actual
Load
Site was operational year-round, but auxiliary heater was only enabled for several
months of the year - between February and March, for most of November and for a
few days in January.
18
Pool is only heated for about six months of the year – March through May and
September through November. Actual pool volume is 35 percent of the expected
volume.
23 Pool setpoint temperature was found to be as low as 75ºF for portions of the year.
4
Increase
in Actual
Load
Winter and spring loads were much higher than expected.
6
Claimed seasonal operation, but found to operate year-round
12
Large swings in pool setpoint temperature. As high as 105ºF. Does not drop below
84.5 ºF throughout the year.
13
Claimed seasonal operation, but found to operate year-round
19
Claimed seasonal operation, but found to operate year-round
20
Claimed seasonal operation, but found to operate year-round
The findings from the pool load analysis re-iterate the affect that seasonal operation and setpoint
temperatures have on the pool load, and therefore the potential savings from a SWH system. These points
re-affirm the recommendation regarding solar pool controllers and accounting for seasonal operation by
month in the calculators.
The evaluation team could also suggest that useful metering be required for a larger portion of
commercial pool applications to ensure that pools are optimally controlled throughout the year.
Identifying a method of tying a portion of the incentives to the useful metering would be ideal.
2.1.5 Zero Savers
System Removed
Out of the 120 sites visited as part of this CSI-T evaluation, Commercial Pools were the only budget
program to find systems which had been removed. Removals were identified at two facilities, site number
11 and 21. One site contact cited a leak in the system as the reason for removal and another site contact
noted that the new owners of the facility made the decision to remove the system without providing more
detail. Because the evaluation team determined that these sites were no longer producing solar energy
to heat the pools, these sites were classified as ‘zero savers’. Although these situations are hard to predict,
they do represent real-world situations that arise, that will affect the overall program results and were
therefore included in the sample.

CSI Thermal Technical Report Commercial Pools|2-16
Previously Unheated
A second reason for assigning zero savings to pool facilities had to do with pools which prior to installation
of solar water heating systems, had no pool heating, and therefore no natural gas consumption. The
program rules purposely allow the installation of solar water heating systems at pools where no existing
pool heating occurs, with the intent of displacing potential future usage of natural gas.
10
Despite the program rules, the purpose of the evaluation is to quantify actual energy, environmental, and
economic benefits achieved by the CSI-T program. For both facilities, site number two and eight,
discussions with the site contact confirmed the site had no intention of installing a heating system at the
facility. These facilities were approached by SWH contractors who told the facility that the contractor
could install SWH systems for free at their facility. The analysis of system costs and incentives for these
two facilities yielded the finding that one facility received their system for free after incentives, and for
the second facility, the incentive covered 95 percent of the system cost.
11
While the systems at these
facilities are heating the pools with solar energy, they are not displacing any existing heating source or
any potential heating source and therefore do not qualify for savings. The evaluation team also contacted
two other pool facilities and determined similar findings. However, because these two additional sample
points were not randomly selected, and were instead, sample points of convenience after finding other
zero savers in the area, these were not included in the sample results. These two additional sites are
noted as potential indication of a larger concern. There was one pool in our sample which had a solar
heating system that had failed. In our conversations with the site contact, the evaluation team learned
that they had opted to replace the solar water heater rather than going with a natural gas heater.
Therefore, it was determined that this met the requirement of avoiding natural gas usage, and calculated
savings for this site.
The PAs and the CPUC have taken steps through the capping of Commercial Pool incentives to minimize
effects of installers offering solar pool heaters “free-of-charge”. However, a program recommendation is
to take this one step further and update program requirements so that for existing pools, the installation
of a SWH must replace an existing heater (an older solar water heater would be eligible). Written
exceptions could be considered if the customer is truly wanting to use solar heating in place of purchasing
a natural gas heater, but these are more likely to be the minority and should be considered on a case-by-
case basis.
10
There was another facility in the sample which previously had an older solar water heater which broke. Instead
of replacing it with a natural gas heater, they used the program to install a newer solar water heating system. In
this situation, the savings were accepted, as they displaced potential natural gas usage.
11
On January 29
th
, 2015, the program rules were modified per CPUC D.15.01.035 which capped the Commercial
Pool incentives at 50 percent of the system costs in attempts to minimize this effect.

CSI Thermal Technical Report Commercial Pools|2-17
2.1.6 Onsite Findings
Only two of the twenty-four non-zero-saver commercial pools in the sample had identified no changes to
the reported system configurations while onsite. There were several system details that were confirmed
by the engineers during their onsite visit, including:
Pool cover usage,
Pool setpoint temperature,
Updating the collector descriptions to accommodate different azimuths and tilts,
Multiple solar collector arrays facing different directions,
Total number of collectors in series,
Pool surface area, and
Seasonal operation of the pool.
The first three categories, pool covers, set point temperatures, and tilt and azimuth changes saw at least
75 percent of the sample affected by these changes. Pool covers are automatically assumed in the
calculators, in order to drive, or assume, more efficient behavior, so only a couple facilities specifically
noted that they did not have pool covers. However, it was found that the large majority of the sampled
sites did not have a physical pool cover (although some noted a liquid pool cover designed to reduce
evaporation). Set point temperatures were slightly off for 18 pools, ranging from differences in a single
degree, all the way up to 20 degrees. Modifications to the azimuth were reported up to 80 degrees, and
tilt up to 14 degrees. For systems with multiple solar collector arrays facing different directions, it should
be noted that there was a conscious decision to allow for only one entry for tilt and azimuth to ease
applications. However, in an example where half of the panels face east and half face west, the average
azimuth is due south which drastically skews the amount of solar radiation seen by the panels. Pool
Surface area changes were also significant at some facilities, with almost half of the sample seeing changes
of between 10 percent and over 40 percent in square footage.
Because of the large number of differences identified by the onsite teams, it may be beneficial to have
both the customer and the implementer verify model inputs separately to use as a verification tool in
assessing actual system details.

CSI Thermal Technical Report Commercial Pools|2-18
2.2 ANEMOMETER FINDINGS
The performance of unglazed collectors is much more dependent on wind speed over the collectors than
glazed collectors.
12
Therefore, the modelling assumptions that TRNSYS uses in their calculations is
critically important for commercial pools. The current assumption in the calculator is that the wind speeds
at the height of the collector are 30 percent of the wind
speeds at 10 meters (m) in height. The 10m height is
chosen to match both TMY data and the local weather
station. The 30 percent ratio was set by the program
based on available research at the time. The value does
not consider height of the collectors or objects around
the collectors which may reduce wind speeds seen at the
collectors.
The evaluation team installed anemometers at four
different sites in attempts to gather data to validate the
wind speed assumptions at the collector that are used in
the TRNSYS simulations. An example is shown in Figure
2-12. The facilities where these anemometers were
installed were chosen by the engineering team based on
the ability to safely install the metering equipment, ability to run wiring safely on the outside of the
building, and proximity to the closest weather station. At each facility, two anemometers were installed
at the collector height, on either end of the collectors to capture wind speeds across the entire collector.
Data was collected on a minute by minute basis and captured wind speeds in miles per hour (MPH), and
then averaged across each hour.
The evaluation team then compared the results to that of the 10m wind speeds as recorded at the closest
weather station.
13
The average monthly results are presented below in Figure 2-13, along with the
distance in miles between the site and the weather station.
12
Unglazed collectors can lose much more heat due to convection, which is a function of windspeed. Glazed
collectors, like those used in most other budget programs, are much less susceptible to these losses since the
glazing (usually a panel of glass or two) insulate the fluid being heated by the sun from convective/wind driven
losses.
13
The original plan was to install one anemometer at a height of 10m, and another anemometer at the collector
height. However, we were not able to find any facilities in our sample which allowed us to install at the height
of 10m. Use of the nearest weather station, usually at an airport, also provides a more direct comparison the
simulations. The simulations are based on weather from California Climate Zone ‘stations’ that are usually at
airports and can be miles from the site being simulated.
FIGURE
2-12: EXAMPLE OF ANEMOMETER
INSTALLATION

CSI Thermal Technical Report Commercial Pools|2-19
FIGURE 2-13: ANEMOMETER COMPARISONS TO 10M WIND SPEEDS
For Sites A, B, and C, the average wind speed ratio was about 17 percent, with the site-level average
ranging from 11 percent to 24 percent. Looking at photos from these sites, site A has quite a few large
trees nearby and site B is completely blocked on one site by an even larger building right next to the
collectors, which can explain the lower windspeeds. For Site A and Site C, the collectors were installed on
the roof of the pool pump room and restrooms, which is at a lower height than the roof of most buildings
(approximately eight to nine ft high). However, for Site D, the collectors were installed on top of a 3-story
building, which was also at the top of a hill. For comparison, the elevation at this site is over 500 ft plus
the height of the three-story building, while the elevation for the weather station is only 340 ft.
Given the large range in wind speeds seen and the affect that both the surroundings and the collector
height have on the wind speeds seen at the collectors, it is recommended that further research be
conducted so that wind speed may be varied with collector heights.
2.3 SYSTEM COSTS
The evaluation team analyzed system costs for commercial pools that were recorded in the program
tracking data. These costs were compared across the program years, between 2014 and 2017, on a dollar
per claimed equivalent-therms savings basis. The overall cost trend results for all these commercial pool
systems are shown in Figure 2-14 below.

CSI Thermal Technical Report Commercial Pools|2-20
FIGURE 2-14: COMMERCIAL POOL COST TRENDS
* These results are weighted by equivalent therm savings and reflect 2018 dollars.
The graph shows a generally flat trend in total installed costs per therm equivalent savings, except for
2017 where an increase was seen. Only 74 systems were installed in 2017, where other years saw
between 116 and 344 total systems installed. There were several systems which saw very high costs (over
$18/therm), but the percentage of sites with these higher costs seemed relatively consistent with other
program years as well. No clear reason could be determined for the higher 2017 costs, but the higher
2017 costs were seen only in inland pools, rather than those situated in coastal climate zones.
2.4 COMMERCIAL POOL RECOMMENDATIONS
The detailed discussion above provides the basis for the following recommendations made by the
evaluation team. Most of these recommendations were included in the CSI Thermal Program Impact
Report (Itron, 2019).
14
*Recommendation 1 – Update to commercial pool depth assumptions: The program calculators should
incorporate a pool depth when they calculate the savings and incentives for the pools. Because many
pools do not have a consistent depth all the way through, a maximum and minimum depth should be
entered, and an average pool depth calculated.
14
Recommendations with an asterisk (*) next to them were included in the Impact Report.

CSI Thermal Technical Report Commercial Pools|2-21
*Recommendation 2 – Update to commercial pool sheltering assumptions: The baseline pool sheltering
factor should be reduced from three to 0.5. It may be possible to develop questions that ask about the
pool surroundings to see if there is any justification for increasing the pool sheltering factor on a site-by-
site basis.
*Recommendation 3 – Update to commercial pool activity level assumptions: The baseline pool activity
factor should be left at one for most pools. It is plausible that it may be possible to develop questions to
ask the site contact that might be able to further refine the activity levels of the pools, like at a minimum,
asking how often the pool is used during different months of the year. The model also does not consider
an activity level set by season. It is not clear how that might affect savings, or whether the model may be
able to handle this complexity.
*Recommendation 4 – Optimize operational performance for commercial pools: Several
recommendations for future programs could be made here. The first is to require automated pool
controls which optimize auxiliary and SWH heater setpoints and maximize the benefits of the solar
heating. The second would be to require some sort of owner or operator training on how to best operate
the pool heaters or require a maintenance plan where the systems are checked on a regular basis and
issues are discussed to ensure they are being optimally operated. Finally, the savings and incentives
program calculations should incorporate check boxes representing each month of the year for both
auxiliary heating and SWH heating, to determine how the customer believes the system will be operated
year-round.
*Recommendation 5 – Require existing pool heaters: Consider updating program requirements so that
for existing pools, the installation of a SWH system must offset natural gas usage. This could be done by
replacing an existing heater (an older solar hot water heater that is near or at the end of life would be
eligible). Written exceptions could be considered if the customer is truly wanting to try out solar heating
prior to purchasing a natural gas heater, but these are more likely to be the minority and should be
considered on a case-by-case basis.
Recommendation 6 – Consider requiring useful metering for commercial pools above 30 kilowatt-
thermal (kW
th
): Similar to the CSI PV rules, it may be useful to consider requiring useful metering for all
commercial pool applications above 30kW
th
. Similarly, identifying a way to link a portion of the incentives
to this metering will help give pool operators an incentive to make sure that set point temperatures of
the pool are maximizing the amount of solar used to heat the pool, as well as enabling more accurate
inputs into the calculator models. However, the benefit of this needs to be balanced with the added cost
and complexity this requirement would add.

CSI Thermal Technical Report Commercial Pools|2-22
Recommendation 7 – Consider allowing collector height as a calculator input to determine wind speeds:
Given the large range of wind speeds identified, it may be useful to allow collector height as input to the
calculator. Additional research may be needed to attempt to identify a relationship between collector
height and wind speed ratio to 10m wind speeds.

CSI Thermal Technical Report Commercial & Multifamily Residential|3-1
3 COMMERCIAL & MULTIFAMILY RESIDENTIAL
Commercial and multifamily facilities made up approximately 25 percent of the systems installed through
the end of 2017, and around 59 percent of the total savings claimed through the program. Over 95
percent of the systems were indirect forced circulation (IFC) systems, with almost 75 percent of them
utilizing glycol freeze protection and the remaining 25 percent of them utilizing drainback systems as the
freeze protection option. An IFC system is a closed system with a heat exchanger that can be configured
with either glycol (usually propylene glycol that serves as antifreeze) or drainback freeze protection. A
pump circulates the heat transfer fluid from the panels to the heat exchanger, and a second pump may
circulate water from the tank to a heat exchanger. Antifreeze systems use glycol as the heat transfer fluid
whereas drainback systems have an additional tank that allows water to drain out of the collectors to
protect the system from freezing and overheating. An example of the different IFC configurations can be
seen below in Figure 3-1.
FIGURE 3-1: INDIRECT FORCED CIRCULATION SYSTEM CONFIGURATIONS
There were also a small number of integral collector storage (ICS) systems installed. These are passive
systems, meaning that they do not require pumps or controls, and rely solely on natural convection to
circulate the water. An ICS system, commonly known as a “batch” system, combines the collector and
storage tank into a single unit. Large black tanks or tubes are housed in an insulated box, which preheat
cold water from the municipal supply as it passes through on the way to the auxiliary water heater. The
ICS systems work best in warm climates with evening water heating loads as the hot water is stored
outside and can quickly lose heat over night or during cloudy conditions. Figure 3-2 below shows an
example of an ICS system.

CSI Thermal Technical Report Commercial & Multifamily Residential|3-2
FIGURE 3-2: INTEGRAL COLLECTOR STORAGE DIAGRAM
3.1 EVALUATION FINDINGS
Commercial and Multifamily Residential budget programs installed 1,580 systems between 2010 and the
end of 2017. At the end of 2017, these budget programs were found to save almost 2.5 million therms
annually. The evaluation team surveyed and installed metering at a sample of 60 commercial and
multifamily systems. As seen from Figure 3-3 below, the savings, at a project level, vary wildly for
individual systems. The evaluation sample saw a range of claimed savings between 128 therms and
33,985 therms.

CSI Thermal Technical Report Commercial & Multifamily Residential|3-3
FIGURE 3-3: COMMERCIAL AND MULTIFAMILY SAMPLE – EVALUATED AND CLAIMED SAVINGS
* This graph has been capped at a maximum of 14,000 therms so that it is easier to see the individual site-level results. Two
sites in the evaluation sample saw savings that exceeded 14,000 therms.
The program claimed savings were calculated using the Commercial and Multifamily Residential Incentive
Calculator.
1
This calculator is based on TRNSYS software to model each system and produce an incentive,
based on conventional energy displaced by solar energy. One of the key developers of TRNSYS, TESS,
collaborated with the CSI-TPAs to create the incentive calculator for this program.
The three major factors listed below were found to contribute to the majority of the differences between
the expected savings and the actual, evaluated savings.
System Performance Issues: This category includes factors such as low solar usage, system
outages, poorly set pump control thresholds, shading and soiling.
Water Usage: This is a major driver of expected savings, so changes in water usage from what is
expected results in large changes in actual savings.
Updates to TRNSYS Models: The user inputs into the models were specified by contractors or
customers. This included SWH system configurations and set up. The evaluation team identified
issues with some user inputs that did not reflect the realities of the system.
1
https://www.csithermal.com/calculator/commercial/. Accessed on 02/06/2019.

CSI Thermal Technical Report Commercial & Multifamily Residential|3-4
3.1.1 System Performance Issues
System performance issues are defined as cases where the system is performing differently than
expected, even after accounting for changes in water usage or TRNSYS models. Looking at individual site-
level metering data, there are many different reasons for why sites may perform differently than
expected, including low solar usage, system outages, poorly set pump control thresholds, shading, soiling,
etc. Several examples from the data are discussed below.
System Outages
A number of sites experienced some sort of system outage during the metering period. In some cases,
the system went down and came back online at a later date, but in other cases the system seemed to stop
functioning and never come back online during the metering period. In most instances the site contacts
never reported any issues with the system when our engineers went out to pick up the metering
equipment.
One example is shown below in Figure 3-4. In November 2017, the system pump stopped running and
didn’t turn back on the remainder of the metering period. This site’s metered data showed no change in
water temperatures from November 2017 onwards.
FIGURE 3-4: EXAMPLE OF SITE WITH SYSTEM OUTAGE

CSI Thermal Technical Report Commercial & Multifamily Residential|3-5
In a second example, a 20-unit apartment complex estimated that they had a water heating load of 800
gallons per day (GPD). However, for the first 10 months during the data collection period, the system
averaged less than one tenth of that, showing around 75 GPD. The system was only found to run less than
two hours per day on average in 2017. However, starting in 2018, the system appeared to operate an
average of almost 16 hours a day for the next four months. The average flow rate during these months
ranged from 782 GPD to 2215 GPD. In discussions with the site contact, it was determined that the system
had a bad check valve on the cold-water supply side, and no solar energy was being supplied to the system
in 2017. Once this was identified and fixed, around January 2018, the system was back up and operating
again. The monthly system performance is shown below in Figure 3-5.
FIGURE 3-5: EXAMPLE OF SITE WITH MONTHS OF DOWNTIME PRIOR TO SYSTEM REPAIR
There were also several facilities where the site contacts identified issues that they had with the systems.
At two facilities, pumps had failed. Another facility was found to have the system controller ripped out of
the wall, although there was no explanation as to why or how this happened. And at two other facilities,
the system was found not to be operating when the engineers arrived onsite. However, at all of these
facilities, the overall system performance did not seem to be affected, as the site contacts were aware of
the issues and able to fix them quickly.

CSI Thermal Technical Report Commercial & Multifamily Residential|3-6
Soiling
Another potential reason for some of the system performance issues seen could have to do with panel
soiling. According to research performed by PowerLight,
2
PV systems in regions with significant rainfall
were not affected in any measurable way by soiling but systems in California and the Desert Southwest
regions all suffer from gradual decline in performance, between 1.6 percent to 6.2 percent varying by
region and environment. Although this technology is slightly different than PV technology, we expect to
see similar results.
The onsite engineers reported differing levels of soiling for many of the facilities in the
Commercial/Multifamily Residential and Low Income Multifamily Residential facilities, shown in Table 3-1.
The evaluation team could not definitively identify the impacts of soiling due to larger impacts from other
variables like changes in water usage and system outages. Soiling largely impacts systems in the late
summer and early fall with the winter rains usually cleaning the panels off.
TABLE 3-1: ONSITE ENGINEER SOILING DETERMINATION
Budget Program High Medium Low None
Commercial / Multifamily Residential 4 11 10 1
Low Income Multifamily Residential
11
4
4
-
Customer Perception of Performance
One interesting finding is that out of the 29 commercial / multifamily facilities with actual saving less than
half of expected savings, two thirds of the host customers reported having no issues with their SWH
systems. This indicates that customers are either not familiar with their SWH systems or that the expected
savings were far higher than they should have been. The engineers also reported that their contact at
one facility had no idea they even had solar water heating. These results were split evenly across the two
budget programs, Commercial/Multifamily Residential and Low Income Multifamily Residential, with nine
customers in both programs whose actual savings were less than half of the expected savings reporting
no system issues.
Several interesting conversations resulted during the engineer onsite and meter installation visits. At the
time of the onsite and meter installation, one facility (counted as two separate sites), reported that they
had just completed $10k worth of maintenance on their systems, however the metered results showed a
combined realization rate across the two sites of only 41 percent. As this maintenance was performed
prior to the evaluation team’s installation of the metering equipment, it was not possible to say what
2
Kimber, Mitchell, Nogradi, and Wenger. The Effect on Soiling on Large Grid-Connected Photovoltaic Systems in
California and the Southwest Region of the United States. IECC. 2006.

CSI Thermal Technical Report Commercial & Multifamily Residential|3-7
impact the maintenance had on system performance. Another site saw very little flow up to the collectors
even though the customer reported no issues. And there were several sites where the onsite engineers
reported leaks, but the customer was unaware with any system issues.
These findings suggest that it may be beneficial to engage with customers further and make them
aware of how to check for maintenance issues and aware of how the system should operate. Providing
incentivized maintenance plans along with metering abilities to ensure system performance may be useful
to customers.
3.1.2 Water Usage
Therm savings attributed to SWH systems are highly dependent on water heating loads and savings cannot
exceed the water heating load. Site specific water heating loads varied greatly from the expected loads
entered in the calculator. This may be due in part to the calculator defaulting to the maximum gallons
per day based on building type. In 85 percent of apartments where water heating load was estimated,
the estimated water heating load matched the maximum gallons per day guidelines as specified by the
CSI-T Program Handbook and shown below in Table 3-2. This suggests that contractors or building
managers who are entering their information into the rebate calculator either do not have a good handle
on what their hot water usage is or realize that the incentive is tied to usage and therefore are entering
the maximum allowable value.

CSI Thermal Technical Report Commercial & Multifamily Residential|3-8
TABLE 3-2: MAXIMUM GALLONS PER DAY GUIDELINE TABLE
3
Type of Building Gallons Per Day
Apartments/Condos (Number of Units)
2 to 20
42 per unit
21 to 50 40 per unit
51 to 100 38 per unit
101 to 200
37 per unit
201 plus
35 per unit
Restaurants
Meal Service Restaurants
2.4 per full meal served per day
Quick Service Restaurants
0.7 per meal served per day
Other Building Types
Student Housing
13 per person
Military Barracks
13 per person
Hotels/Motels
15 per unit
Retirement/Nursing Homes
18 per bed
Office Building
1.0 per person
Elementary Schools
0.6 per student
Junior and Senior High Schools
1.8 per student
Coin-op Laundries
2 per pound of laundry washed per day
Additionally, the calculator’s maximum values come from the American Society of Heating, Refrigeration,
and Air-Conditioning Engineers (ASHRAE)
4
handbook which is noted to have pre-dated low flow fixtures
and handbooks. This suggests that the maximum water usage table may over-estimate hot water load,
especially in states like California which has suffered major droughts and has operated under mandates
to reduce water usage across many regions.
Revising the maximum allowable table in the program handbook to reflect an “average default value”
may help to alleviate the number of customers entering in the maximum value and require users to actually
look into and understand their hot water demand. Further research into how water loads for Commercial
and Multifamily facilities (prioritizing Multifamily facilities) is warranted to get a better grasp on an
average default hot water load that should be used to estimate savings.
3
Maximum gallons per day guidelines from the California Solar Initiative – Thermal Program Handbook. Appendix
E. Table E1. These are noted to be based on the ASHRAE Handbook.
https://www.gosolarcalifornia.ca.gov/documents/CSI-Thermal_Handbook.pdf
4
American Society of Heating, Refrigeration, and Air-Conditioning Engineers (ASHRAE) is a global professional
association.

CSI Thermal Technical Report Commercial & Multifamily Residential|3-9
Water Draw Profiles
The CSI-T program administrators created water draw profiles by building type to be used in the TRNSYS
simulations. Seventeen different profiles were created, yet the facilities sampled by the evaluation team
only fell into five of these categories; Apartments, Food Services, Men’s Dorms, Military Barracks, and
Coin Operated Laundry. The only category where there were enough sample points to perform an analysis
of flow rates was commercial and multifamily facilities. For the facilities where the evaluation team
installed flow meters, the percent of annual flow was analyzed by month to determine whether there was
a general change in flow by month, shown below in Figure 3-6. While winter and spring months saw a
slightly higher increase in water load than summer and fall months, for the most part, the variation in
each sampled site across the year cancelled each out to create a relatively flat annual profile. This is
consistent with the assumptions made by the TRNSYS profiles, which assume the same daily load shape
for all months.
FIGURE 3-6: WATER HEATING LOAD COMPARISON FOR PRIMARY BUILDING TYPES IN SAMPLE
The annual average hourly comparisons for the simulated versus metered apartment buildings are shown
in Figure 3-7. The metering data generally validates the profiles used by the TRNSYS models for
apartments. The metering data found that morning peaks were a little earlier than modeled, and the
evening peaks were slightly higher, but in general the two profiles matched up well. Eighty-four percent
of the total 1,581 facilities in the commercial and multifamily budget programs were noted to have a load
profile of apartments/condos. In the sample, 48 of the total 59 sample points were identified as
apartment buildings. Apartments/Condos made up almost 85 percent of the commercial and multifamily
budget programs population.

CSI Thermal Technical Report Commercial & Multifamily Residential|3-10
FIGURE 3-7: ANNUAL AVERAGE WATER HEATING LOAD COMPARISON FOR PRIMARY BUILDING TYPES IN SAMPLE
Low Solar Water Usage
There were a number of facilities in the sample which experienced much lower flow rates than what was
expected. In some cases, the evaluation team were able to determine the reasons for the overestimated
flow rates. This overestimation of water usage led to higher expected water loads which resulted in
overestimation of savings.
One example of a site that experienced low water usage was multifamily facility where the SWH served
their laundry room, with an estimated load of 150 pounds of laundry per day. The calculation used the
maximum value of two GPD for every pound of laundry washed per day to estimate water heating load,
5
for a total GPD of 300. The evaluation team identified that this SWH system served four of the washing
machines, and assuming a weight of about seven pounds per load of laundry, that would assume that
each one of these machines was used about five to six times every day, or a total of about 21 loads of
laundry a day. In reality, only about two to three loads of laundry were found to be washed every day
across those four machines served by the SWH system. The apartment complex had 10 other washing
machines (not served by solar) at the facility which is likely the reason for the overestimated flow rates.
5
From Appendix E in the CSI-Thermal Program Handbook.

CSI Thermal Technical Report Commercial & Multifamily Residential|3-11
3.1.3 Updates to TRNSYS Models
Configuration Updates
Unlike the other budget programs, where almost every installation fit neatly into the original
configurations, the commercial/multifamily systems routinely had systems that didn’t quite fit into the
original configurations. To account for this impact on the savings, the evaluation team modified many of
the original configurations to account for the differences. There were 28 of 59 Commercial/Multifamily
facilities that had changes to their system configurations. The most common differences included:
Location of where water that is recirculated in the building was assumed to re-enter the
SWH/domestic hot water (DHW) system,
Changing the location and existence of tempering values that mix cold water to temper hot water
from the auxiliary or solar tanks to not exceed a set point,
Introduction of mains water directly to the collector heat exchanger instead of into the solar
storage tank,
Other less common changes that occurred included:
Control modifications to direct the solar-heated water to the auxiliary tank directly,
The use of wrap-around heat exchanger tanks instead of external or immersed heat exchangers,
Multiple solar collector arrays,
The connection of the storage tanks from parallel connections to series connections.
System configuration issues were found to reduce savings by as much as 63 percent in the sites the
evaluation team analyzed. The system configurations able to be selected in the program calculator reflect
systems that are designed and operated as they should be. However, with systems as complicated as
SWH, conditions found at the site may not always allow for the systems to be configured as planned or
intended. Some of these changes introduced potential safety issues, like the lack of tempering valves, or
tempering valves installed in the wrong place. Other changes significantly affected the performance of
the system, like the introduction of mains water directly into the heat exchangers.
Providing a check-list to installers and those applying for rebates may help to eliminate some of these
more common configuration issues. This check-list should include things like “ensuring existence of
tempering valves after the output from the heat exchanger or the auxiliary heating element”, or “verifying
that main water does not feed directly into the heat exchanger”.

CSI Thermal Technical Report Commercial & Multifamily Residential|3-12
Onsite Findings
There were multiple system details that were confirmed by the engineers during their onsite visit,
including:
Solar collector model,
Total number of collectors and number of collectors in series,
Collector tilt and azimuth,
California Climate Zone (location),
Type of Building (used to set the DHW draw profile),
Recirculation loop for hot water (yes or no),
Type of system (# of tanks, location and type of heat exchanger, auxiliary heat source, freeze
protection, etc.),
Solar storage capacity (number of tanks and total volume),
Auxiliary water heater capacity (number of tanks, total volume, and total auxiliary heating
capacity), and
Set-point for auxiliary heater and for delivered water (tempering setting).
While the overall effect of these changes made very little difference to the overall sample savings, the
evaluation team found numerous systems that needed one or more of these details adjusted.
3.2 COMMERCIAL/MULTIFAMILY SYSTEM COSTS
The evaluation reviewed the commercial and multifamily system costs recorded in the program tracking
system. These costs were compared across the program years, between 2010 and 2017, on a dollar per
expected equivalent-therms
6
savings basis. The overall cost trend results for all these commercial and
multifamily systems are shown in Figure 3-8 below.
6
Electric and propane displacing systems were converted to the equivalent energy offset of natural gas.
However, very few Commercial/Multifamily systems did not offset natural gas.

CSI Thermal Technical Report Commercial & Multifamily Residential|3-13
FIGURE 3-8: COMMERCIAL AND MULTIFAMILY COST TRENDS
* These results are weighted by equivalent therm savings.
** Included costs for all Commercial/Multifamily, Low Income Multifamily, and Multifamily Disadvantaged Communities budget
programs. Costs have been adjusted for inflation.
The graph shows that an overall reduction can be seen in commercial and multifamily system cost. In
2010, the weighted costs starting at $50 per expected therm, and saw approximately a four percent
decrease in costs every year. By 2017, the costs had dropped almost 30 percent, down to about $36 per
therm. While this does indicate an overall downward trend in program costs, digging into the data further
demonstrates that the decreasing program cost appear to have more to do with an increased number of
lower cost drainback systems going in rather than a significant decrease in system costs. Figure 3-9 below
shows that the while the cost per expected therm may be decreasing for drainback systems, it also
appears to be highly variable year over year. The large increase in 2017 drainback systems is the main
driver of the lower overall 2017 program costs (seen in grey below). The higher cost glycol systems appear
to see only a minor decrease in system costs since program inception, and have actually increased over
the last three years of the program.

CSI Thermal Technical Report Commercial & Multifamily Residential|3-14
FIGURE 3-9: INDIRECT FORCED CIRCULATION GLYCOL VS. DRAINBACK MEAN COSTS BY PROGRAM YEAR
* These results are weighted by equivalent therm savings. Costs have been adjusted for inflation.
3.3 COMMERCIAL/MULTIFAMILY SYSTEM PUMP POWER
Pump details were collected for almost 50 commercial and multifamily facilities in the sample. The
evaluation team determined the number of solar pumps for each system, along with the rated wattage.
With the exception of a few sites, systems with external heat exchangers were found to have two solar
pumps, while those with internal heat exchangers usually utilized a single solar pump. Maximum rated
pump power was looked up via make and model lookups. The average maximum rated pump power
across the sampled sites was found to be almost 200 Watts (W), with individual pumps ranging from about
70 W up to 600 W. Given that some systems had multiple solar pumps while others had one, the average
maximum rated pump power across all solar pumps at a site was closer to 300 W.
When comparing drainback and glycol systems, glycol systems were found to have, on average, a total
pump power of closer to 300 W, while drainback systems had an average pump power of 225 W. The
power per expected therm saved for glycol systems was also almost twice as high as that for drainback
systems, at about 0.35 W/therm for glycol systems, and 0.20 W/therm for drainback systems. Drainback
systems were in general slightly smaller than glycol systems, averaging just over 27 kW
th
, while drainback
systems averaged just over 23 kW
th
. These stats can be seen below in Table 3-3.

CSI Thermal Technical Report Commercial & Multifamily Residential|3-15
TABLE 3-3: SOLAR PUMP SAMPLE FINDINGS
System Type Count
Average Power
(W)
Average
Capacity
(kW
th
)
Average Power per
Expected Therms
Saved (W/Therm)
Indirect Forced Circulation - Glycol (IFG)
41
302
27.67
0.35
Indirect Forced Circulation - Drainback (IFD)
6
225
23.43
0.30
Total
47
292
27.13
0.35
* Drainback systems will have to overcome gravity to send the water up to the collectors, whereas a closed glycol system is
pressurized and therefore does not require as large of a pump. Therefore, one would expect that the average power of
drainback pumps to be higher than that of glycol pumps. It is possible that the small sample size is a reason for this
discrepancy, but it may also indicate that glycol pumps are oversized.
3.4 GLYCOL STABILITY
Glycol is used as an overheat and freeze protection fluid in SWH systems but can add complexities in
system design. They require use of a heat exchanger and a glycol pumping station to control the flow of
glycol through the system. These also require expansion tanks to maintain pressure in the system,
temperature controls and heat dump stations to ensure systems don’t overheat, and check valves to
ensure systems don’t freeze. Additionally, degradation will start to occur when temperatures that are too
high, typically over 250 to 350 ºF or if air finds its way into the lines.
A mixture of propylene glycol and water is commonly used for most SWH systems as it is considered safe
and nontoxic, which is required for use around DWH systems. It is important to manage the mixture as
too much water in the mixture can lead to freezing of the system fluid, while too much glycol in the system
can lead to reduced heat transfer efficiency. A pH scale is used to determine the level of acidity or
alkalinity of water-based solutions are. Lower pH values are more acidic while higher pH values are more
basic. At room temperature, pure water is neither acidic nor basic, and holds a pH value of seven. The
DowFrost Engineering and Operating Guide
7
states that control of pH between eight and ten is important
to minimize the acidity of the fluid. Values below eight require adjustments to the solution. Any fluid
with a pH below seven should be replaced and the system should be drained and flushed. Acidic glycol
solutions will cause corrosion of the system piping.
Glycol was tested at a sample of 11 commercial and multifamily facilities, once when the metering
equipment was installed, and again when the metering equipment was removed. The results are shown
below in Table 3-4.
7
http://msdssearch.dow.com/PublishedLiteratureDOWCOM/dh_010e/0901b8038010e417.pdf

CSI Thermal Technical Report Commercial & Multifamily Residential|3-16
TABLE 3-4: GLYCOL TESTING RESULTS
Site
Number
Install
Year
First Test
Second Test
Date pH Level
Years Since
Install
Date pH Level
Years Since
Install
1
2012
7/18/2016
7.14
4
1/9/2019
7.16
7
2
2011
7/21/2016
9.67
5
1/11/2019
12.33
8
3
2011
7/21/2016
8.58
5
1/11/2019
8.74
8
4
2013
7/20/2016
8.77
3
1/12/2019
6.91
6
5
2011
8/16/2016
8.68
5
1/16/2019
8.57
8
6
2015
6/30/2016
8.84
1
1/16/2019
8.00
4
7
2015
7/19/2016
8.20
1
1/22/2019
8.25
4
8
2013
7/14/2016
8.48
3
1/23/2019
6.89
6
9
2013
10/17/2016
8.44
3
1/23/2019
7.98
6
10
2015
7/14/2016
8.19
1
1/23/2019
9.33
4
11
2011
8/15/2016
8.59
5
1/25/2019
7.74
8
* Sites with a pH level outside of the acceptable range (less than 8 and greater than 10) have been highlighted above.
Originally, there were 10 out of the 11 sites where the pH levels were within the recommended eight to
ten range. Over the course of about 2.5 years between the first test and the second test, this number
dropped to only five systems. Out of those remaining five systems, site number two saw a spike in the pH
level to the verge where it was about to become caustic. Two sites (four & eight) had dropped just below
seven to where the entire glycol system should be flushed, and the fluid replaced. And two sites (nine &
eleven) were just below the recommended base level of eight and required adjustments to their pH levels
to increase the value back up to eight or higher. The evaluation team also identified four other sites were
glycol was leaking from the pump station. Leaks from the systems will introduce oxygen into the systems
and cause corrosion.
Ensuring that the glycol within these systems is properly maintained and replaced on a regular basis
is crucial to the life expectancy of these systems. Lack of maintenance in the glycol systems can very quickly
cause major issues for system and system operators. It is recommended that training for glycol systems
and regular testing be part of an ongoing scheduled maintenance plan.

CSI Thermal Technical Report Commercial & Multifamily Residential|3-17
3.5 PERFORMANCE DATA PROVIDER (PDP) EVALUATION
Program Performance Data Providers (PDP) refer to service providers that monitor and report the energy
delivery data from the SWH system to the PAs. The data serves as the basis for quarterly incentive
performance-based incentive (PBI) payments. The minimum data required for reporting, according to the
CSI-T Program Manual,
8
includes date and time, total BTUs delivered and back-up energy consumption
for one-tank systems, solar BTUs delivered for two-tank systems, and then a variety of other parameters
like temperatures, pump run times, gallons of hot water consumed, among others, if available. The PDP
provider is required to sample flow and temperature sensors every ten seconds and record all required
solar performance data at least every 15 minutes. The CSI-T program requires customers with a SWH
capacity greater than 30kW
th
to install Consumer Performance Metering (CPM) for a period of five years
from the start of operation. In the sample, 71 percent of the commercial pool facilities and 55 percent of
the commercial/multifamily facilities met this requirement for CPM metering. A similar program
requirement is PBI metering, which requires that all SWH systems with a capacity greater than 250 kW
th
(excluding commercial pools) or systems designed for process heat, solar cooling, space heating, or a
combination of these, take a PBI. To do this, the performance at a site is to be measured by a BTU meter.
There were five sites in the entire program population that met these criteria. However, the requirements
for PBI metering have evolved over time.
The engineers attempted to collect the logged data at 31 of the CPM facilities and discovered that
although the metering equipment was in place, only three facilities actually had a memory card installed
to log the data. Two of these facilities were pools, and one was a Multifamily site. This represents a lost
opportunity for additional data at minimal cost.
A similar finding was discovered when the evaluation team attempted to collect the PBI metering data,
and data for only two facilities was available.
For one of the two PBI sites, interval metering data was provided, along with a calculation of energy
savings for each time interval. The energy savings appears to be calculated using the following formula:
=
× 1.219512
No information was provided on how the factor of 1.219512 was calculated or where it was derived from.
The other site did not provide energy savings calculations along with the raw metered data.
8
http://www.gosolarcalifornia.ca.gov/documents/CSI-Thermal_Handbook.pdf

CSI Thermal Technical Report Commercial & Multifamily Residential|3-18
3.6 COMMERCIAL AND MULTIFAMILY RESIDENTIAL RECOMMENDATIONS
The detailed discussion above provides the basis for the following recommendations made by the
evaluation team.
Recommendation 1 – Consider providing incentives for maintenance plans and metering equipment
and ensure facility maintenance personnel are fully trained on the system operation: A potential
alternative would be to require maintenance plans for at least larger systems. This should include training
for maintenance and periodic testing of the glycol systems. Several sites in the sample saw very poor
performance, due to limited solar usage, technical system issues, or customers completely unaware of
the system existence. Many of the facilities where poor performance was identified had customers which
reported no issues with the system. This could indicate that many operators are unaware of how the
system performs, and facilities could benefit from creative ways to ensure the customer is fully engaged
with the system operation.
Recommendation 2 – Further research into how water loads for commercial and multifamily facilities
(prioritizing multifamily facilities) is warranted to get a better grasp on actual hot water load that should
be used to estimate savings: The calculator’s maximum values come from the ASHRAE handbook which
is noted to have pre-dated low flow fixtures and handbooks. This suggests that the maximum water usage
table may over-estimate hot water load, especially in states like California which has suffered major
droughts and has operated under mandates to reduce water usage across many regions.
Recommendation 3 – Establishing a more appropriate average default value will help ensure that
incentive calculations are not based on a maximum hot water load: Eighty-five percent of apartments
receiving SWH incentives used the maximum allowable table in the program handbook to estimate their
hot water demand. This is in spite of the fact that the tables have the footnote that states that “The GPD
table is only a maximum justification and predates low-flow fixtures and appliances. Data should not be
used for sizing requirements.”
Recommendation 4 – Providing a check-list to installers and those applying for rebates may help to
eliminate some of these more common configuration issues: It is not clear whether many of these
configuration issues are due to site-specific conditions which require system adaptations to ensure the
system will fit in the existing space, or if some best practices are being overlooked. Some configuration
issues result in potential safety issues, while others result in poor performance. Alerting installers to these
more common issues may be beneficial to reducing these occurrences.
Recommendation 5 – Consider requiring useful metering for many commercial and multifamily systems:
Similar to the CSI PV rules, it may be useful to consider requiring useful metering for all commercial and
multifamily applications above 30kW
th
. Similarly, identifying a way to link a portion of the incentives to

CSI Thermal Technical Report Commercial & Multifamily Residential|3-19
this metering will help give system operators an incentive to make sure that more accurate inputs into
the calculator models and that system outages are easily identified and fixed. Additionally, this should
provide feedback to the participants when issues occur that need to be fixed to ensure optimal
performance.

CSI Thermal Technical Report Single Family Residential|4-1
4 SINGLE FAMILY RESIDENTIAL
The single family budget programs
1
make up the majority of systems by count (62 percent) installed of
the entire program. Due to their relatively smaller system size they only made up eight percent of the
total savings expected through the program. Similar to commercial and multifamily systems, single family
residential systems were made up of primarily indirect forced circulation (IFC) systems or integral collector
storage (ICS) systems. Over 60 percent of the systems were identified as IFC systems with approximately
75 percent of them utilizing glycol freeze protection, and the remaining 25 percent of them utilizing
drainback systems as the freeze protection option. An additional 35 percent of systems were identified
as ICS systems, with the majority of them being direct systems which use potable water directly through
the collectors. A small percentage of these were indirect systems, which utilize a glycol loop and a heat
exchanger.
4.1 EVALUATION FINDINGS
The Single Family Residential budget programs installed 3,883 systems between 2010 and the end of 2017.
At the end of 2017, these three budget programs were found to save 168,368 therms annually. The
evaluation team surveyed and installed metering at a sample of 19 single family and low income single
family facilities. As shown in Figure 4-1, the project level claimed savings hovered around 100 annual
therms while the evaluated savings were typically found to be closer to 50 annual therms.
Note this evaluation does not include analysis of the four low income single family (LISF) systems. The
LISF Residential budget program changed significantly in the types of systems installed since the beginning
of the evaluation. At the time when the sample was drawn, all sampled systems in the LISF Residential
budget program utilized unglazed collectors, as that is what 100 percent of the systems in the budget
program between 2013 and 2015 had installed. These unglazed collectors are typically used for pool
heating due to lower costs and good low temperature performance (heating pools to only approximately
80 degrees). However, glazed systems have an advantage over unglazed systems, as the glazing material
helps trap heat in the collector, reducing heat losses back to the environment and can reach much higher
temperatures. These unglazed systems were discontinued for the LISF program after 2015. Systems
installed in 2016 and 2017, that are based on glazed ICS systems, currently make up 77 percent of the LISF
program’s population and the evaluation team recognizes that the metered sample is no longer
representative of the population. Therefore, the evaluation team has not reported the evaluated LISF
sample results.
1
Single Family Residential, Low Income Single Family Residential, and Single Family Residential – Disadvantaged
Communities.

CSI Thermal Technical Report Single Family Residential|4-2
FIGURE 4-1: SINGLE FAMILY SAMPLE – EXPECTED AND EVALUATED SAVINGS
The program expected savings were based on the savings specified by the SRCC
2
as required by the
program.
3
These savings were then modified using the CSI-T Incentive Calculator,
4
to allow for minor
customization of savings based on zip code, backup water heater type, azimuth, tilt, and annual average
access to sun from this solar array. This calculator is based on TRNSYS software to model each system
and produce an incentive, based on conventional energy displaced by solar energy.
Based on the evaluation, the team identified two main drivers that produced significant discrepancies in
the savings expected through the program to the site-specific findings that the team identified.
4.1.1 Updates to SRCC Models
Unlike commercial pool and commercial / multifamily SWH systems, the residential SWH system rebates
are not based on a customized TRNSYS engine written for the CSI-T program. Instead, these rebates are
based upon published annual ratings (savings) for the SWH system by the SRCC. These ratings are based
on the location of the system and are calculated from a TRNSYS-based simulation engine operated by
SRCC. The ratings are calculated from a number of different input parameters, including an ASHRAE
2
The SRCC is the leading solar heating and cooling product certification in North America. http://www.solar-
rating.org/index.html
3
Decision 10-01-022. http://docs.cpuc.ca.gov/PUBLISHED/FINAL_DECISION/112748.htm#P80_1949
4
https://www.csithermal.com/calculator/. Accessed on 02/06/2019.

CSI Thermal Technical Report Single Family Residential|4-3
standard water draw profile of 64.3 gallons per day, installed collector slope and azimuth, location, and
an annual average access to the sun. As the rating system is proprietary to SRCC, the evaluation team
does not have access to the system models in order to directly estimate the performance at different daily
draw amounts, or account for site specific installation differences. However, several years ago, the
National Renewable Energy Laboratory (NREL) hired TESS to create a residential SWH modeling tool that
might eventually replace the current SRCC tool. To that end, system models were created in TRNSYS for
hundreds of different SWH configurations that are on the market today. However, it is important to note
that the ratings used to calculate CSI-T rebates for residential SWH systems that are currently posted on
the SRCC website are based on the SRCC-proprietary engine. With a simulation engine capable of
replicating the set of conditions mandated by SRCC (with a few notable exceptions like the mains water
temperature), the evaluation team is able to closely estimate the ratings for the systems that were
installed under the CSI-Thermal program using the new modeling tool. It’s critical to note that the
“ratings” that calculated here are NOT to be considered SRCC ratings and should be referred to as
estimated ratings. Only SRCC can generate official SRCC rating for residential SWH systems. Details on
each system design were found from manufacturer’s websites and from the SRCC website (number and
type of collectors, size of the storage tanks, types of heat exchanger etc.).
The primary update being made to the single family SRCC models is to refine assumptions for wrap-around
heat exchangers. These types of heat exchangers are a form of double-walled, liquid-to-liquid heat
exchanger, where a tube is wrapped around and bonded to the outside of the hot water tank. The heat
exchanger tubing is one wall and the tank wall is the second. Other types of heat exchangers are
immersed directly in the water tank so only a single wall separates the heat transfer fluid from the potable
water. Double-walls provide an additional level of safety in the event of leaks, to ensure that the heat-
transfer fluid does not leak into the potable water, but this also may result in reduced heat transfer
efficiency. In the sample of single family SWH systems, there were six wrap-around heat exchangers
identified. The new models for wrap-around heat exchangers reduced the potential expected energy
savings as they were revised to capture the observed physics of the flow through the heat exchanger
tubing. Ideally, heat exchangers should be designed to ensure they create turbulent flow, resulting in the
highest amount of heat transfer, but most wrap around heat exchangers appear to have laminar flow.
These six homes saw a reduction in their evaluated savings of almost 20 percent due to these updates.
The ratings are generated for standardized conditions and loads and are intended to facilitate the direct
comparison of different systems under identical circumstances and not necessarily appropriate for
determining absolute energy savings. To estimate energy savings for a given project, the performance
must be evaluated under the specific hot water usage, installation details (slope, orientation and shading),
control settings, piping length, and tank location for that particular project. These details can result in
significant differences from the conditions used for SRCC performance ratings, both positive and negative.
A useful analogy for these ratings is the EPA fuel mileage ratings for autos. The ratings allow direct

CSI Thermal Technical Report Single Family Residential|4-4
comparison between models, but the actual fuel mileage that a car owner experiences will vary depending
on a wide range of variables.
To date, the program has operated under the assumption that AB 1470 and CPUC Decision10-01-022 have
required the use of OG-300 savings ratings, and therefore has used the SRCC OG-300 assumptions. Per
discussions with the PAs, it appears this legislation may only require the use of OG-300 certified
equipment, but not the use of all SRCC assumptions.
While the SRCC OG-300 ratings serve as a useful source of potential savings, it is clear that a method
of incorporating additional site-specific findings will result in a better estimate of savings. Discussions with
SRCC to confirm that updating savings assumptions will not nullify the SRCC certification for the equipment
is required before any additional steps may be taken. If a new residential SWH modeling tool is developed,
it may be beneficial to consider whether it will provide more accurate and site-specific savings for
residential systems.
4.1.2 Water Heating Load
ASHRAE 118.2, Method of Testing for Rating Residential Water Heaters, specifies that the average
residential flow rates of water heaters, in GPD, is to be 64.3, spread out across six daily water draws of
10.7 gallons. The SRCC rated energy savings are based on this daily water draw. However, the evaluation
team found that 11 of the 19 sites where we analyzed the water draw showed less than half of the daily
GPD that was expected, and only three sites had right around the expected daily flow of 64.3 GPD.
Calculation of flow rates was straightforward for sites where the evaluation team installed flow meters.
The installed flow meters captured the actual water draw, and a daily average was calculated based on
the actual metered data. However, for facilities where the enthalpy-based metering devices were
installed, no real water draw was measured. The evaluation team utilized the data recorded by the
enthalpy-based metering equipment to calculate energy flows into and out of the tank on a daily basis.
These measured daily energy flows into the tank, which included both the auxiliary heat and the solar
energy, were compared to the same energy flows produced by the simulation model. The daily water
draw in the simulation model was finally adjusted until the modeled average daily energy flows closely
matched the metered daily energy flows for the entire measurement period.
The evaluation team reviewed the average daily flow rates for each of the single family and LISF homes in
the sample. A simple graph was produced to confirm that there appeared to be a basis for the claim that
the flow rates seemed to vary by the number of people in the household. Although no strong correlation
was identified for these facilities, there was a definite trend, with households with more people typically
seeing a higher flow rate. These results are displayed below in Figure 4-2.

CSI Thermal Technical Report Single Family Residential|4-5
FIGURE 4-2: COMPARISON OF SINGLE FAMILY FLOW RATES VERSUS THE NUMBER OF PEOPLE IN THE HOUSE
The evaluation team notes that there were three facilities that were left out of this analysis, as they
displayed extreme outliers. One household had two people and saw an average flow rate of 61 GPD, while
another household had 12 people, but only showed an average flow rate of 26 GPD. There was also a
third facility claimed as a single family household but was in fact a multifamily facility with 18 people. This
facility saw an average flow rate of 344 GPD. Research conducted by Gas Technology Institute (GTI)
5
analyzed hot water demand and efficiency implications. Their field monitoring activities of residential
water usage in California homes found that the average hot water consumption of sampled facilities was
56.4 GPD. This averaged out to 15.6 GPD per person. The study also determined that despite occupancy
levels which were found to be above the national census average household size, the annual hot water
recovery load averaged 27,200 Btu/day. For comparison purposes, the Department of Energy (DOE)
Energy Factor (EF) test procedure, which calculates the estimate of 64.3 GPD estimates hot water recovery
load is about 3 times higher than what GTI found, due to warmer cold-water inlet temperatures, lower
water heater outlet temperatures, and lower overall hot water consumption.
The evaluation team also reviewed the California Title 24 Approved Compliance Modeling (ACM), which
cites a paper titled California Residential Domestic Hot Water Draw Profiles.
6
This paper highlights water
5
Kosar, Douglas, Paul Glanville, Hillary Vadnal. Gas Technology Institute. 2012. Residential Water Heating
Program. California Energy Commission. Publication number: CEC-500-2013-060.
6
Neal Kruis, Bruce Wilcox, Jim Lutz, Chip Barnaby. California Residential Domestic Hot Water Draw Profiles. May
18
th
, 2016.

CSI Thermal Technical Report Single Family Residential|4-6
draws pulled from different survey data, to come up with a total hot water load by different day types.
These results are shown below in Table 4-1. The results reiterate the idea that although water heating
loads are highly variable, the number of occupants in a house are a major driver of water use.
TABLE 4-1: HOT WATER HEATING LOADS BY DAY TYPE
7
Number of
People
Weekday
[GPD]
Weekend
[GPD]
Holiday
[GPD]
1
16.96
18.16
9.23
2
28.94
32.84
24.33
3
32.6
39.62
40.18
4
41.28
48.61
33.63
5
47.24
51.41
52.93
6+
62.85
62.76
35.65
A separate analysis performed by the evaluation team looked at how potential therm savings changes
based on the hot water usage of the home. This is shown below in Figure 4-3. The team analyzed therm
savings for 6 different daily water usage patterns, between 20 GPD and 120 GPD. This range in hot water
usage resulted in almost a 300 percent difference in potential savings for a facility. While this indicates
results for a single residential facility, the purpose of showing the graph is to stress the importance of
getting an accurate representation of hot water usage to the program. Utilizing a single program deemed
value for hot water heating load can drastically underestimate or overestimate savings at a particular site.
FIGURE 4-3: RELATIONSHIP BETWEEN HOT WATER LOAD AND SAVINGS
7
Numbers are based on the Total “Match Average” results.

CSI Thermal Technical Report Single Family Residential|4-7
The impact report recommended that further study should be performed on the average daily water
draw in California, and an updated value should be used in place of the ASHRAE load of 64.3 GPD. The
evaluation team suggests exploring further an average flow rate based on the number of occupants in the
home, based on a sufficient sample size of Californian residents.
4.1.3 Single Family Pump Power
To estimate the parasitic load resulting from the energy drawn by running a pump in active single family
systems, a count was taken of all time-intervals during which the pump was identified as running for the
year. These were identified by interval increases in Solar BTU produced as reported by the enthalpy-based
data system. For every facility, a weekday and weekend hourly profile was created for each month of the
year, and from there, a total average single family weekday and weekend monthly profile was created.
This was used to create an 8760 pump shape. The individual full load rated pump power for each system
was multiplied by these annual hours of use, to determine the annual pumping energy used. This full load
rated pump power was looked up from spec sheets where possible. For the remaining homes where the
look up was not found, pump power from a similar pump of the same manufacturer was used. The
nameplate powers for residential pumps averaged just over 50 W. A load factor of 65 percent was
assumed for pumps of this site.
Combining this average runtime across the year with the average pump power and load factor, the total
pump energy usage was calculated at just over 57 kWh per year for single family SWH systems. If the
additional pump power draw is compared to the total system savings (converting the pump kWh to
therms), it accounts for about four percent of the total actual therms saved.
4.2 SYSTEM COSTS
The evaluation reviewed the single family system costs reported in the program tracking system. These
costs were compared across the program years, between 2010 and 2017, on a dollar per expected
equivalent-therms savings basis. The overall cost trend results for all single family systems are shown in
Figure 4-4 below.

CSI Thermal Technical Report Single Family Residential|4-8
FIGURE 4-4: SINGLE FAMILY COST TRENDS
* These results do not include un-glazed collectors which typically had a much lower cost than other system types and were
eventually discontinued from the single family programs due to poor performance. This only includes systems
incentivized under the Single Family budget program.
** These results are weighted by equivalent therm savings. Costs have been adjusted for inflation.
The graph shows that an overall reduction can be seen in single family system costs, with the weighted
costs starting just over $90 per expected therm saved in 2010, and seeing a 24 percent reduction by 2017
with costs closer to $70/therm. However, single family systems also saw an overall increase in cost
reaching over 50 percent than 2010 costs in 2013-2015, seeing savings-weighted costs of almost $140 per
expected-therm. This increase was driven mainly by reported system installed costs of Direct Integral
Collector Storage (DI) system which, on a $/expected-therm basis, rose substantially during this time
period. The percentage values shown below represent what percentage of all single family systems are
DI systems. The cost trend graph for DI systems only are shown below in Figure 4-5. In 2017, DI systems
saw a large drop in reported system costs. The evaluation team found that a single installer made up over
90 percent of the single family DI systems installed through the program that year. These projects
reported an average cost of just over $38/therm, which is much lower than any other cost reported for
these systems.

CSI Thermal Technical Report Single Family Residential|4-9
FIGURE 4-5: COST TRENDS FOR SINGLE FAMILY DIRECT INTEGRAL COLLECTOR SYSTEMS
* These results are weighted by equivalent therm savings. Costs have been adjusted for inflation.
One event that occurred during this time period was the major natural gas leak that occurred at the Aliso
Canyon Natural Gas Storage Facility in October 2015. One response to this was the increase of SWH
incentive rates in the SoCalGas territory for general market single family applications during 2016 and
2017. The evaluation team reviewed system costs to see if this might have been a driver for the large
fluctuation in single family costs. Costs for all systems were compared to the costs for systems that
received the increased incentive rates and those that did not, shown below in Figure 4-6. The system
costs were shown to peak in 2014, and were decreasing every year after that. For those SoCalGas systems
which saw the increased incentives of $70/therm during 2016 and 2017, the total reported cost averaged
around $75/therm. For the other systems that did not receive the higher incentive costs and were located
in other jurisdictions, the total reported project costs dropped from about $96/therm in 2016 down to
$44/therm in 2017. As previously discussed, the increased incentive rates due to Aliso Canyon do not
appear to be a major driver in the system costs.

CSI Thermal Technical Report Single Family Residential|4-10
FIGURE 4-6: COMPARISON OF SF SYSTEM COSTS DUE TO ALISO CANYON NATURAL GAS LEAK
4.3 SINGLE FAMILY RESIDENTIAL RECOMMENDATIONS
The detailed discussion above provides the basis for the following recommendations made by the
evaluation team.
8
*Recommendation 1 – The evaluation team suggests exploring average flow rate further based on the
number of occupants in the home, using sufficient sample size of Californian residents. The expected
savings for single family residential SWH systems are based on daily water draws of 64.3 gallons per day.
The source for this value comes from ASHRAE,
9
and assumes six equal daily draws of 10.7 gallons.
However, out of the 19 single family homes that were sampled, 11 were found to have a daily water
heating load of less than half of this expected value. The number of occupants appeared to have a
considerable effect on the water draw, however this factor is not considered in the expected savings.
Recommendation 2 – While the SRCC OG-300 ratings serve as a useful source of potential savings,
identifying a method of incorporating additional site-specific findings will result in a better estimate of
savings. Discussions with SRCC to confirm that updating savings assumptions will not nullify the SRCC
certification for the equipment is required before any additional steps may be taken. If a new residential
SWH modeling tool is developed, it may be beneficial to consider whether it will provide more accurate
and site-specific savings for residential systems.
8
Recommendations with an asterisk (*) next to them were included in the Impact Report.
9
ASHRAE 118.2 Method of Testing for Rating Residential Water Heaters.

CSI Thermal Technical Report Conclusions and Recommendations|5-1
5 CONCLUSIONS AND RECOMMENDATIONS
The CSI-T program will run through July 31, 2020, as mandated by AB 797. The overall budget of $250
million has not changed, but AB 797 did increase the allocations devoted to low income residential
housing and buildings in disadvantaged communities, as well as adding emphasis for industrial
applications.
The results of the CSI-T program evaluation reveal that there can be a steep learning curve to
implementing an incentive program for a technology as complicated as SWH. Unlike technologies like PV,
SWH systems can be much more complicated to model and estimate savings due to their countless
different configurations, external factors affecting savings, and dependency on operation, setpoint, and
hot water load. To expand on these difficulties, there is limited research and analysis available on best
practices for SWH system modeling, program design, or program evaluation to draw from when
developing SWH incentive programs. Given the complexities of the technology and the effect that
operation errors play on savings, the recommendations highlighted below will provides useful insights
into how future SWH programs can improve their expected savings estimates. These recommendations
can also be found in the Executive Summary, and the end of each report section.
5.1 PROGRAM RECOMMENDATIONS
*Recommendation 1 – Update to commercial pool depth assumptions: The program calculators
should incorporate an average pool depth (or pool volume) when they calculate the savings and
incentives for the pools. Because many pools do not have a consistent depth all the way through, a
maximum and minimum depth should be entered, and an average pool depth calculated. An alternative
approach could be to ask for the total volume (in gallons) of a pool, as a pool operator may know their
overall pool volume rather than the average depth.
*Recommendation 2 – Update to commercial pool sheltering assumptions: The baseline pool
sheltering factor should be reduced from three to 0.5 in the program calculator. It may be possible
to develop questions that ask about the pool surroundings to see if there is any justification for increasing
the pool sheltering factor on a site-by-site basis.
*Recommendation 3 – Update to commercial pool activity level assumptions: The baseline pool
activity factor should be left at one for most pools. It is plausible that it may be possible to develop
questions to ask the site contact that might be able to further refine the activity levels of the pools, like
at a minimum, asking how often the pool is used during different months of the year. The model also
does not consider an activity level set by season. It is not clear how that might affect savings, or whether
the model may be able to handle this complexity.

CSI Thermal Technical Report Conclusions and Recommendations|5-2
*Recommendation 4 – Optimize operational performance for commercial pools: Several
recommendations for future programs could be made to optimize the performance of commercial
pools. The first is to require automated pool controls which optimize auxiliary and SWH heater setpoints
and maximize the benefits of the solar heating. The second would be to require some sort of owner or
operator training on how to best operate the pool heaters or require a maintenance plan where the
systems are checked on a regular basis and issues are discussed to ensure they are being optimally
operated. Finally, the savings and incentives program calculations should incorporate check boxes
representing each month of the year for both auxiliary heating and SWH heating, to determine how the
customer believes the system will be operated throughout the year.
*Recommendation 5 – Require existing pool heaters or demonstrate that a pool heater was
eliminated: Consider updating program requirements so that for existing pools, the installation of
a SWH system must offset natural gas usage. This could be done by replacing an existing heater (an older
solar hot water heater would be eligible). Written exceptions could be considered if the customer is truly
wanting to try out solar heating prior to purchasing a natural gas heater, but these are more likely to be
the minority and should be considered on a case-by-case basis.
Recommendation 6 – Consider requiring usable metering for more facilities: Similar to
the CSI PV rules, it may be useful to consider requiring usable metering for SWH
applications above 30kW
th
. This will help give system operators an incentive to make sure that systems
are maximizing the amount of solar used, enabling more accurate inputs into the calculator models, and
verifying that system outages are easily identified and quickly fixed. Finding a way to link the metering to
the incentivized amounts would also be beneficial. However, the benefit of this needs to be balanced with
the added cost and complexity this requirement would add.
Recommendation 7 – Consider allowing collector height as a calculator input to determine wind
speeds: Given the large range of wind speeds identified, it may be useful to allow collector height
as input to the calculator. Additional research may be needed to attempt to identify a relationship
between collectors at varying heights and wind speed ratio to 10m wind speeds.
Recommendation 8 – Consider providing incentives for maintenance plans and
metering equipment and ensure facility maintenance personnel are fully trained
on the system operation. This should include training for maintenance and periodic testing of the glycol
systems. Several sites in the commercial and multifamily sample saw very poor performance, due to
limited solar usage, technical system issues, or customers completely unaware of the system existence.
Many of the facilities where poor performance was identified had customers which reported no issues
with the system. This could indicate that many operators are unaware of how the system performs, and

CSI Thermal Technical Report Conclusions and Recommendations|5-3
facilities could benefit from creative ways to ensure the customer is fully engaged with the system
operation.
Recommendation 9 – Further research into how water loads for commercial and multifamily
facilities (prioritizing multifamily facilities) is warranted to get a better grasp on actual hot water
load that should be used to estimate savings: The calculator’s maximum values come from the ASHRAE
handbook which is noted to have pre-dated low flow fixtures and handbooks. This suggests that the
maximum water usage table may over-estimate hot water load, especially in states like California which
has suffered major droughts and has operated under mandates to reduce water usage across many
regions.
Recommendation 10 – Establishing a more appropriate average default value will help ensure
that incentive calculations are not based on a maximum hot water load: Eighty-five percent of
apartments receiving SWH incentives used the maximum allowable table in the program handbook to
estimate their hot water demand. This is in spite of the fact that the tables have the footnote that states
that “The GPD table is only a maximum justification and predates low-flow fixtures and appliances. Data
should not be used for sizing requirements.”
Recommendation 11 – Providing a check-list to installers and those applying for
rebates may help to eliminate some of these more common configuration issues: It
is not clear whether many of these configuration issues are due to site-specific conditions which require
system adaptations to ensure the system will fit in the existing space, or if some best practices are just
being overlooked. Some configuration issues result in potential safety issues, while others result in poor
performance. Alerting installers to these more common issues may be beneficial to reducing these
occurrences.
*Recommendation 12 – The evaluation team suggests exploring further an average flow rate
based on the number of occupants in the home, based on a sufficient sample size of Californian
residents: The expected savings for single family residential SWH systems are based on daily water draws
of 64.3 gallons per day. The source for this value comes from ASHRAE,
1
and assumes six equal daily draws
of 10.7 gallons. However, out of the 19 single family homes that were sampled, 11 were found to have a
daily water heating load of less than half of this expected value. The number of occupants appeared to
have a considerable effect on the water draw, however this factor is not considered in the expected
savings.
1
ASHRAE 118.2 Method of Testing for Rating Residential Water Heaters.

CSI Thermal Technical Report Conclusions and Recommendations|5-4
Recommendation 13 – While the SRCC OG-300 ratings serve as a useful source of potential
savings, identifying a method of incorporating additional site-specific findings will result in a
better estimate of savings. Discussions with SRCC to confirm that updating savings assumptions will not
nullify the SRCC certification for the equipment is required before any additional steps may be taken. If a
new residential SWH modeling tool is developed, it may be beneficial to consider whether it will provide
more accurate and site-specific savings for residential systems.
