
DESIGN AND DEVELOPMENT OF A LOW PRESSURE
EVAPORATOR/CONDENSER UNIT (ECU) FOR WATER-BASED
ADSORPTION TYPE CLIMATE CONTROL SYSTEMS
A Thesis presented
By
Arjun Venkataramanan
to
The Department of Mechanical and Industrial Engineering
in partial fulfillment of the requirements
for the degree of
Master of Science
in the field of
Mechanical Engineering
Northeastern University
Boston, Massachusetts
August 2016
ii
ACKNOWLEDGEMENTS
I would like to express my sincere gratitude to Dr. Hidrovo for giving me the opportunity
to work in the ATB project. I truly enjoyed my time working at both the MTFL and the
HML lab. I would also like to thank Dr. Carlos Rios Perez for guiding me and being patient
with me throughout the ATB project. It was a pleasure working with you and I learned a
lot over the past year. I would also like to thank the Advanced Research Projects Agency-
energy (ARPA-e) for funding this project and their continuous support.
Thank you Burak for all your support and the wonderful memories we have had over the
past two years. Khrystyna, thank you for creating a wonderful environment at the MTFL.
Your passion for learning new things inspired me. It was a real pleasure working with
Pooyan, Yasamin and David. Thank you guys for always clearing my doubts whenever
needed. I wish I had a little bit more of your discipline and work ethics. Finally, I would
also like to thank my parents for all their advice and support and also my brother who never
stopped believing in me.

iii
ABSTRACT
Electric vehicles (EVs) are the future of clean transportation and driving range is one of
the most important parameters which dictates its marketability. In order to increase driving
range, electrical battery energy consumption should be minimized. Vapor-compression
refrigeration systems currently employed in EVs for climate control consume a significant
fraction of the battery charge. Thus, by replacing this traditional heating ventilation and
air-conditioning system (HVAC) with an adsorption based climate control system one can
have the capability of increasing the drive range of EVs.
The Advanced Thermo-adsorptive Battery (ATB) for climate control is a water-based
adsorption type refrigeration cycle. An essential component of the ATB is a low pressure
evaporator/condenser unit (ECU) which facilitates both the evaporation and condensation
processes required for operation of the ATB. The thermal design of the ECU relies
predominantly on the accurate prediction of evaporation/boiling heat transfer coefficients
since the standard correlations for predicting boiling heat transfer coefficients have large
uncertainty at the low operating pressures of the ATB. This work describes the design and
development of the low pressure ECU as well as the thermal performance characterization
of the actual ECU prototype.
iv
TABLE OF CONTENTS
Chapter 1: Introduction .................................................................................................................. 1
1.1 Background ......................................................................................................................... 1
1.2 ATB modes of operation .................................................................................................... 3
1.2.1 Cooling .................................................................................................................... 3
1.2.2 Heating .................................................................................................................... 4
1.2.3 Regeneration ........................................................................................................... 5
Chapter 2: Structural design of the evaporator/condenser unit ................................................. 6
2.1 Static structural analysis .................................................................................................. 10
2.2 Fatigue analysis ................................................................................................................. 13
Chapter 3: Evaporator performance characterization .............................................................. 15
3.1 Selection and fabrication of enhanced surface tubes .................................................... 19
3.2 Calibration of temperature sensor and flow meter ....................................................... 21
3.3 Experimental procedure for estimating average boiling heat transfer coefficient ..... 23
Chapter 4: Full scale ECU prototype testing .............................................................................. 27
4.1 Vacuum leak test for the ECU enclosure ........................................................................ 28
4.2 Degassing methodology .................................................................................................... 29
4.3 Thermal performance characterization ......................................................................... 32
Chapter 5: Results and discussion ............................................................................................... 36
5.1 Boiling performance of enhanced surface tubes ............................................................ 36
5.2 Thermal performance of full scale ECU prototype ....................................................... 37
5.3 Optimization of vapor control valve for climate control in EVs .................................. 40
5.4 Control Strategies for vehicle-preconditioning and cabin climate control ................. 42
Chapter 6: Conclusions and future work .................................................................................... 49
REFERENCES .............................................................................................................................. 51
v
List of figures
Figure 1 Schematic of ATB operation during a) Discharging mode (adsorption) and b)
Recharging mode (desorption). ............................................................................................2
Figure 2 Schematic of ATB Cooling Mode operation where ECU is coupled to climate
core heat exchanger and Adsorption bed is coupled to the Radiator. ..................................4
Figure 3 Schematic of ATB heating mode operation where ECU is coupled to radiator
and adsorption bed is coupled to the climate core heat exchanger. .....................................4
Figure 4 Schematic of ATB regeneration mode where ECU is coupled to radiator and
adsorption bed is coupled to external electric grid. .............................................................5
Figure 5 Schematic of initial structural design of Evaporator/Condenser Unit. .................6
Figure 6 Isometric view of Final ECU Enclosure design. The fabrication of the unit was
outsourced to Super Radiator Coils in Virginia. ..................................................................7
Figure 7 Exploded View of ECU showing the heat exchanger arrangements in both
evaporator and condenser respectively. ...............................................................................8
Figure 8 Side View Final ECU enclosure design showing the coolant ports for evaporator/
condenser and ports for pressure transducer and drain on top and bottom plate of enclosure.
..............................................................................................................................................8
Figure 9 Baffle blue print with detailed geometry. Slots in the middle are provided for
supporting both evaporator and condenser heat exchanger while the remaining slots are for
water and vapor transport across the enclosure. ..................................................................9
Figure 10 Distribution of von-mises equivalent stress for the ECU enclosure. Maximum
von-mises stress under a uniformly distributed of 0.1 Mpa is 145 Mpa and is located in the
slots provided in the baffles for water and vapor transport. ..............................................12
Figure 11 Location of maximum deformation for the ECU enclosure under a load of 0.1
Mpa. Maximum deformation is 0.21 mm and is located on the top plate of the
enclosure. ...........................................................................................................................12
vi
Figure 12 Thermal Resistance Model for flow inside a pipe with evaporation/boiling on
the external tube surface. ...................................................................................................15
Figure 13 Variation of saturation temperature with liquid height (h) for a vapor saturation
pressure of 700 Pa (T
sat
=1.88°C). ......................................................................................17
Figure 14 Variation of the superheat temperature difference along the heat exchanger. As
the external surface temperature varies, so does the superheat temperature and the boiling
heat transfer coefficient. .....................................................................................................18
Figure 15 Images of Tube 1 (TURBO-Chill® 56-4050228) and Tube 2 (S/T Trufin® 67-
114025) from Wolverine Inc. that were utilized for fabrication and testing inside ECU. .19
Figure 16 Fabrication of Micro Finned Tube for estimating the average boiling heat
transfer coefficient at Low Pressures. The compression fittings are utilized to couple the
tubes to liquid feedthrough which in turn is connected to the coolant lines ......................20
Figure 17 Set up for calibrating the temperature sensors (K-type thermocouple and 4-wire
RTD probes from Omega Inc.) at three standard temperature points. ...............................21
Figure 18 Experimental set up for calibrating coolant flow meter for evaporator
characterization experiments and calibration curve (measured vs recorded data). ...........22
Figure 19 Acrylic support structure utilized for supporting the micro finned tubes during
evaporator characterization experiments ...........................................................................23
Figure 20 Schematic of experimental set up on the left and actual experimental set up on
the right for estimating the average boiling heat transfer coefficient. ...............................25
Figure 21 Fabrication of evaporator and condenser heat exchangers for the ECU full scale
prototype. The manufacturing of the ECU was outsourced to Super Radiator Coils in
Virginia. .............................................................................................................................27
Figure 22 Experimental set up for vacuum leak testing of the ECU (<100 Pa) using RV-3
edwards vacuum pump and dry ice cold traps (LIT-10025) from Laco technologies.......28
Figure 23 Vacuum leak test for the ECU prototype conducted at Northeastern university.
Small variation of chamber pressure (<10 Pa pressure increase over 24 hours) with respect
to time suggests that the chamber is leak proof. ................................................................29
Figure 24 The above figure depicts the degassing procedure followed for removing non-
condensable gases from liquid refrigerant (water) inside the ECU. ..................................31
vii
Figure 25 Figure shows the plot between chamber temperature and time during degassing
cycles. The heaters installed at the bottom of the ECU are used for heating the ECU
enclosure up to 60°C. .........................................................................................................32
Figure 26 Schematic of Experimental set up utilized for the ECU thermal performance
testing. Basic idea behind this experimental set up is that the dry ice cold traps along with
vacuum pump mimics the performance of adsorption bed. ...............................................33
Figure 27 Actual experimental set up integrated at Northeastern University for the ECU
thermal performance characterization. Coolant pumps are connected in parallel to deliver
a maximum flow rate of 20 lit/min during experiments. ...................................................34
Figure 28 Vapor control butterfly valve used for full scale ECU thermal performance
characterization experiments on the left and variation of valve angle with thermal power
on the right. ........................................................................................................................40
Figure 29 Variation of Vapor Control Valve Angle with Thermal Power for Two Different
Flow rates. The results suggest that the valve angle is independent of coolant flow rate. 41
Figure 30 Thermal power Vs coolant outlet temperature at three different Refrigerant
Levels. ................................................................................................................................42
Figure 31 Variation of average wall superheat with heat flux for tube 1 and tube 2. Results
show that Rohsenow’s model clearly under predicts the performance of Tube 2 at low
pressure (750 Pa)................................................................................................................37
Figure 32 Thermal Power Vs Time shows the Transient Behavior of ECU during
performance evaluation experiments. The initial peak in the thermal power is because of
the thermal mass of the coolant tank utilized for this experiments. ...................................38
Figure 33 Thermal Power Vs Coolant Outlet Temperature at Steady State for Two different
flow rates (10Lit/Min and 20 Lit/Min). The maximum power tested (1270 Watts) was
limited by the capacity of vacuum pump and cold traps. ..................................................39
Figure 34 Original control strategy. The base-line control strategy for the ATB system
requires the control of the vapor valve until a steady evaporation pressure is achieved. This
figure shows the variation of pressure (top left), coolant outlet temperature (to right),
coolant flow rate (bottom left), and Thermal power (bottom right). .................................44
viii
Figure 35 ALT 1 Control Strategy (maximization of thermal power) This hybrid control
strategy for the ATB system targets to have a constant thermal power delivered during the
beginning of the evaporation experiment. This figure compares this ALT 1 strategy with
the Original strategy on the temporal variation of pressure (top left), coolant outlet
temperature (to right), coolant flow rate (bottom left), and Thermal power (bottom
right). ..................................................................................................................................45
Figure 36 ALT 2 Control Strategy (faster reduction of coolant temperature) This hybrid
control strategy for the ATB system targets to have a higher temperature reduction rate of
the coolant leaving the evaporator heat exchanger. This figure compares this ALT 2
strategy with the Original strategy on the temporal variation of pressure (top left), coolant
outlet temperature (to right), coolant flow rate (bottom left), and Thermal power (bottom
right). ..................................................................................................................................47
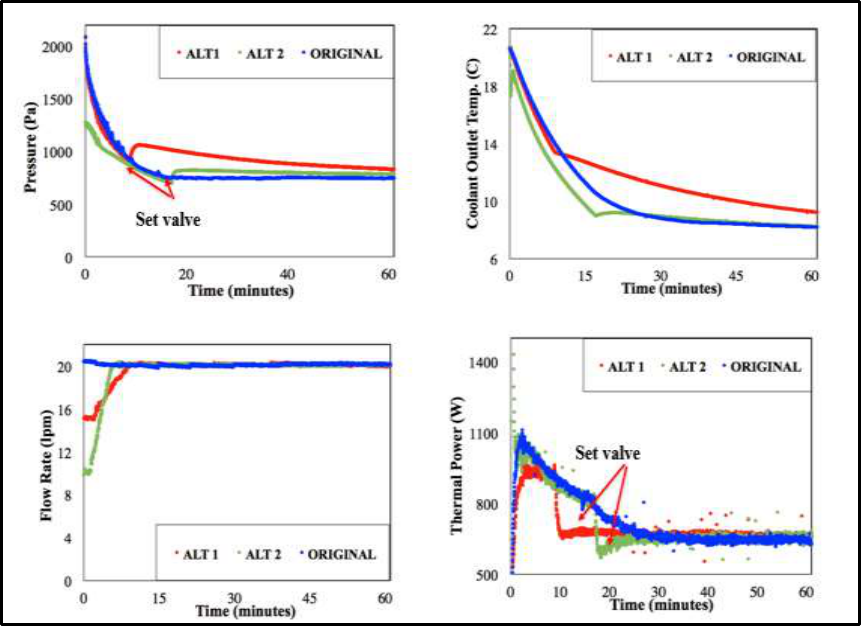
Figure 37 This figure compares ALT 1 and ALT 2 control strategy with Original strategy
on the temporal variation of pressure (top left), coolant outlet temperature (to right), coolant
flow rate (bottom left), and Thermal power (bottom right). ..............................................48
1
Chapter 1: Introduction
The transportation sector in the united states is responsible for 26% of total greenhouse gas
emissions (GHG) [1]. Electric vehicles (EVs) can reduce GHG emissions by 32% [2].
Average driving range of current generation EVs is about 100 Miles [3] and 77% of
customers are concerned about the range limitations of EVs [4].
Coefficient of performance (COP) of standard R-12 vapor compression refrigeration
system currently employed in EVs for climate control is 2.35 [5] and it consumes a
significant fraction (35%) of battery charge [6]. Adsorption heat pumps are one of the
energy efficient alternatives to the traditional vapor compression system for heating and
cooling applications [7]. The advanced thermo-adsorptive battery (ATB) is a water-based
adsorption type climate control system that has the potential to reduce the battery energy
consumption and increase the drive range of EVs significantly. This section describes the
basic working principle of ATB system and also the different modes of operation when it
is deployed in an actual EV.
1.1 Background
The ATB system has two main components 1) adsorption bed- which uses high density
adsorbent materials (MgY Zeolite) with very high hydrophilicity, water uptake capacity
and heat of adsorption [8] and 2) evaporator/condenser unit (ECU) - which employs micro
finned tubes to generate and condense vapor at low pressures. As the vapor is generated in
the ECU by the evaporator, the adsorption bed draws all the vapor and generates heat. No
compression or any other external means of vapor transport is required for transporting
refrigerant vapor between the two components [9]. This process is known as discharging

2
which is shown in Figure 1(a). The coolant can then be circulated across the ECU and the
adsorption beds to accomplish both cooling and heating [10]. The entire process can be
reversed by applying heat energy into the adsorption beds which regenerates the beds by
releasing vapor molecules back to the ECU. Finally, the condenser coils condense the hot
vapor back to the liquid state. This process is known as recharging which is shown in Figure
1(b).
Figure 1 Schematic of ATB operation during a) discharging mode (adsorption) and b)
recharging mode (desorption).
During the previous phase of this project, efforts were made to integrate both the ECU and
the adsorption bed as a single unit [11]. Although this monolithic integration was
advantageous both in terms of space and weight, there were some difficulties in
manufacturing the embedded evaporator prototype. The motivation for change in system
architecture arose after some successful experimental results obtained at MIT using an
external coiled evaporator [12]. This is the starting point of this thesis and the main
objective of this work involves the design and development of a low pressure ECU and
3
evaluating its thermal performance. In addition to this, several control strategies are
explored to tackle vehicle preconditioning requirements and also to reduce the cost and
complexity of the ATB system.
1.2 ATB modes of operation
ATB interacts with two additional heat exchangers when it is deployed in an EV, they are
cabin climate core and radiator. These are liquid and air based heat exchangers with
minimal electrical power requirements for coolant circulation and air flow that are used to
exchange heat between different components and environment [10]. There are three
different modes of operation for ATB they are cooling, heating and regeneration. Cooling
and heating modes are accomplished during adsorption phase where the ECU operates as
an evaporator and regeneration is accomplished during desorption phase where the ECU
works as a condenser. The internal pressure inside the ECU varies between 700 Pa and
60kPa during adsorption and desorption process respectively.
1.2.1 Cooling
In this mode of operation, the primary objective of the ECU is to provide chilled coolant
to the climate core heat exchanger so that it can supply cooled air (≤ 15°C) inside the
passenger cabin. Hence in this mode of operation the ECU is connected to the climate core
heat exchanger and the heat generated inside the adsorption bed is dumped into the
environment using a radiator [9]. The schematic of the cooling mode is shown is Figure 2.
In addition to achieving this target cabin air temperature, the ECU should also be able to
deliver a target thermal power of 1600 watts for a period of 4 Hours. During peak summer
conditions the inlet air temperature entering the climate core heat exchanger can be as high
as 43°C.

4
Figure 2 Schematic of ATB cooling mode operation where the ECU is coupled to climate
core heat exchanger and adsorption bed is coupled to the radiator.
1.2.2 Heating
In this case the primary objective is to supply hot air at 28°C inside the passenger cabin
and therefore in this mode of operation, heat from the adsorption bed is utilized by coupling
it to the climate core heat exchanger and the ECU is coupled in a closed loop with Radiator
[9]. In severe winters, the coolant entering the ECU can be below the freezing temperature
of refrigerant (water). So to achieve evaporation at such low (below freezing) temperature,
auxiliary electric heaters are installed on the bottom plate of the ECU enclosure.
Figure 3 Schematic of ATB heating mode operation where the ECU is coupled to the radiator
and adsorption bed is coupled to the climate core heat exchanger.

5
1.2.3 Regeneration
During adsorption, the stacks inside the beds start to become saturated with water until they
cannot adsorb any more water molecules. Hence the adsorption beds need to be recharged
after each adsorption cycle before it can start operating again. This recharging process also
known as desorption requires heating up the beds to a very high temperature (150 to 350°C)
[13]. In order to achieve this, the side walls of the adsorption bed enclosures are equipped
with external heaters which are electrically powered from the grid. Hence the regeneration
mode occurs when the electric vehicle is in charging mode. The ECU is coupled with the
radiator during this mode of operation. Vapor from the adsorption bed enters the ECU at a
much higher temperature (60°C). The ECU now operates as a condenser and condenses the
hot vapor entering the enclosure and the refrigerant gets stored back into the ECU. This
mode completes the ATB cycle of operation. The air temperature across the radiator (T
air
)
during severe winters can be as low as -18°C and in summer it can be as high as 43°C.
Figure 4 depicts the schematic of regeneration mode and the ECU should be able to deliver
a power of about 2700 Watts during this mode of operation.
Figure 4 Schematic of ATB regeneration mode where the ECU is coupled to the radiator and
adsorption bed is coupled to external electric grid.

6
Chapter 2: Structural design of the evaporator/condenser unit
Principal functions of the ECU include 1) Evaporating refrigerant to create vapor 2)
Condensing the hot vapor from the adsorption beds during regeneration mode 3) Store
enough refrigerant for ATB operation and 4) Maintain structural stability while operating
under vacuum conditions. These functions provided the design constraints that guided the
initial shape of the ECU. The schematic of the ECU is shown in Figure 5.
Figure 5 Schematic of initial structural design of Evaporator/Condenser Unit.
Figure 5 shows the ECU schematic with ripple like structures on top and bottom plates of
the enclosure. These structural perturbations were primarily created to retain structural
stability while maintaining the enclosure weight below 20 kg. However, welding thin
stainless steel sheets (<2 mm) posed a major manufacturing difficulty.
Apart from the principal functions, the ECU should also ensure smooth vapor transport to
the adsorption beds without any major mass transfer resistance and pressure drop. The final
tapered design of the ECU shown in Figure 6 takes care of this objective by facilitating the
accumulation of vapor on top the chamber before it exits the ECU. Another important
factor was to ensure that the entire unit fits inside the hood of an EV. This was

7
accomplished by having several fitting exercises. The above mentioned factors
transformed the shape and size of the ECU enclosure from the initial design to a tapered
design as shown in Figure 6. The vapor port (3.38 CF flange) is placed in the top part of
the front plate to favor vapor extraction from the highest section (158 mm). The final
dimensions of the ECU enclosure after the fitting exercise were 750×450 mm. The final
ECU enclosure weight and volume were 41 kg and 39 liters respectively.
Figure 6 Isometric view of final ECU enclosure design. The fabrication of the unit was
outsourced to Super Radiator Coils in Virginia.
Inside the ECU, evaporator heat exchanger tubes are placed in 2 rows with 10 and 8 passes
respectively. Whereas the condenser heat exchanger tubes are placed in a single row with
8 passes. The tube bending radius which depends on the outside diameter (O.D) dictated
the spacing between each pass of the tube in both evaporator and condenser heat exchanger.
This in turn finalized the width of the ECU enclosure (450 mm). Some clearance is
provided between the walls of the ECU enclosure and the heat exchanger tubes for
manufacturing feasibility.

8
Figure 7 Exploded view of ECU showing the heat exchanger arrangements in both evaporator
and condenser respectively.
Furthermore, a set of two coolant ports each for the evaporator and condenser heat
exchangers are welded on to the back plate of the enclosure. These ports are spaced in a
specific manner for connecting the inlets / outlets of the evaporator and condenser tubes
inside the enclosure to the external heat exchangers. The size of the coolant ports is
determined by the size of the evaporator and condenser tubes respectively.
Figure 8 Side view of the final ECU enclosure design showing the coolant ports for
evaporator/condenser and ports for pressure transducer/drain on top and bottom plate of
enclosure.

9
Inside the ECU apart from evaporator and condenser heat exchangers there are structural
members known as Baffles that were incorporated to 1) provide support for evaporator and
condenser heat exchanger assemblies and 2) serve as structural reinforcement to the ECU
enclosure under vacuum conditions. Apart from these, the baffles were also designed in a
way to facilitate vapor and water transport inside the ECU enclosure. The dimensions of
the baffle design are shown is Figure 9. The slots in the middle section are for supporting
the evaporator and condenser heat exchanger tubes while the remaining slots are for water
and vapor transport inside the enclosure. The two heat exchangers spaced in such a way
that it can accommodate 10.7 liters of refrigerant (water) between them to have the energy
capacity 6.4 Kw-hr. Baffle thickness, number of baffles and spacing between them were
finalized after conducting several iterations of FEA analysis for the entire ECU enclosure
which is discussed in the next section.
Figure 9 Baffle blue print with detailed geometry. Slots in the middle are for supporting both
evaporator and condenser heat exchanger while the remaining slots are for water and vapor
transport across the enclosure.
10
2.1 Static structural analysis
As discussed in the previous section, there were several factors and constraints that dictated
the geometry and shape of the enclosure. To ensure structural stability several iterations of
finite element analysis (FEA) were performed by utilizing ANSYS Workbench 14.0. Static
structural analysis was performed not only to ensure that the ECU enclosure will withstand
the maximum load under vacuum conditions during its operation but also to eliminate any
structural errors that would result in severe stress concentration regions or points inside the
ECU enclosure.
The enclosure material selected from the library of ANSYS Workbench 14.0 is stainless
steel alloy with a 7850 kg/m
3
density. The yield strength and ultimate strength of stainless
steel are 208 MPa and 460 MPa respectively. Computational time and memory required
for finite element modelling can be made more efficient by exploiting the planes of
symmetry[14]. Symmetry assumption is valid only when the restraints (boundary
conditions) and the geometry are symmetric about a plane which is present in the ECU
enclosure design [14]. Hence only one half of the enclosure geometry is utilized for
structural analysis. The boundary condition (type of contact) selected between the
enclosure and baffles was bonded (type). This type of contact restricts any type of
separation and relative motion between surfaces [15]. FEA analysis was performed by
assuming vacuum conditions and a maximum pressure load of 1 Atmosphere or 0.1 MPa
acting in the normal direction on all sides of the enclosure. After several trials the optimal
thickness of different parts of the ECU enclosure to achieve a static safety factor of 1.43
was determined. These dimensions are listed in Table 1.

11
Table 1 Thickness details for different parts of the ECU
The values of maximum stress, maximum deformation and static safety factor from the
static structural analysis are listed in Table 2. This design ensures that there are no structural
irregularities that could result in major stress concentration.
Table 2 FEA results for the final ECU enclosure design under vacuum conditions
Figure 10 shows the von- mises stress distribution across the ECU enclosure for a pressure
load of 0.1 MPa. Maximum von-mises stress is 145 MPa and it occurs in the slots provided
on the baffles for water and vapor transport. Figure 11 shows the deformation profile of
the ECU enclosure under vacuum conditions. The maximum deformation under a pressure
load of 0.1 MPa is 0.21 mm and it is located on the top plate of the enclosure.

12
Figure 10 Distribution of von-mises equivalent stress for the ECU enclosure. Maximum von-
mises stress under a uniformly distributed of 0.1 Mpa is 145 Mpa and is located in the slots
provided in the baffles for water and vapor transport.
Figure 11 Location of maximum deformation for the ECU enclosure under a load of 0.1 MPa.
Maximum deformation is 0.21 mm and is located on the top plate of the enclosure.

13
2.2 Fatigue analysis
One of the design requirements is that the ECU should be able to hold vacuum without any
leak and maintain structural rigidity at least for a period of 5 years (8000 Cycles).
Fluctuations in the pressure within the ECU and the fact that these loads are cyclic
motivated the need to perform a fatigue failure analysis. The enclosure absolute pressure
varies between 700 Pa during adsorption and 60 kPa during regeneration (desorption). This
type of fluctuating loading has a non-zero mean stress. So to investigate the effect of this
non-zero mean stress on fatigue life the Soderberg Line method (more conservative) has
been utilized to ensure reliability of the design [16].
From the static structural analysis, the maximum von-mises stress in the ECU enclosure
under an external pressure load of 0.1 MPa (adsorption) and 0.04 MPa (desorption) are
145.39 MPa (S
max
) and 47.78 MPa (S
min
) respectively. From these values, the alternating
stress (S
a
) and mean stress (S
m
)values are computed using the following relations [16],
(1)
(2)
Typical endurance limit (Se) of stainless steel (AISI type 302) is 234 Mpa [17]. Finally,
the fatigue safety factor (N) is computed using the following relation [16],
(3)

14
Table 3 Fatigue analysis results of final ECU enclosure design using Soderberg line method.
The values of alternating stress, mean stress and fatigue safety factor are listed in Table 3.
A fatigue safety factor of 1.4 is obtained for the ECU enclosure final design and this
suggests that the amplitude of alternating stress (Sa) and the effect of mean stress (Sm) for
the loading conditions during ATB system operation is not high enough to cause fatigue
failure.

15
Chapter 3: Evaporator performance characterization
This section deals with the methodology followed for estimating the average
evaporation/boiling heat transfer coefficient at low pressures. Among the two heat transfer
mechanisms inside the ECU (evaporation and condensation), the performance is mainly
limited by evaporation/boiling process. Hence more importance is given to the design of
evaporator heat exchangers than condenser to deliver the required power at desired coolant
outlet temperature. Only standard heat exchanger tubes and fin arrangements are evaluated
in order to reduce the complexity of the ATB system. Figure 12 shows the different thermal
resistances encountered during the evaporation process inside the ECU.
Figure 12 Thermal Resistance Model for flow inside a pipe with evaporation/boiling on the
external tube surface.
From the thermal resistance model in Figure 12, the evaporation heat transfer (Q
evap
) can
be determined by using the following expression.
*
12
intint
1
2
)/ln(
1
2
1
extevap
coolantcoolant
satin
evap
Ah
kL
rr
AhCpm
TT
Q
(4)
16
where T
in
is the coolant inlet temperature and T
sat
(K) is water (refrigerant) saturation
temperatures (K), h
int
is the internal heat transfer coefficient and h
evap
is the
evaporation/boiling heat transfer coefficient (Wm
-2
K
-1
), r
2
and r
1
are the outer and inner
tube radius (m), k is the tube material (Copper) thermal conductivity (Wm
-1
K
-1
), L is the
tube length (m), and A
int
and A
ext
*
are the internal and external surface areas of the tube
(m
2
), respectively. Here A
ext
*
is the effective surface area and A
ext
*
= A
tot
η
tot
where A
tot
is
the total external surface area and η
tot
is the total fin efficiency.
From estimating the values of all the resistances in the system, it was evident that the
evaporator/boiling heat transfer is the major resistance in the system. Thus, the accurate
prediction of the external evaporation/boiling heat transfer coefficient is a key objective to
properly design the heat exchanger.
Initially, Rohsenow’s correlation was adopted for estimating the external
evaporation/boiling heat transfer coefficient with water as a refrigerant. But there was a
large sensitivity in the evaporator length required to achieve a target thermal power of 1600
watts due to surface material and finishing, e.g. 5m and 18 m for a scored and lapped copper
surface respectively.
During adsorption process, the ECU operates at very low chamber pressure (700-800 Pa)
and at low heat flux and wall superheat temperatures (0.5-4 W/cm
2
and 4- 10°C) to generate
vapor. At these operating conditions, only few nucleation sites are active for boiling and
the bubble departure frequency is also very low. Heat flux levels of 60 w/cm
2
are required
to increase the bubble departure frequency in order to maintain continuous boiling and
steady wall temperature at low pressures [18]. Hence the standard Rohsenow’s nucleate

17
boiling correlation for predicting heat transfer coefficient cannot be utilized for designing
the ECU for ATB operating conditions.
When the chamber pressure is very low (700-800 Pa) the weight of the liquid column
becomes significant. Hence, the pressure and the saturation temperature changes along the
liquid column (Figure 13) inside the ECU. These variations creates a non-homogeneity in
the bulk fluid properties that results in a boiling process entirely different from those
observed at atmospheric conditions [19].
Figure 13 Variation of saturation temperature with liquid height (h) for a vapor saturation
pressure of 750 Pa (T
sat
=2.85°C).
Sub-atmospheric pool boiling experiments were conducted over a plain horizontal copper
tube surface at pressures ranging between 1.8 – 3.3 kPa [20]. However, the correlations
for heat transfer coefficient obtained from these experiments cannot be utilized for sizing
the evaporator as the ATB system operates at a much lower pressure (700-800 Pa) and also
employs a micro finned tube for evaporation/boiling (S/T Trufin® 67-114025 tube from
Wolverine Inc.). This enhanced tube surface with micro fins will also have a significant
effect on boiling performance [21]. Thus, the lack of correlation for predicting external
0
2
4
6
8
0 5 10 15 20 25 30
T
sat
(°C)
h (mm)

18
boiling heat transfer coefficient at the desired pressure range (700-800 Pa) and the large
uncertainty of Rohsenow’s model stimulated the need for experiments.
The external boiling heat transfer coefficient h
evap
,
strongly depends on the wall superheat
temperature and this changes along the length of phase change heat exchanger which is
shown in Figure 14. Hence several experiments are carried out at different superheat
temperatures (4 – 10°C) that corresponds to ATB operational conditions and finally an
average approximation for variation in h
evap
with respect to
T
e
is obtained. The resulting
average heat transfer coefficient is then utilized to accurately size the heat exchanger.
Figure 14 Variation of the superheat temperature difference along the heat exchanger. As the
external surface temperature varies, so does the superheat temperature and the boiling heat
transfer coefficient.
The refrigerant and coolant selected for this analysis are distilled water and 50/50 ethylene
glycol-water mixture. Water has a high heat of vaporization and high thermal conductivity
apart from being environmental friendly and cheap [21]. Furthermore, the heat of
adsorption (3300-4200 kJ/kg) and desorption temperature (200°C) for zeolite- water pair
h
e

19
is also very high [22]. In severe winters the coolant that enters the ECU can be as low as
-18°C. Hence to prevent freezing of coolant at such low temperature a 50/50 ethylene
glycol-water composition (volume) was selected which has a freezing point of -40°C [23].
3.1 Selection and fabrication of enhanced surface tubes
Two different micro finned tubes are procured from Wolverine tubes Inc. and used for
evaporator characterization experiments. Tube 1 (TURBO-Chill® 56-4050228) is a micro
finned tube with external fins on the outside diameter and ridges on the inner diameter.
These ridges on the interior surface aids heat transfer by promoting turbulence of the
working fluid [24]. Tube 2 (S/T Trufin® 67-114025) has integral helical fins that are
spaced very closely to one another while the inner surface is smooth with no internal
protrusions. This tube has a larger surface area when compared with Tube 1 and it increases
the heat transfer coefficient during evaporation and condensation [25].
Figure 15 Images of Tube 1 (TURBO-Chill® 56-4050228) and Tube 2 (S/T Trufin® 67-
114025) from Wolverine Inc. that were utilized for fabrication and testing inside the ECU for
estimating the average boiling heat transfer coefficient.

20
The end faces of the micro finned tubes are machined to the required diameter and then
soldered to a hollow copper rod (5/8” outside diameter). The soldered joints are leak tested
by pressurizing the fabricated tube at 30 Psi. Once the joints are leak proof, they are filed
to get a smooth surface finish. This is primarily done to eliminate additional nucleation
sites for boiling during experiments.
After soldering, compression fittings are utilized to couple these tubes to the liquid
feedthrough inside the vacuum chamber. Polypropylene compression tube fittings from
Mc-Master-Carr were installed to ensure that the evaporation/boiling process takes place
only on the micro finned tubes during the evaporator characterization experiments. These
compression fittings can withstand very high pressure and temperature (220 Psi and
107°C). Polypropylene fittings are also inert which makes them ideal for high purity
applications such as distilled water [26].
Figure 16 Fabrication of Micro Finned Tube for estimating the average boiling heat transfer
coefficient at Low Pressures. The compression fittings are utilized to couple the tubes to liquid
feedthrough which in turn is connected to the coolant lines.

21
3.2 Calibration of temperature sensor and flow meter
The reliability of the evaporator experiments for estimating the external boiling heat
transfer coefficient largely relies on the accurate measurement of the wall superheat. Hence
the calibration of thermocouples and other temperature sensors was necessary.
Three known standard temperature points, boiling (100° C) and freezing point of water
(0°C) and constant temperature bath of Dry Ice/ Iso-Propyl Alcohol (-77° C) were chosen
to calibrate the K-type thermocouples and RTD probes from Omega Inc. The
thermocouples and RTD probes are inserted in a glass beaker as shown in Figure 17. Care
is taken to ensure that the temperature sensors are not in contact with the walls of the
beaker. The sensors are then connected to a data acquisition system (Agilent 34980A) for
recording the temperature data during the experiments. During each experiment the data is
collected until the temperature becomes steady.
Figure 17 Set up for calibrating the temperature sensors (K-type thermocouple and 4-wire
RTD probes from Omega Inc.) at three standard temperature points. Calibration curve for
the temperature sensor.

22
After the temperature calibration experiments, the measured temperature is compared with
the reference temperature (standard) and a straight line is obtained for each and every
temperature sensor. The resulting straight line equation is then utilized for correcting the
temperature measurement during the evaporator characterization experiments.,
Coolant flow rate impacts the calculated heat flux during the evaporator characterization
experiments. Flow meter (FPR 302) calibration is carried out by pumping 50/50 ethylene
glycol-water mixture (volume) through the sensor and collecting it in a graduated 20 liters
container for 20 seconds (measured using a chronometer). This procedure is repeated for
different flow rates and the recorded readings by flow meter is compared with the
calculated flow rates (Flow rate= collected volume/time). Figure 18 shows the
experimental set up used for calibrating the flow meter and the linear relationship that is
obtained between the calculated flow rate and recorded flow rate by the flow meter (FPR
302) from Omega Inc.
Figure 18 Experimental set up for calibrating coolant flow meter for evaporator
characterization experiments and calibration curve (measured vs recorded data).

23
3.3 Experimental procedure for estimating average boiling heat
transfer coefficient
The set up consists of a cylindrical vacuum chamber 15.2 cm (6 inches) inner diameter and
about 35.6 cm (14 inches) long. The micro finned tube to be tested is placed inside the
vacuum chamber by using a fabricated support structure shown in figure 19. Both the micro
finned tubes to be tested have an outside diameter of 19.05 mm and both the tubes are 1’
long (304.8 mm). The ends of the tube are connected to a series of pumps and a chiller
through a liquid feedthrough port attached to the vacuum chamber. The Polystat
chiller/heater from Cole Parmer (12111-02) is used to control the coolant inlet temperature.
Figure 19 Acrylic support structure utilized for supporting the micro finned tubes during
evaporator characterization experiments
24
The vapor generated inside the chamber during experiments is captured using a set of dry
ice cold traps from Laco Technologies (LIT-10025). The cold traps are connected in
parallel with each other in order to lower the vapor flow rate which increases the residence
time for freezing and ensure better vapor retention capacity. Pressure inside the chamber
is reduced to the required saturation pressure (750 Pa) by using a RV-3 Edwards vacuum
pump that is connected to the vacuum chamber through the cold traps. The vacuum
chamber also has a view port on one end to visualize the boiling process. In addition to
these components, there is a KF 40 butterfly valve from Kurt J. Lesker that is installed on
top of the cylindrical vacuum chamber to control the system pressure. The entire vacuum
chamber is covered with 12.5 mm thick nitrile rubber insulation (k
i
ns
= 0.25 Wm
-1
K
-1
) to
prevent losses. Two PX409 series absolute pressure transducers from Omega Inc. were
installed on both the vacuum chamber and also on the cold trap line to keep track of the
chamber pressure. In order to measure the wall superheat temperature, two K-type
thermocouples are attached to the surface of the tubes and one additional K-type
thermocouple was installed near the tube surface to measure the water temperature (T
sat
).
K-type thermocouples have errors of ± 2.2°C [27]. In addition to this, there were two 4-
wire RTD’s that were measuring coolant inlet and outlet temperature (T
C-IN
, T
C-OUT
). RTD’s
are more accurate than standard K-type thermocouple (. Two more K-type thermocouples
were attached to the top and bottom surface of insulation to measure the heat gain from the
environment. A flow meter (FPR 302) from Omega Inc. and a needle valve were also
attached to the coolant lines right after the pump to measure and control the coolant flow
rate. These sensors are then connected to an Agilent data acquisition system (34980A) to
record the data during experiments.

25
Figure 20 Schematic of experimental set up on the left and actual experimental set up on the
right for estimating the average boiling heat transfer coefficient.
In order to securely attach the thermocouples to the tube surface a Dow-Corning silicone
heat sink compound and a kapton tape was used. The heat sink compound ensured that
there was minimal contact resistance between the thermocouple and the tube surface. A
50-50 ethylene glycol-water mixture (volume) was used as a coolant for these experiments
because of its ability to operate at wider temperature ranges without any phase change.
Before starting the experiments, the water inside the chamber is degassed to remove any
non-condensable gases. This is done by freezing the water and then melting it. The detailed
procedure for degassing is described in the next section. Once degassing is complete, the
vapor valve is closed and the cold traps are filled with dry ice before the vacuum pump is
turned on. Coolant is then circulated at 8 lit/min and at a specific inlet temperature
controlled by the chiller. As soon as the coolant inlet temperature reaches the target
temperature set in the chiller, vapor control valve is opened. The pressure inside the

26
chamber starts to drop. This is accompanied by drop in chamber surface temperature and
liquid water (Refrigerant) temperature. Once the pressure falls below 800 Pa, the vapor
valve is throttled to maintain the chamber pressure around 750 Pa (T
sat
=2.85°C). The
experiment is then continued until the steady conditions are reached. If the vapor valve is
not throttled the pressure in the vacuum chamber drops below 700 Pa and the surface of
water freezes stopping the evaporation/ boiling process inside the chamber.
The experiments are repeated for different coolant inlet temperatures in order to obtain
different wall superheats and corresponding heat fluxes. After a set of data points are
obtained for Tube 1, it is then replaced by Tube 2 and the same experimental procedure is
followed. The average boiling/evaporation heat transfer coefficients, (WK
-1
m
-2
) for
two different types of enhanced surface tubes from Wolverine Tube Inc. were estimated
from an energy balance of the submerged heat exchanger which is shown below.
(5)
Here, (
T
surface
-T
sat
) is the average wall superheat temperature, where
T
surface
is the
average tube surface temperature and T
sat
is the liquid water saturation temperature. A
evap
is the evaporator nominal external surface area (m
2
), is the coolant mass flow rate (
), and and Cp
coolant
are the coolant density (kgm
-3
) and specific heat
capacity (Jkg
-1
K
-1
) evaluated at the average coolant temperature, respectively.
h
e
DT
e
r
coolant

27
Chapter 4: Full scale ECU prototype testing
After structural and thermal analysis, the geometries of both the ECU enclosure and the
heat exchangers were finalized. Manufacturing drawings were prepared using SolidWorks
14.0 and the fabrication of the ECU enclosure along with the evaporator and condenser
heat exchangers were outsourced to Super Radiator Coils (SRC) in Virginia. They were
able to complete the entire manufacturing process along with some preliminary leak tests
in 4 weeks.
Figure 21 Fabrication of evaporator and condenser heat exchangers for the ECU full scale
prototype. The manufacturing of the ECU was outsourced to Super Radiator Coils in Virginia.
There are two primary reasons for conducting component level experiments before
integrating the ECU with the rest of the ATB system. 1) To evaluate the Thermal
performance of the ECU at different coolant flow rates and 2) To explore novel control
strategies for ECU that would not only simplify the ATB system control but also provide
means to tackle cabin preconditioning requirements inside an electric vehicle.

28
4.1 Vacuum leak test for the ECU enclosure
Super Radiator Coils were able to pressure test the heat exchanger coils at 150 Psi and they
also tested for leaks inside the chamber at 3 Psi. However, in order to ensure that the ECU
can hold vacuum for a long period of time (8000 Cycles) a series of vacuum leak tests were
conducted at Northeastern University. The ECU was coupled to a RV-3 vacuum pump
through a set of cold traps that were connected in parallel. There were two KF 40 butterfly
valves in this set up and one was installed near the ECU vapor valve and the other one near
RV-3 Vacuum Pump. Furthermore, PX409 series pressure transducer from Omega was
installed on the pressure transducer port on top of ECU. Figure 22 shows the set up utilized
for conducting vacuum leak tests for the ECU enclosure. Once the set up was complete
both the valves were kept open and the vacuum pump was started. The pressure in the
chamber is reduced below 100 Pa (absolute) and then the vapor control valve was closed.
The data for pressure inside the chamber was collected by connecting the pressure
transducer to an Agilent Data acquisition system(34980A). The chamber was left under
vacuum for over 60 hours and then the data for pressure and temperature inside the chamber
was collected for 24 Hours.
Figure 22 Experimental set up for vacuum leak testing of the ECU (<100 Pa) using RV-3
Edwards vacuum pump and dry ice cold traps (LIT-10025) from Laco technologies.

29
From Figure 23, it is clear that the ECU enclosure can hold vacuum for a considerable
period of time. The small rise in pressure (0.011 Pa/Min) is because of the heat addition
from the environment.
Figure 23 Vacuum leak test for the ECU prototype conducted at Northeastern university.
Small variation of chamber pressure (<10 Pa pressure increase over 24 hours) with respect
to time after 60 hours of vacuum suggests that the chamber is leak proof.
4.2 Degassing methodology
One of the factors that can affect the performance of ECU and the ATB system as a whole,
is the presence of non-condensable gases (NCG). Evaporation/boiling process inside the
ECU strongly depends on the wall superheat temperature. The presence of NCG in the
ECU will increase the total pressure of the system as well as the saturation temperature of
water. Thus reducing the wall superheat temperature considerably affecting the evaporator
performance [28]. During the condensation process any NCG present in the ECU will
accumulate over the condenser tube surface creating an additional resistance to heat
transfer which in turn will reduce the rate of condensation significantly [29]. In order to
30
avoid this problem, a series of degassing cycles were carried out to remove all the non-
condensable gases out of the ECU before conducting any experiments. Removal of NCG
in the ECU is generally carried out by freezing the water to separate working fluid from
NCG [30]. Furthermore, the solubility of NCG decreases at higher temperatures [28].
Hence the degassing procedure followed for removing NCG in the ECU includes a set of
heating and cooling cycles. The experimental set up for degassing includes a RV-3 Edwards
vacuum pump and dry ice cold traps from Laco technologies connected in parallel to each
other. The procedure for degassing is outlined below.
1. Start vacuum pump and open the vapor control valve to reduce the pressure to 500 Pa.
(Refrigerant Starts to Freeze below 600 Pa)
2. Once the chamber pressure reaches 500 Pa, close the vapor control valve and stop the
vacuum pump.
3. Turn on electric heaters that are attached to the bottom plate of ECU.
4. When the chamber temperature reaches 60 °C and chamber pressure is approximately
20 kPa (saturation pressure at 60°C) turn off the heaters.
5. Start vacuum pump and open vapor control valve to reduce the chamber pressure
back to 500 Pa.
6. Close the vapor control valve and allow the chamber to go back to ambient conditions
(Chamber pressure 2400 Pa and Chamber Temperature 21°C).
7. Repeat step 6 and close the vapor control valve to complete degassing cycles for
ECU.
Dry ice cold traps used in this experiment has a very limited capacity for capturing vapor.
Once the cold traps are saturated with vapor the system pressure starts to increase. Thus

31
after each cooling and heating cycle, the cold traps are isolated from the set up by closing
the vapor control valve and the condensed vapor is removed from the cold traps before re-
installing. This process is indicated as “cold trap cleaning” in figure 24 and it ensures that
the cold traps never become saturated with vapor.
Figure 24 Degassing procedure followed for removing non- condensable gases from liquid
refrigerant (water) inside the ECU. Figure also shows the vapor control valve opening and
vacuum pump operation at different pressures.
The amount of water that is lost during degassing cycles is about 2 to 2.5 Liters. Once the
degassing experiments are completed the pressure and the temperature of refrigerant
(water) inside the ECU very precisely matches the saturation conditions and this assures
the elimination of non-condensable gases.

32
Figure 25 Figure shows the plot between chamber temperature and time during degassing
cycles. The heaters installed at the bottom of the ECU are used for heating the ECU
enclosure up to 60°C.
4.3 Thermal performance characterization
After vacuum leak test, the ECU enclosure was insulated with 1” thick nitrile rubber
insulation (k
ins
= 0.25 Wm
-1
K
-1
) to prevent heat addition into the chamber from the
environment. The performance of dry ice cold traps along with vacuum pump used in this
experimental set up mimics the adsorption bed characteristics. Hence the behavior of ECU
with this experimental set up and the control strategies explored would be applicable when
the unit is actually coupled with the adsorption bed. The proxy adsorption bed used for
this experiments consists of an Evans 3 vacuum pump with a total discharge capacity of
5.7 CFM and two dry ice cold traps from Laco Technologies (LIT 10025) with a total vapor
retention capacity of 2 Liters. The schematic of the experimental set up is shown in Figure
26.
0
20
40
60
80
0 100 200 300 400 500
TEMPERATURE (Celsius)
TIME (Minutes)

33
Figure 26 Schematic of experimental set up utilized for the ECU thermal performance testing.
Basic idea behind this experimental set up is that the dry ice cold traps along with vacuum
pump mimics the performance of adsorption bed.
Furthermore, two electric heaters (1150 Watts each) submerged in a coolant bath (5 liters
capacity) and powered by a varying AC power supply were used as thermal load for the
experiments. Two Shurflo diaphragm pumps (5050-1310-D011) connected in parallel and
controlled by a varying DC power supply (BK1900 Precision) is utilized for pumping
coolant (50-50 ethylene glycol-water mixture) at different flow rates into and out of the
chamber. A flow meter (FPD 3004) was used to measure the flow rate and two PX 409
series pressure transducers from Omega were installed for measuring pressure inside the
ECU and also in the cold trap line. Furthermore, a set of two 4-Wire RTD’s (P-M-1/10-
1/4-5-0-PS-4) were installed right next to coolant ports for measuring the coolant inlet and
outlet temperatures for evaporator heat exchangers. In addition to this, one K-type
thermocouple was introduced into the chamber for measuring vapor temperature and two
more K-type thermocouples were installed on top and bottom of the insulation to measure
the losses.

34
Figure 27 Actual experimental set up integrated at Northeastern University for the ECU
thermal performance characterization. Coolant pumps are connected in parallel to deliver a
maximum flow rate of 20 lit/min during experiments.
One of the target performance metrics for ATB system during cooling mode is to provide
chilled coolant at 13° C to the climate core heat exchanger while maintaining a thermal
power of 1600 watts across the evaporator for 4 hours.
Thus in this project, evaporator performance is evaluated by its ability to provide chilled
coolant at various thermal powers during steady state conditions. For evaluating the ECU
thermal performance, the inlet and outlet ports of evaporator heat exchanger were
connected to the coolant lines. Initial set of experiments were conducted at a coolant flow
rate of 20 lit/min and the input power to the electric heaters were controlled by an AC
variable transformer. Before starting each experiments, care was taken to ensure that the
level of refrigerant (distilled water) inside the ECU was always the same (30 mm from the
top surface of evaporator coils). Hence the saturation pressure near the heat exchanger
35
surface between experiments is always constant. After this step, the degassing cycles are
carried out to eliminate the effect of non-condensable gases and during this process, the
amount of water lost inside the ECU is 2 to 2.5 Liters. Thus before the start of each
experiment the height of water column from the top surface of evaporator coils is 24mm.
The vapor valve is closed after the last degassing cycle and then the coolant is circulated
inside the chamber at 20 lit/min without turning on the electric heaters. Once the system
reaches ambient conditions (chamber pressure and temperature at 2400 Pa and 21° C) and
the coolant inlet and outlet temperatures becomes steady, the electric heaters are turned on
by applying a constant voltage.
The vapor control valve is then slowly opened to drop the pressure inside the chamber. As
soon as the chamber pressure approaches 800 Pa, the vapor valve is adjusted accordingly
to keep the pressure constant at 750 Pa. This in turn will regulate all the other parameters
within the system and the experiment is continued until the system reaches steady
conditions. The same experimental procedure is then repeated for different thermal powers
and at different coolant flow rates.
36
Chapter 5: Results and discussion
5.1 Boiling performance of enhanced surface tubes
Figure 28 shows the plot between heat flux and average wall superheat for two types of
enhanced surfaced tubes from Wolverine Inc. and also compares it with the Rohsenow’s
model. It is evident from the graph that Rohsenow’s model was under predicting the
performance of the Tube 2 (S/T Trufin®). Tube 2 with regular circular fins that are closely
spaced on the outside diameter seems to perform much better than Tube 1 which has
staggered fins on its outside diameter. One of the reasons for this may the larger surface
area of Tube 2 that is available for convection at these low superheat temperatures.
Heat fluxes measured for Tube 2 were approximated using a third order polynomial
function of the wall superheat (ΔTe), q”
evap/boiling
= 108.77ΔTe
3
- 1315.9ΔTe
2
+ 7389.8ΔTe
– 14394. This approximation (shown as average model in Figure) was fed into the finite
difference model (FD) developed at Northeastern University to determine a heat transfer
rate of about 2800 W (a safety factor of 1.7 was used for the target thermal power) when
the coolant enters the evaporator at 10.3°C and 20 lit/min and the chamber pressure is at
750 Pa.
At low superheat temperatures (4-7°C), the variations in heat flux for the same wall
superheat temperature is significant. Hence a worst case scenario of thermal performance
was evaluated using the lowest heat flux measured when the superheat temperature was
between 4 and 7° C. This model is labelled as lower limit model in the figure 28. Here the
heat flux and superheat has an exponential relationship, q”
evap/boiling
= 8.1717exp
(1.052ΔTe). This model was then fed into the FD model and the evaporator heat transfer

37
rate was 1610 Watts (no safety factor for the target thermal power) when coolant enters at
10.3°C and at 20 lit/min with chamber pressure at 750 Pa.
Figure 28 Variation of average wall superheat with heat flux for tube 1 and tube 2. Results
show that Rohsenow’s model clearly under predicts the performance of Tube 2 at low
pressure (750 Pa).
5.2 Thermal performance of full scale ECU prototype
ECU performance experiments were conducted for different thermal powers (450 – 1200
Watts) and at two different flow rates (10 Lit/Min and 20 Lit/Min). The thermal power was
evaluated using the following equation,

38
)T(TCpmP
outcoolantincoolantcoolantcoolantth
(6)
Where
coolant
m
is the mass flow rate of coolant (Kg/sec),
coolant
Cp
is the specific heat
capacity of coolant (J/kg K),
outcoolantincoolant
T&T
(K) are the coolant inlet and outlet
temperatures, respectively.
As soon as the experiment is started with the vapor control valve in the fully opened
position, there is a high peak in the thermal power mainly because of the thermal mass of
the coolant tank utilized in the experimental set up. This transient behavior may differ
during ATB system testing. Figure 32 shows the variation of thermal power with time
during the evaporator performance experiments for three different powers.
Figure 29 Thermal Power Vs Time shows the Transient Behavior of ECU during
performance evaluation experiments. The initial peak in the thermal power is because of the
thermal mass of the coolant tank utilized for this experiments.

39
Even though the transient behavior of ECU will vary when the proxy set up (vacuum pump
and dry ice cold traps) is replaced by the adsorption bed, the steady coolant temperatures
(inlet and outlet) will remain the same for every thermal power evaluated (450 to 1200
Watts) during these experiments. This knowledge of steady coolant outlet temperature
leaving the ECU at different powers will be very useful for maintaining the passenger cabin
at the desired temperatures for climate control.
Figure 30 Thermal Power Vs Coolant Outlet Temperature at Steady State for Two different
flow rates (10Lit/Min and 20 Lit/Min). The maximum power tested (1270 Watts) was limited
by the capacity of vacuum pump and cold traps.
Figure 33 shows the variation of coolant outlet temperature with thermal power at two
different flow rates. The results obtained demonstrated a coolant outlet temperature <11°C
and evaporation thermal powers up to 1270 Watts at steady state conditions. The maximum
thermal power tested with this set up is limited by the pumping power of the vacuum pump

40
and cold trap capacity. However, these results suggest that the ECU could provide coolant
at 13° C while maintaining a thermal power of 1600 Watts across the evaporator which in
turn is one of the performance metrics for ATB.
5.3 Optimization of vapor control valve for climate control in EVs
The ability to control the extent of cooling and heating supplied to the EV-cabin is one of
the requirements for practical implementation of ATB system [10]. Experiments from
thermal performance evaluation of evaporator revealed that at each steady power there was
a corresponding angle for the vapor control butterfly valve at which the entire system
reached steady state conditions. As the steady state thermal power increased, the valve
angle also increased towards the fully open position. This formed the baseline for the series
of control strategies that were explored. However, with the available vacuum pump exhaust
rate and cold traps capacity the thermal power tested was limited to 1300 watts.
Figure 31 Vapor control butterfly valve used for full scale ECU thermal performance
characterization experiments on the left and variation of valve angle with thermal power on
the right.

41
Experiments were also conducted at two different flow rates for a given steady state thermal
power. The variation of vapor control valve angle with steady state thermal power and at
two different flow rates is shown in figure 29. It is evident form the figure that the vapor
control valve angle is independent of changes in coolant flow rate.
Figure 32 Variation of Vapor Control Valve Angle with Thermal Power for Two Different
Flow rates. The results suggest that the valve angle is independent of coolant flow rate.
In order to find the effect of refrigerant level on valve angle, experiments were conducted
at three different refrigerant levels from the top surface of the evaporator coils. These
experiments revealed two important results 1) the steady state coolant outlet temperature
is not constant at different refrigerant level for a given thermal power and 2) the vapor
control valve angle remained the same for a given thermal power at different refrigerant
levels. Thus the valve angle is independent of both coolant flow rate and refrigerant level.
20
28
36
44
52
60
300 500 700 900 1100 1300 1500
VALVE ANGLE (Degree)
Thermal Power (Watts)
10 Lit/Min
20 Lit/Min

42
This dependability of valve angle on only one parameter reduces the ATB system
complexity in terms of control. Figure 30 shows the variation of coolant outlet temperature
at different refrigerant levels from the top surface of evaporator coils inside the ECU.
Figure 33 Plot between thermal power and coolant outlet temperature at three different
refrigerant levels from the top surface evaporator coils inside the ECU.
5.4 Control Strategies for vehicle-preconditioning and cabin climate
control
Vehicle preconditioning is one of the common features of modern EVs and it allows the
passenger to start their journey with a desired cabin temperature [31]. So in order to achieve
this using the ATB system, the ECU should deliver very low coolant temperature at a very
high thermal power for a short period of time.
5
6
7
8
9
10
11
300 500 700 900 1100 1300
Coolant Outlet Temp (
°C)
Thermal Power (W)
15 mm from
evaporator
30 mm from
Evaporator
24 mm from
evaporator
43
The initial transient behavior of the ATB system at the beginning of the adsorption process
provides a window of opportunity for extracting high thermal power while supplying
coolant at a fairly low temperature (13°C). Hence the main objective of the different control
strategies explored was to modulate this high initial transient power to a lower value but
for longer periods of time either by controlling the pressure (by throttling the vapor valve)
or by controlling the coolant flow rate. A third hybrid control strategy of controlling both
pressure and coolant flow rate in order to maintain peak initial power was also pursued
during the component level testing of the ECU.
Besides the need to extract high initial transient power and acquiring the desired coolant
outlet temperature, the fundamental reason to throttle the vapor valve and control the
pressure drop inside the chamber is to avoid freezing of the refrigerant (water). Hence the
basic control for the ECU involves manually throttling the vapor control valve when the
system pressure approaches 800 Pa and then controlling the valve opening until the
pressure reaches a steady value of 750 Pa. In this base-line control, the flow rate is kept
constant at a design value of 20 lit/min and only the chamber pressure is controlled to reach
the steady state conditions. The figure 34 depicts the pressure and time at which the vapor
control valve was manually throttled in order to reach a steady state pressure of 750 Pa.
This strategy along with the flow control can greatly reduce the complexity and cost of the
ATB system control.

44
Figure 34 The base-line control strategy for the ATB system requires the control of the vapor
valve until a steady evaporation pressure is achieved. This figure shows the variation of
pressure (top left), coolant outlet temperature (to right), coolant flow rate (bottom left), and
Thermal power (bottom right).
In the next control strategy (ALT 1) the knowledge of vapor control valve angle for
achieving a given thermal power along with flow control were utilized to maintain the peak
initial transient power for considerable period of time before reaching the steady state
power. In this strategy (ALT 1), the experiment was started at a low coolant flow rate (15
lit/Min) and then it was gradually increased to maintain the peak initial transient power
until it reached a target flow rate of 20 Lit/min. Once the flow rate reaches its maximum
value, the vapor valve was immediately set at a particular angle to reach the corresponding
steady state thermal power. Figure 35 depicts this first hybrid control strategy.

45
Figure 35 ALT 1 control strategy (maximization of thermal power) This hybrid control
strategy for the ATB system targets to have a constant thermal power delivered during the
beginning of the evaporation experiment. This figure compares ALT 1 strategy with the
Original strategy (base-line control) on the temporal variation of pressure (top left), coolant
outlet temperature (to right), coolant flow rate (bottom left), and Thermal power (bottom
right).
This control strategy (ALT 1) provides an opportunity to extract high initial thermal power
for a considerable period of time and save energy (reducing the amount of refrigerant
adsorbed) by reaching the steady state power at a much faster rate than the original control
strategy. One of the drawback of this control is that the coolant temperature reduction rate
is lower than the original control strategy (>13°C for more than 30 minutes) which will
affect the temperature of the air blown into the EV passenger cabin.
46
The second alternative control strategy (ALT 2) involves starting the experiment with no
coolant flow and allowing the system pressure to drop to 1500 Pa. The system pressure is
lowered to this target pressure (1500 Pa) within a few seconds from the start of the
experiment as there is no evaporation/boiling inside the ECU. As soon as the system
reaches 1500 Pa (T
sat
=13°C), the coolant is pumped into the system at a very low flow rate
(10 Lit/min) and then it is gradually increased to 20 lit/min to maintain the peak initial
transient power. Meanwhile, the system pressure keeps dropping and then the vapor control
valve is set at a pre-determined angle when the system reaches 700 Pa. As soon as the valve
is throttled from the fully opened position to the target angle, the pressure in the system
spikes up initially and then equilibrates to the steady state pressure of 750 Pa.
This control strategy provides the possibility of maintaining a high initial thermal power
for a considerable period of time while at the same time lowering the coolant outlet
temperature at a much faster rate than the previous control strategies (< 10°C in 15 mins).
Hence this strategy will have an important impact in the preconditioning process of an
electric vehicle. In addition to this, reducing the ECU pressure from ambient conditions
(2400 Pa) to lower pressure (1500 Pa) without any coolant flow has significantly reduced
the amount of refrigerant adsorbed. Hence by adopting this control strategy, the ECU can
provide coolant at lower temperatures (< 15°C) for a longer period of time when compared
with the previous strategy. At peak summer conditions the ECU should be able to cool the
cabin air temperature from 43°C to 21°C in a short period of time and the initial ECU
pressure will be 6000 Pa (Tsat = 36°C) before the start of adsorption. ALT 2 control will
be the best strategy to use in order to ensure that the ECU can meet preconditioning
requirements and also provide coolant at a lower temperature for a longer period of time.

47
Figure 36 ALT 2 Control Strategy (faster reduction of coolant temperature) This hybrid
control strategy for the ATB system targets to have a higher temperature reduction rate of
the coolant leaving the evaporator heat exchanger. This figure compares this ALT 2 strategy
with the Original strategy on the temporal variation of pressure (top left), coolant outlet
temperature (to right), coolant flow rate (bottom left), and Thermal power (bottom
right).
Exploration of these control strategies can eliminate the need for expensive/complex
control systems and feedback devices which in turn can make the system more robust and
cost effective. Figure 37 compares all the three control strategies in terms pressure, flow
rate, coolant outlet temperature and thermal power.
48
Figure 37 This figure compares ALT 1 and ALT 2 control strategy with Original strategy
on the temporal variation of pressure (top left), coolant outlet temperature (to right), coolant
flow rate (bottom left), and Thermal power (bottom right).
49
Chapter 6: Conclusions and future work
Experimental determination of average boiling heat transfer coefficient has refined the
design of the ECU. However, because of the large fluctuations in heat flux and average
wall superheat during the experiments, a very high safety factor (1.5) has been used to
ensure that the ECU can the meet the target performance metrics of the ATB system.
The final ECU enclosure design was modeled after several fitting exercises to ensure that
the entire unit fits inside the hood of an electric vehicle and also facilitate vapor transport
to the adsorption bed without any major mass transfer resistance. The fabrication of the
ECU was outsourced to Super Radiator Coils in Virginia and they were able to
manufacture the entire enclosure with preliminary leak tests in 4 weeks.
Even though the ECU design meets the size metrics of the project, the volume and weight
of the enclosure is still on the higher end. One way to reduce the weight is to use a light
weight enclosure material like aluminum instead of stainless steel. However, in order to
use a light weight material like Aluminum, a special coating is required for the enclosure
walls to prevent its interaction with refrigerant (water) so that there are no generation non-
condensable gases.
The accuracy of evaporator characterization experiments for predicting the boiling heat
transfer coefficient at low pressures can be improved by slightly altering the experimental
set up. The major fluctuations in the heat flux for a given wall superheat can be reduced
significantly by utilizing cartridge heaters to heat the tube surface. This also prevents the
variation of surface temperature along the length of the heat exchanger.
50
From the ECU thermal performance evaluation, it was evident that for each and every
thermal power there was a corresponding angle for the vapor control valve at which the
entire system reached steady state conditions. This valve angle was independent of both
coolant flow rate and refrigerant level inside the ECU and was dependent only on the
thermal power. This dependability of valve angle on only one parameter reduces the ATB
system complexity in terms of control.
ECU full scale prototype testing also showed that the ECU could provide coolant at a
temperature <11° C and maintain a thermal power of 1270 watts during steady state
conditions. The thermal power tested was limited to 1300 watts because of the vacuum
pump and cold traps capacity. However, these results suggest that the ECU could deliver
coolant at 13° C to the climate core heat exchanger while maintaining a thermal power of
1600 watts across the evaporator thus meeting the performance metrics for the ATB system
during cooling mode. The knowledge of coolant outlet temperatures at different thermal
power can be useful for maintaining desired cabin temperatures.
The different control strategies explored during the component level testing of the ECU
has their own advantages/ disadvantages and all these strategies can be implemented in the
ATB system operation based on the power requirements and the desired cabin air
temperature. These strategies have significantly reduced the complexity, weight and cost
of the vapor control valve (initially estimated as $6500 by MKS Instruments).
51
REFERENCES
[1] D. L. Greene, H. H. Baker, Jr., and S. E. Plotkin, “Reducing greenhouse gas
emission from US transportation,” Center for Climate and Energy Solutions,
Arlington,VA, 2011.
[2] C. Samaras and K. Meisterling, “Life Cycle Assessment of Greenhouse Gas
Emissions from Plug-in Hybrid Vehicles: Implications for Policy,” Environ. Sci.
Technol., vol. 42, no. 9, pp. 3170–3176, May 2008.
[3] S. Ashley, “Adsorption-based Thermal Batteries Could Help Boost EV Range by
40%.,” 2013. [Online]. Available: http://articles.sae.org/12376/.
[4] J. Bartlett, “Survey: Consumers express concerns about electric, plug-in hybrid
cars. Consumer Reports,” January 30, 2012. [Online]. Available:
http://www.consumerreports.org/cro/news/2012/01/survey-consumers-express-
concerns-about-electric-plug-in-hybrid-cars/index.htm.
[5] B. Bulterer and R. Bulton, “Alternative technologies for automobile air
conditioning,” Air Conditioning and Refrigeration Center, College of Engineering.
University of Illinois at Urbana-Champaign, 1991.
[6] R. A. Barnitt, A. D. Brooker, L. Ramroth, J. Rugh, and K. A. Smith, “Analysis of
Off-Board Powered Thermal Preconditioning in Electric Drive Vehicles,” in 25th
World Battery, Hybrid and Fuel Cell Electric Vehicle Symposium & Exhibition,
Shenzhen, China,2010.
52
[7] X. Li, S. Narayanan, V. K. Michaelis, T.-C. Ong, E. G. Keeler, H. Kim, I. S. McKay,
R. G. Griffin, and E. N. Wang, “Zeolite Y adsorbents with high vapor uptake
capacity and robust cycling stability for potential applications in advanced
adsorption heat pumps,” Microporous Mesoporous Mater., vol. 201, pp. 151–159,
Jan. 2015.
[8] A. S. Umans, “Small-scale Advanced Thermo-Adsorptive Battery prototype,” M.S
thesis, Dept. Mech. Eng, MIT, Cambridge, MA, 2015.
[9] S. Narayanan, X. Li, S. Yang, I. McKay, H. Kim, and E. N. Wang, “Design and
Optimization of High Performance Adsorption-Based Thermal Battery,” in Volume
1: Heat Transfer in Energy Systems; Thermophysical Properties; Theory and
Fundamental Research in Heat Transfer, 2013, July, p. V001T01A044.
[10] S. Narayanan, X. Li, S. Yang, H. Kim, A. Umans, I. S. Mckay, and E. N. Wang,
“Thermal battery for portable climate control,” vol. 149, pp. 104–116, 2015.
[11] I. S. Mckay, “A Monolithically Integrated Thermo-Adsorptive Battery,” M.S thesis,
Dept. Mech. Eng, MIT, Cambridge, MA, 2014.
[12] S. Narayanan, H. Kim, A. Umans, S. Yang, and X. Li, “A Thermophysical Battery
for Storage-based Climate Control†,” pp. 1–14 unpublished.
[13] H. Kim, “Experimental Characterization of Adsorption and Transport Properties for
Advanced Thermo-Adsorptive Batteries,” M.S thesis, Dept. Mech. Eng, MIT,
Cambridge, MA, 2014.
[14] Solidworks express and Tech Tips, “How to use symmetry and anti-symmetry
boundary conditions.” [Online]. Available:
https://www.clear.rice.edu/mech403/HelpFiles/CW_sym_anti-symmetry_BC.pdf.
53
[15] H. H. Lee, Finite Element Simulations with ANSYS Workbench 16. SDC
Publications, 2015.
[16] V. B. Bhandari, Design of Machine Elements. Tata McGraw-Hill, 2010.
[17] Design Guidelines for the Selection and Use of Stainless Steel, Nickel Development
Institute,2000, pp.1-52.
[18] W. R. McGillis, V. P. Carey, J. S. Fitch, W. R. Hamburgen, and V. P. Carey, “Pool
boiling on small heat dissipating elements in water at subatmospheric
pressure,”WRL (Western Research Laboratory) Research Report, vol. 159, pp. 27–
36, 1991.
[19] F. Giraud, R. Rullière, C. Toublanc, M. Clausse, and J. Bonjour, “Experimental
evidence of a new regime for boiling of water at subatmospheric pressure,” Exp.
Therm. Fluid Sci., vol. 60, pp. 45–53, Jan. 2015.
[20] L.-H. Yu, S.-X. Xu, G.-Y. Ma, and J. Wang, “Experimental Research on Water
Boiling Heat Transfer on Horizontal Copper Rod Surface at Sub-Atmospheric
Pressure,” Energies, vol. 8, no. 9, pp. 10141–10152, Sep. 2015.
[21] W. R. McGillis, J. S. Fitch, W. R. Hamburgen, and V. P. Carey, “Pool boiling
enhancement techniques for water at low pressure,” in Semiconductor Thermal
Measurement and Management Symposium, 1991. SEMI-THERM VII.
Proceedings., Seventh Annual IEEE, 1991, pp. 64–72.
[22] K. Wang and E. A. Vineyard, “Adsorption Refrigeration: new opportunities for
solar,” Ashrae, vol. 53, pp. 14–24, 2011.
[23] MEGlobal, “Ethylene Glycol Product Guide,” MEGlobal, 2008. [Online].
Available: http://www.meglobal.biz/media/product_guides/MEGlobal_MEG.pdf.
54
[24] Wolverine Tube, “For Refrigeration , Petrochemical , Chemical , and LNG
Applications,” 2009. [Online]. Available: http://www.wlv.com/wp-
content/uploads/2014/03/TurboChil.pdf.
[25] Wolverine Tube, “S / T Trufin ®,” 2009. [Online]. Available:
http://www.wlv.com/wp-content/uploads/2014/03/S-T_Trufin.pdf.
[26] “Jaco compression tube fittings,” 2015. [Online]. Available:
https://www.fws.co/specifications/JACO-Fittings-Catalog-2015.pdf.
[27] National Institute of Standards and Technology, “Type K thermocouple reference
Table,” 2011. [Online]. Available: http://www.omega.com/temperature/Z/pdf/z204-
206.pdf.
[28] H. A. Kariya, “Development of an Air-cooled, Loop-type Heat Pipe with Multiple
Condensers,” Ph.D. dissertation , Dept. Mech. Eng, MIT, Cambridge, MA, 2012.
[29] S. B. Al-Shammari, D. R. Webb, and P. Heggs, “Condensation of steam with and
without the presence of non-condensable gases in a vertical tube,” Desalination, vol.
169, no. 2, pp. 151–160, Oct. 2004.
[30] Labconco Corporation, “A Guide To Freeze Drying for the Laboratory,” 2010.
[Online]. Available:
http://www.coleparmer.com/assets/MoreInfo/Labconco_guide_freeze_dry_in_lab.
pdf.
[31] T. Moloughney, “Understanding How Preconditioning Works,” 2015. [Online]
Available: http://bmwi3.blogspot.com/2015/03/bmw-i3-understanding-how.html.
