
Primary Care Prescribing
REPORT BY THE COMPTROLLER AND AUDITOR GENERAL
27 November 2014


Primary Care Prescribing
Published 27 November 2014

This report is being published under Article 8 of the Audit (Northern Ireland) Order 1987 for presentation
to the Northern Ireland Assembly in accordance with Article 11 of that Order.
K J Donnelly Northern Ireland Audit Office
Comptroller and Auditor General 27 November 2014
The Comptroller and Auditor General is the head of the Northern Ireland Audit Office employing some
145 staff. He and the Northern Ireland Audit Office are totally independent of Government. He certifies
the accounts of all Government Departments and a wide range of other public sector bodies; and he
has statutory authority to report to the Assembly on the economy, efficiency and effectiveness with which
departments and other bodies have used their resources.
For further information about the Northern Ireland Audit Office please contact:
Northern Ireland Audit Office
106 University Street
BELFAST
BT7 1EU
Tel: 028 9025 1100
email: info@niauditoffice.gov.uk
website: www.niauditoffice.gov.uk
© Northern Ireland Audit Office 2014


Primary Care Prescribing
Contents
Contents
Executive Summary 1
PART 1: Background and Scope of Report 7
In Northern Ireland, the Health and Social Care Board contracts external
providers to supply pharmaceutical services to the public 8
In 2013 community pharmaceutical services cost £460 million and CPCs
dispensed almost 39 million prescription items 8
High level comparison of the number and cost of prescriptions elsewhere in
the United Kingdom indicates that there is potential for improving cost effective
prescribing in Northern Ireland 9
Purpose and Scope of our review 14
PART 2: Community Pharmacy Contractors’ Reimbursement 15
Over time, the number of pharmacy outlets in Northern Ireland has risen while
the number of CPCs has fallen 16
Northern Ireland CPCs dispense more prescriptions per head of population
than those in England and Scotland 17
In 2012-13 CPCs received £460 million for providing community
pharmaceutical services 18
Reimbursement costs are the most significant element of the funding package 19
The majority of reimbursement costs each year relate to ‘branded’ drugs 19
NI reimbursement rates for dispensing certain ‘generic’ drugs were based
on the Scottish Drug Tariff but this led to legal challenge 19
The legal action has cost the Department £550,000 CPCs received
compensation of some £6 million. A further £40 million was made available
to CPCs over the seven year period to 2011 23
Part 3: Trends in General Practitioner (GP) Prescribing Practice 25
The volume of prescribed drugs has increased at a steady rate over recent
years but costs have fallen substantially since 2010 27

Primary Care Prescribing
Contents
There have been a range of influences which have helped to contain the
cost of primary care prescribing 29
HSC Board Medicines Management Advisors have been instrumental in
ensuring prescribing efficiencies are generated 30
British National Formulary (BNF) 31
The use of an ‘unclassified’ category prevents comprehensive analysis
of prescribing patterns 33
Variations in regional prescribing rates which cannot be fully explained by
differences in population demographics suggests that it may be possible to
improve the quality of prescribing further 35
Part 4: The Scope for More Efficient and Effective Prescribing 39
The Department, HSC Board and GPs are to be commended for the savings
generated from improving the rate of generic prescribing 41
There is wide variation in the cost of prescribing per head of population
across individual GP practices locally 42
There is scope to make further savings from prescribing without affecting
patient care 44
Earlier switching to cheaper generic stomach acid treatments (Proton Pump
Inhibitors (PPI)) would have resulted in additional efficiency savings of
£2.2 million in 2012 and £1 million in 2013 45
Switching to less expensive statins would have saved around £2.7 million
in 2012 and £2.5 million in 2013 47
Earlier switching to alternative generic drugs in the treatment of depression
would have resulted in additional efficiency savings of £2.7 million in
2012 and £1.6 million in 2013 51
More money is spent prescribing Pregablin in NI than on any other drug.
Pregablin is more frequently prescribed in NI than elsewhere in the UK 55
Appendices 59
Appendix 1: Generic Drug Categories 60
Appendix 2: Legal challenge to new Drug Tariff 61

Primary Care Prescribing
Abbreviations
ABPI Association of British Pharmaceutical Industry
APP Annual Professional Practice Allowance
BNF British National Formulary
BSO Business Service Organisation
CoSI Cost of Service Investigation
CPC Community Pharmacy Contractor
CPNI Community Pharmacy Northern Ireland
DHSSPS Department of Health, Social Services and Public Safety
GMS General Medical Services
GP General Practitioner
HSC Health and Social Care
HSCB Health and Social Care Board
JR Judicial Review
LDL Low Density Lipoprotein
MMA Medicines Management Adviser
NAO National Audit Office
NHS National Health Service
NI Northern Ireland
NIAO Northern Ireland Audit Office
NICE National Institute of Health and Clinical Excellence
PCC Pharmaceutical Contractors Committee
PCEP Pharmaceutical Clinical Effectiveness Programme
PIS Prescibing Incentive Scheme
PPI Proton Pump Inhibitor
PPRS Pharmaceutical Price Regulation Scheme
PU Prescribing Unit
QOF Quality and Outcomes Framework
RIA Regulatory Impact Assessment
UK United Kingdom
WTE Whole Time Equivalent

Primary Care Prescribing
Contents
Glossary of terms
Association of British
Pharmaceutical
Industry (ABPI)
Represents biopharmaceutical companies and is recognised by government
as the industry body negotiating on behalf of the branded pharmaceutical
industry for statutory consultation requirements including the pricing scheme for
medicines in the UK.
British National
Formulary (BNF)
A joint publication of the British Medical Association and the Royal
Pharmaceutical Society. It aims to provide prescribers, pharmacists, and other
healthcare professionals with sound, up-to-date information about the use of
medicines.
Community Pharmacy
Contractor (CPC)
Dispenses health service prescriptions after application and acceptance
onto the Health and Social Care pharmaceutical list. Applications can be
made by registered pharmacists or non-pharmacists, partnerships or bodies
corporate, as long as a registered pharmacist is employed.
The Comprehensive
Spending Review
(CSR)
The Comprehensive Spending Review sets out the Government’s objectives
and priorities and allocates resources accordingly.
Cost of Service Inquiry
(COSI)
Identifies and quantifies the various NHS costs involved in delivering
community pharmacy services.
Generic drugs
A pharmaceutical product no longer protected by a patent which can be
copied by other companies. It may be marketed either under its own brand
or as an unbranded product. Generic drugs are frequently as effective as,
but much cheaper than, brand-name drugs, because their manufacturers do
not incur the risks and costs associated with the research and development of
innovative medicines.
Generic Prescribing
Current policy is that generic medicines should be prescribed in all
appropriate circumstances. It is considered that around 75 per cent of
medicines can be dispensed generically.
Judicial Review
A process by which the courts review the lawfulness of a decision made (or
sometimes lack of a decision made) or action taken (or sometimes failure to
act) by a public body. A judge considers whether a public body has acted in
accordance with its legal obligations and if not, can declare a decision taken
by it invalid.
Local Commissioning
Groups (LCGs)
There are five Local Commissioning Groups in Northern Ireland (Belfast,
Northern, South Eastern, Southern and Western). LCGs are committees of the
Health and Social Care Board and are responsible for commissioning health
and social care for their local population. They also have responsibility for
planning and delivering health and social care to meet assessed needs.

Primary Care Prescribing
Medicines Management
Advisers (MMAs)
Pharmacists employed by the Health and Social Care Board who work
with GP surgeries in order to support the safe effective and efficient use of
medicines in primary care.
Prescription Item
A medicine, appliance or device written by a practitioner onto an appropriate
prescription form.
National Institute
for Health and Care
Excellence (NICE)
An executive non departmental public body of the Department of Health in
the United Kingdom. NICE provides guidance on current best practice in
health and social care, including public health, to the NHS in England and
Wales. All NICE guidance published since 1 July 2006, is reviewed locally,
for its applicability to Northern Ireland and, where applicable, is endorsed
for implementation.
Community Pharmacy
Northern Ireland
(CPNI)
The local representative body for community pharmacist contractors provide
services under the National Health Service in Northern Ireland. It negotiates
on services, the pharmacy contract and remuneration and reimbursement
with the Health and Social Care Board and the Department of Health, Social
Services and Public Safety.
Pharmaceutical
Clinical Effectiveness
(PCE)
A systematic approach to rational product selection and use, consistently
applied across secondary and primary care, taking account of clinical
need, evidential product clinical performance, product presentation, safety
characteristics and economic factors. The process can be applied to
medicines, wound care and medical and surgical disposable products.
Pharmaceutical Price
Regulation Scheme
(PPRS)
A non-contractual, 5 year, voluntary scheme between UK Government and
Industry covering all the relevant key issues that underpin the pricing of the
majority of NHS branded medicines.
Northern Ireland
Prescribing Units
(NI-PU)
Weight individual General Practitioner (GP) practices or Local Commissioning
Groups’ populations for age, gender and need to enable comparison of
prescribing patterns. The figures are based on cost of prescribing across all
therapeutic areas. The cost based weightings are standardised (based on a
female aged 5-15). Comparisons can therefore take account, for example, of
the greater needs of elderly people and of people living in deprived areas or
whose socio-economic circumstances mean they have higher than NI average
need for prescribing resources.
Regulatory Impact
Assessment (RIA)
A detailed and systematic appraisal of the potential impacts of a new
regulation. New regulations should only be introduced when other
alternatives have been considered and rejected and where the benefits justify
the costs.


Executive Summary

1. Most health service drug expenditure is
incurred in primary care where General
Practitioners (GPs) prescribe medicines
or treatments to address the clinical
needs of patients. The role of GPs in
deciding how resources should be spent
on these drugs is, therefore, key. Patient
consultations with GPs have increased
by almost 22 per cent over the six year
period to 2013-14. The trend in rising
patient consultations with GPs is likely to
continue due to the following drivers:
• Like all UK regions the population of
older people is increasing
1
;
• Poor lifestyles are a threat to
population health particularly in
lower socioeconomic groups;
• Overuse, sub optimal use and abuse
of prescription medicines; and
• Pharmaceutical innovation and
medical advances.
2. Decisions on which medication or
treatment is prescribed rests with the
GP and these decisions are highly
regulated and controlled. However,
patients’ requests and expectations
(and prescribers’ perceptions of these)
2 Primary Care Prescribing
Executive Summary
can influence prescribing behaviour.
Further, the decision on whether or not
to consume prescribed medication rests
with the patient.
3. Once in receipt of a prescription,
the patient takes it to a Community
Pharmacy Contractor (CPC)
2
. The
CPC dispenses the drug in question,
currently at no charge to the patient.
CPCs are responsible for purchasing the
drugs either directly from manufacturers
or through wholesalers. They are
subsequently reimbursed by the Health
and Social Care (HSC) Board for the
cost of these drugs.
4. In 2013 CPCs received almost
£460 million for providing community
pharmaceutical services, which included
reimbursement
3
of £381 million for
dispensing almost 39 million items
prescribed by GPs.
5. This report demonstrates that demand for
primary care medicines is characterised
by a particularly complex and unique set
of relationships, in which:
• Patients neither decide nor directly
pay (currently) for the medicines they
consume;
1 Office of National Statistics, National Population Projections, 2012-based Statistical Bulletin
2 The Health and Social Care (HSC) Board is legislatively required to make arrangements for the provision of community
pharmaceutical services in Northern Ireland. In practice, it contracts out these services to Community Pharmacy Contractors
(CPCs). In 2014, the HSC Board had contracts with 225 CPCs who dispensed prescriptions from 535 pharmacies.
According to Office of Fair Trading (Evaluating the Impact of the 2003 OFT Study on the Control of Entry Regulations in the
Retail Pharmacies Market (March 2010)); NHS Information Centre, (General Pharmaceutical Services in England, 2001-
2002 to 2010-2011 (November 2011)), the combined share of this market among the larger multiples and supermarkets
is now estimated to be slightly over 50 per cent.
3 Traditionally arrangements for reimbursing NI CPCs followed those in place elsewhere in the UK. However, new contractual
arrangements which were adopted in England, Wales and Scotland were rejected by NI CPCs and they subsequently
legally challenged the continued reliance on the UK Drug Tariff in NI. The legal challenge was upheld. Subsequent
negotiations failed to find a resolution and NI CPCs again took legal action. Again the legal challenge was upheld. No
resolution has yet been found and negotiations continue.

Primary Care Prescribing 3
• GPs decide which medicines should
be used but are not responsible
for the cost of what they prescribe;
whereas
• the HSC Board pays for medicines
by reimbursing pharmacies
for dispensing them but is not
responsible for deciding which
medicines are to be prescribed.
6. Against the background of these
relationships, the main thrust of this report
is that more rational prescribing by
GPs can achieve significant economies
in drug expenditure and release
money from within the drugs budget
without compromising patient care. It
is acknowledged that between 2006
and 2013, the cost of prescribing was
reduced in real terms by 18 per cent.
7. As the drugs budget is spent
predominantly by GPs, the HSC Board
does not directly control prescribing
behaviour. Moreover, the prescribing
decisions GPs make can be affected
by a range of factors, such as patient
need, clinical guidance, access to good
information and the marketing activities
of the pharmaceutical industry
4
. A key
challenge for the Board, therefore, is
to effectively influence the prescribing
behaviour of GPs.
8. We acknowledge the key role played
by the Board’s Medicine Management
Advisers (MMAs) in instigating and
facilitating change through the promotion
of more rational, safe, economic
and effective prescribing among GP
practices. While MMAs have little
power to compel doctors to prescribe
in a particular way, they have had
considerable success in working
alongside GP practices to facilitate
change and generate savings in the
prescribing budget. For instance, while
the volume of prescriptions increased
by around 5 per cent between 2010
and 2012, the cost of prescribing these
drugs has decreased by just over 7 per
cent in the same period. Commendably,
one of the reasons for the reduction in
costs is that generic prescribing rates
have improved considerably in NI over
recent years and are now on a par
with levels elsewhere in the UK. Also,
the variations between practices have
reduced significantly over the period
2010 to 2013.
9. The report draws particular attention to
the continuing variations shown by data
on prescribing activity and prescribing
expenditure, both between GP practices
locally and with their peers in other
parts of the UK using national data. We
found variations in the volumes and cost
of prescribing which did not appear to
match variations in indicators of clinical
need, such as disease prevalence.
The HSC Board regard Quality and
Outcomes Framework (QOF) data on
disease prevalence as extremely useful
4 House of Commons Health Committee, The Influence of the Pharmaceutical Industry, 5 April 2005.

4 Primary Care Prescribing
Executive Summary
for assessing clinical need and planning
service development. However, the
Department considers that the use of
QOF data in reaching any conclusion
on relative need between populations
is erroneous. It told us it had been
advised by the Northern Ireland Statistics
and Research Agency and the Health
and Social Care Information Centre in
England that QOF data is unsuitable as
a measure of need in this context. Our
report stresses the importance of the
HSC Board and GPs using all available
sources of relevant data to support
the benchmarking of GP practices in
identifying prescribing patterns which are
significantly different between peers and
which warrant further examination.
10. We acknowledge that high-level
prescribing cost comparisons with the
other UK regions have to be drawn with
great caution. In the Department’s view,
such comparisons are deeply flawed
given the differences in data definitions
and prescribing practices within the
jurisdictions. However, available national
statistics would suggest that if prescribing
expenditure here had been in line with
that in Wales in 2013, costs would
have been reduced by £73 million.
The Department does not accept that
these statistics are a measure of relative
efficiency and would not support the
view that costs could be reduced by
£73 million, as in its view, the statistics
do not compare jurisdictions on a like for
like basis.
11. More pertinent are the large variations
we found in prescribing costs between
local GP practices after standardising
their caseloads, meaning that there
is scope for GP practices to improve
efficiency, without affecting clinical
outcomes. As a result, we estimated
that, in 2013, potential savings of £19
million could have been realised if all
GP practices had achieved at least the
standard of the average practice. We
recognise that it will be challenging for
GPs to achieve all such potential savings
given that the savings need to be made
across a wide range of prescribed
drugs. The department has commented
that such estimates are crude and do not
take into consideration the other factors
associated with prescribing such as
access to other services; the impact of
cross-border workers; private healthcare.
The Department considers that there
will always be a degree of variability
between GP practices and therefore the
full quantum of such efficiencies will not
be realisable.
12. We also examined three groups of drugs
used to treat conditions for which there
are several suitable drugs available
at differing prices. We found large
variations in the extent to which local GP
practices prescribed lower cost drugs in
comparison to GP practices in the rest
of the UK. We also examined use of the
drug which has incurred the highest cost
in NI in the last number of years. We
calculated that the opportunity cost to
health and social care services here of

Primary Care Prescribing 5
not meeting UK levels was £17 million in
2012 and £15 million in 2013.
13. Potential economies may also be
achievable in other areas. For example,
research published in England estimated
that NHS primary and community care
prescription medicines waste cost £300
million. This indicates that an estimated
£18 million may be lost every year in
Northern Ireland in wasted prescriptions.
However, we have been advised
by the Department that while there is
potential waste, the interventions needed
to address this issue would offset the
potential savings. It is also important
to note that this is not in addition to the
monies referred to above. There may
also be potential for generating further
savings by reducing the number of
prescriptions for drugs of limited clinical
value or drugs which are not clinically
necessary. In this report we looked at
the potential for generating savings
by moving from off-patent branded
medicines to much cheaper generic
equivalents.

6 Primary Care Prescribing
Executive Summary

Part One:
Background and Scope of Report

8 Primary Care Prescribing
Part One:
Background and Scope of Report
In Northern Ireland, the Health and
Social Care Board contracts external
providers to supply pharmaceutical
services to the public
1.1 The Health and Social Care (HSC)
Board
5
is legislatively required to
make arrangements for the provision of
community pharmaceutical services in
Northern Ireland. These services include
dispensing those drugs prescribed
by General Practitioners (GPs)
6
. In
practice, it contracts out these services
to independent, retail pharmacy-outlet
owners (known as Community Pharmacy
Contractors (CPCs)).
1.2 CPCs can be registered pharmacists,
non-pharmacists, partnerships or bodies
corporate (providing a registered
pharmacist is employed in each
pharmacy outlet). In 2014, the HSC
Board had contracts with 225 CPCs
to provide community pharmaceutical
services from 535 pharmacies.
1.3 In 2014, 51 per cent of NI Pharmacies
were small independent businesses, 30
per cent operated in local partnerships
and the remainder, 19 per cent, formed
part of UK or multi-national groups.
In 2013 community pharmaceutical
services cost £460 million and
CPCs dispensed almost 39 million
prescription items
1.4 In Northern Ireland, in 2013, almost
39 million items prescribed by GPs,
were dispensed by CPCs. That year,
funding to CPCs for providing community
pharmaceutical services amounted
to £460 million. This represents
approximately 10 per cent of the total
spend on health and social care in
Northern Ireland.
1.5 Research published by York Health
Economics consortium in An Evaluation
of the Scale, Causes and Costs of Waste
Medicines reported that in England NHS
primary and community care prescription
medicines waste cost £300 million.
This indicates that a level of £18 million
may be lost every year in Northern
Ireland in wasted prescriptions
7
. This
estimate reflects patients’ failure to take
appropriate medicine which in turn
impacts on:
• the patient – who may not see an
improvement in their condition or
whose health may deteriorate;
5 Under Article 63 of the Health and Social Services (NI) Order 1972.
6 GPs are medically-qualified doctors with responsibility for attending to the everyday medical needs of a community. They
operate in the primary care sector. In Northern Ireland, the term ‘primary care’ refers to any of ‘the many forms of health
and social care and/or treatment accessed through a first point of contact provided outside hospitals’. Treatment provided
in a hospital setting is referred to as ‘secondary care’.
7 NI Direct website – Health and Well-being.

Primary Care Prescribing 9
• the HSC Budget – which could
re-direct resources within the HSC
sector; and
• the pharmaceutical industry –
which may struggle to prove the
effectiveness of new and innovative
drugs through post-marketing
surveillance.
1.6 Since 2010-11, the Department and the
Health and Social Care (HSC) Board
ran an annual ‘Don’t Use It, Don’t Order
it’ prescriptions medicines wastage
advertising campaign. In 2013-14, the
campaign included a new message
‘Wasting Medicines Wastes Money’
with the aim of influencing patients’
attitudes and behaviours to prevent
over-ordering of repeat prescription
medicines.
1.7 However, we have been advised
by the Department that while there is
potential waste, the interventions needed
to address this issue could offset the
potential savings. Since a proportion of
medicines waste is therefore inevitable,
complementary measures which improve
the quality and safety of prescribing are
required. We welcome the introduction
of such initiatives which have the
potential to reduce expenditure.
High level comparison of the number
and cost of prescriptions elsewhere
in the United Kingdom indicates that
there is potential for improving cost
effective prescribing in Northern
Ireland
1.8 The number of items prescribed has
increased in each region of the United
Kingdom (UK) over the seven year
period to 2013. Figure 1 shows that
Wales has consistently prescribed more
items per head of population that any
other UK region. Prescribing levels in NI,
although lower than those in Wales have
been higher than levels in England and
Scotland in each of the last seven years.
Levels in England and Scotland are very
similar.

10 Primary Care Prescribing
Part One:
Background and Scope of Report
Figure 1: Number of items prescribed per head of population in the UK over the period 2007-2013
Source: Business Services Organisation – Prescription Cost Analysis Reports
8
1.9 Figure 2 compares the cost of
prescribing per head of population in
England, Scotland, Wales and NI over
the seven year period to 2013. Overall,
England has consistently had the lowest
cost per head of population in each
year since 2007. There are, of course,
regional variations across England.
For example, the number of items
prescribed per head of population in the
North East of England is 50 per cent
greater than the number in the South of
England. Costs in Scotland and Wales
are broadly similar, higher than those
in England but less than those in NI.
NI has had the highest cost per head
of population since 2007 and is the
only region in which costs per head of
population are higher in 2013 than they
were in 2007.
12
15
18
21
24
27
2013201220112010200920082007
Number of items per person
England
Northern Ireland
Scotland
Wales
8 Mid year population figures for 2012 were used as the 2013 population statistics were not available at the time of
publication.

Primary Care Prescribing 11
Figure 2: Prescribing cost per head of population
Source: Business Services Organisation – Prescription Cost Analysis Reports
0
50
100
150
200
250
2013201220112010200920082007
Cost per head of population £
England Wales Northern IrelandScotland
2007 2010 2013
NI
£221.09 £243.94 £223.54
England
£162.95 £167.82 £160.12
Scotland
£187.92 £192.25 £183.73
Wales
£196.37 £193.05 £182.96

12 Primary Care Prescribing
Part One:
Background and Scope of Report
1.10 It is important to remember that this
form of high level analysis, while
demonstrating trends over time, does
not take account of definitional or
organisational differences across
regions. However, using these
comparative statistics as a very basic
measure of relative efficiency, the
variation in prescribing costs here
compared with other UK countries
provides some evidence that it is
possible for local GPs to prescribe less
expensively. For example, if prescribing
costs had been in line with those in
Wales in 2013, overall prescribing
costs could have been reduced by £73
million.
1.11 The Department does not accept that
these statistics are a measure of relative
efficiency across the UK and would not
support the NIAO view that costs could
be reduced by £73 million if prescribing
costs here were in line with Wales. In
its view, the statistics do not compare
jurisdictions on a like for like basis: for
example, the Department told us that
they do not take account of variations
in the ratio of community to hospital
prescribing that exist across jurisdictions.
In England in 2012, 63.5 per cent of
total medicines expenditure took place in
the primary care setting, the comparable
figure here was 72.7 per cent.
1.12 We acknowledge that prescribing
arrangements can differ between the
four countries: for instance, outpatients
who are prescribed drugs by consultants
here will have that prescription filled out
by their GP; in England, by contrast,
such a prescription will be dispensed by
the hospital and therefore will not be a
charge on the primary care budget.
1.13 As a result, we recognise that it
will be important to account for the
precise differences in the prescribing
patterns of GPs here when comparing
them with elsewhere in the UK. This
basic comparison, which is based on
published data, points up the need
for a comprehensive examination of
the cost implications of prescribing in
order to explore and implement specific
measures to promote more cost-effective
prescribing patterns among local GP
practices. Our study looks in more detail
at this in Part 4.
1.14 In addition to variations in prescribing
arrangements, the higher cost of
prescribed medicines in primary care in
Northern Ireland is due to, for example:
• progress in achieving savings
through generic, rather than
branded, prescribing has been
slower here than elsewhere in the UK
(see paragraph 4.5);

Primary Care Prescribing 13
• unlike the other UK regions, the
introduction of new drugs was not
as tightly controlled here, therefore
the prescribing of newer, and usually
more expensive drugs (including
generics) can be more widespread
in NI; and
• secondary care (hospital) prescribing
practice has more impact on GP
prescribing practices in NI than
elsewhere in the UK .
The Department has advised us that
it does not accept the final two bullet
points.
1.15 The Department told us that prior to
2004, the approach taken to reducing
medicines expenditure had been to
focus on the costs and seek to deliver a
range of cost cutting initiatives. However
an exclusively financial focus can have
far reaching consequences in respect
of quality, safety and well being of
patients. This has been borne out in
recent times in the Francis Report into the
Mid -Staffordshire Trust. A sole financial
focus in the management of medicines
has only limited success and does not
address the challenge of optimising
the outcomes for patients through the
use of prescribed medicines. Since
2004, medicines optimisation policy in
Northern Ireland has been predicated
on quality and safety improvement
delivering improved health outcomes and
realised efficiencies. Such an approach
addresses value for money requirements
in addition to important medicines
optimisation principles including:
• Rationality Attention to the
evidence base for the prescribing of
medicines;
• Safety Address avoidable
medication related errors and
adverse incidents;
• Individuality Optimise outcomes for
individual patients;
• Equity Ensuring equality of provision
across the population, therapeutic
conditions and new medicine;
• Consistency Prescribing practice that
conforms to acceptable standards;
• Continuity Optimised medicines
outcomes across sectors and
professional groups; and
• Innovation Removing barriers to
continuous quality improvement.

14 Primary Care Prescribing
Part One:
Background and Scope of Report
Purpose and Scope of our review
1.16 This report looks at the value for money
of primary care drugs prescribing and
dispensing:
• Part 2 considers the arrangements for
reimbursing CPCs;
• Part 3 looks at trends in GP
prescribing, the volume of
prescriptions and the cost pressures
on the prescribing budget; and
• Part 4 examines the potential for
further cost savings.
1.17 The report does not examine secondary
care (hospital) prescribing or quantify
its impact on primary care prescribing.
It is important to note, however, that
secondary care prescribing decisions
often impact on primary care prescribing
decisions and costs (see paragraph
3.2). Further, this report does not
consider in detail the potential for
generating savings by reducing drug
wastage.

Part Two:
Community Pharmacy Contractors’ Reimbursement

16 Primary Care Prescribing
Part Two:
Community Pharmacy Contractors’ Reimbursement
Over time, the number of pharmacy
outlets in Northern Ireland has risen
while the number of CPCs has fallen
2.1 In 2012, the HSC Board had contracts
with 243 CPCs to provide community
pharmaceutical services (including
dispensing health service-prescribed
medicines) from 547 pharmacies.
Twelve years ago, 320 CPCs were
contracted to provide services in 509
pharmacies in Northern Ireland (see
Figure 3). Therefore, over time, while the
number of pharmacy outlets increased,
the number of CPCs decreased by
almost 25 per cent. The Department told
us that in 2014, the HSC Board had
contracts with 225 CPCs to provide
community pharmaceutical services from
535 pharmacies.
Number of Pharmacies
Number of Contracted Providers
Pharmacies Contracted Providers
500
510
520
530
540
550
201220112010200920082007200620052004200320022001
200
220
240
260
280
300
320
340
Figure 3: The number of providers contracted to provide pharmaceutical services and the total number of
pharmacies over the period 2001 to 2012
Source: The Department of Health, Social Services and Public Safety

Primary Care Prescribing 17
Northern Ireland CPCs
dispense more prescriptions
per head of population
than those in England and
Scotland.
2.2 Northern Ireland has a lower average
population per service provider than
England and Wales. The average
number of prescriptions dispensed by
service providers in Northern Ireland
is higher than those in England and
Scotland but lower than Wales. Figure
4 provides comparative figures.
Figure 4: UK Comparative Pharmacy Information -2013
Northern
Ireland
England Scotland Wales
Population Estimate (millions)
1.8 53.9 5.3 3.1
Total Service Providers
547 17,823 1,580 1,067
Total Prescriptions (millions)
38.7 1,003.8 97.7 76.2
Number of Service Providers/1000 population
0.30 0.33 0.30 0.34
Average population per service provider
3,291 3,024 3,354 2,905
Average prescriptions per service provider
70,750 56,320 61,835 71,415
Prescriptions per head of population
21.50 18.62 18.43 24.58
Source: Business Services Organisation
Notes: Data is for calendar year 2013 with exception of England which is only available as financiaL year 2012-13
Total Prescription Items includes items dispensed by community pharmacies, appliance contractors and dispensing doctors
Service provider refers to Pharmacies, Appliance Contractors and Dispensing GPs (i.e. individual GPs not
Dispensing Practice)

18 Primary Care Prescribing
Part Two:
Community Pharmacy Contractors’ Reimbursement
2.3 In looking at the numbers of pharmacies
for each population it is worth
considering the issue of access to
services for service users. Pharmacies
in NI offer some, or all, of the following
examples of services:
• minor ailments scheme;
• smoking cessation scheme;
• medicines management services;
• medicines use reviews;
• repeat dispensing services;
• oxygen supply;
• emergency hormonal contraception;
• Helicobacter Pylori testing;
• supply of palliative medicine (out of
hours);
• measuring and fitting of hosiery
garments;
• supply of substitution medicines to
addicted persons;
• needle exchange schemes; and
• receipt and disposal of unwanted
medicines.
2.4 Pharmacists are often the first port of
call for sick persons seeking advice or
treatment of minor ailments and are able
to refer patients with more serious injuries
to the appropriate treatment channels.
Some pharmacies also offer services
such as blood sugar testing, cholesterol
testing, blood pressure measurement,
body mass index measurements
and weight management schemes
which do not form part of contractual
arrangements.
2.5 Contracts are regulated by the Control
of Entry Regulations which set out the
criteria which must be met before the
HSC Board can commission a CPC to
provide pharmaceutical services. There
are currently no established legislative
mechanisms or processes in place to
either remove commissioned CPCs who
continue to meet the relevant criteria from
the pharmaceutical list or to reduce the
overall number of contracts. However,
the Department and the HSC Board
are currently undertaking a Needs
Assessment to identify areas of under
or over provision of pharmaceutical
services in Northern Ireland.
In 2012-13 CPCs received £460
million for providing community
pharmaceutical services
2.6 CPCs attract a range of funding for
the services they provide on behalf
of the HSC Board. In 2012-13, just
under £460 million was paid to CPCs.
Figure 5 provides a breakdown of the
various elements of the 2012-13 funding
envelope.

Primary Care Prescribing 19
Reimbursement costs are the most
significant element of the funding
package
2.7 The most significant element of CPC
funding relates to reimbursement for
purchasing and dispensing drugs.
During 2012-13, reimbursement fees to
pharmacists amounted to £381 million
(see Figure 5).
The majority of reimbursement costs
each year relate to ‘branded’ drugs
2.8 About 70 per cent of the reimbursement
cost in 2012-13 related to the supply of
‘branded’ drugs – drugs still protected
by patent and known by the trade
name given by the manufacturer. While
branded drugs account for nearly 70
per cent of reimbursement costs, they
only account for about 30 per cent
of the total volume of items dispensed
each year.
2.9 Reimbursement levels for branded
drugs are determined by the published
list price
9
which balances the need to
ensure that safe and effective medicines
are provided on terms acceptable to
the health service against the need to
support a profitable pharmaceutical
industry in the UK.
2.10 The Pharmaceutical Price Regulation
Scheme (PPRS) is a voluntary agreement
between government
10
and the UK
pharmaceutical industry covering the
supply of most branded medicines. The
latest PPRS runs for five years from 1
January 2014. Under the terms of the
current PPRS, the pharmaceutical industry
has guaranteed that it will underwrite
any additional cost of supplying branded
medicines in the next two years. The
industry has also agreed to absorb an
element of any additional costs incurred
in the final three years of the PPRS.
2.11 The latest PPRS offers predictability (for
government and the pharmaceutical
industry) in the cost of branded
medicines for the next five years. As
a result of the increased certainty over
cost, the NHS hopes to move more
rapidly in adopting innovative medicines
and treatments where these will improve
patient outcomes. As PPRS is a UK wide
scheme further work is underway to
determine how its financial receipt for NI
is calculated.
NI reimbursement rates for dispensing
certain ‘generic’ drugs were based on
the Scottish Drug Tariff but this led to
legal challenge
2.12 The majority of items dispensed by
CPCs are generic drugs – that is,
drugs comparable to branded drugs in
dosage, strength, route of administration,
intended use, quality and performance
characteristics but created after expiry
of a patent. The Department has a
statutory obligation to compile and
9 The Pharmaceutical Price Regulation Scheme (PPRS) determines the prices drug manufacturers can charge for branded
drugs. Agreed prices follow negotiations between Association of the British Pharmaceutical Industry and the Department
of Health (acting on behalf of England, Scotland, Wales and Northern Ireland). In November 2013, a new PPRS was
announced which took effect from January 2014 and will last for five years.
10 Although the agreement is made by the Department of Health, the arrangements apply to England, Scotland, Wales
and Northern Ireland. The Association of the British Pharmaceutical Industry (ABPI) negotiates on behalf of the entire UK
pharmaceutical industry.

20 Primary Care Prescribing
Part Two:
Community Pharmacy Contractors’ Reimbursement
Figure 5: Breakdown of the funding provided to CPCs in 2012-13
Element Definition Amount Paid in
2012-13
Reimbursement
costs
Contractors receive reimbursement for purchasing and
dispensing drugs on behalf of the HSC Board. The
actual price reimbursed to contractors for individual items
dispensed is set out in the Northern Ireland Drug Tariff.
The payments made are net of discounts to list prices, in
line with the process set out in the Drug Tariff.
(£409 million - £28.1 million discount)
Contractors achieve a level of ‘retained profit’ through
their purchase of medicines. Retained profit is the
difference between the price a contractor pays for a
drug and the price at which the contractor is reimbursed
(as set out in the Drug Tariff). The 2011-12 Margin
Survey demonstrated that contractors were generating an
estimated profit of £28 million through their procurement
activities. The estimated rate of the margin for branded
and generic medicines is similar to those identified in the
rest of the UK.
Propriety mitigation payments (amounting to £3.6 million
in 2012-13) were paid to contractors prior to completion
of the Margins Survey. Depending on the results of
the Margins Survey for 2012-13, propriety mitigation
payments may be subject to clawback.
The Department has commenced a Cost of Service
Investigation. The outcome of this investigation will be used
to inform future negotiations with community pharmacy
contractors and will inform the allowed level of retained
profit.
£380.9 million

Primary Care Prescribing 21
Global Sum Consists of two components:
(i) Annual Professional Practice Allowance
(APP Allowance)
Each year, a payment of £18,000 is paid for each
pharmacy in recognition that contractors contribute to the
provision of public health services.
(ii) Dispensing Fee
Contractors receive a fixed fee for dispensing an
approved drug or appliance to a public health service
patient. In 2012-13, the basic dispensing fees were:
Ordinary Fees: £1.03
Multiple Dispensing Fee: £0.49
Since 2009-10, a cap has been introduced on the total
Global Sum payable. In 2012-13, the number of ordinary
items dispensed was higher than anticipated. An amount
of £0.5 million was adjusted in 2013-14 to realign the
payments to the Global Sum, in line with the standard
operating process.
£51.4 million
£9.6 million.
£41.8 million
Additional
Non-Recurrent
Funding
The HSC Board also paid £7 million to contractors in
2012-13. This figure relates to a negotiated settlement
with CPCs following the outcome of a judicial review of
the Northern Ireland funding arrangements.
£7 million
Ancillary
Services and
Other Fees
Pharmacists can attract additional payments where they
provide supplementary services to patients. These services
may include availability of out of hours, the provision of
pharmacy advice to nursing and residential homes, or the
provision of training to non-qualified pharmacists. Remu-
neration rates for supplementary services are set out in the
Drug Tariff.
£19.8 million
TOTAL FUNDING
2012-13
£459.1 million
Source: HSC Board

22 Primary Care Prescribing
Part Two:
Community Pharmacy Contractors’ Reimbursement
publish a statement known as the
Northern Ireland Drug Tariff. The Tariff
sets out pricing models for generic drug
categories (Appendix 1). In July 1994,
the Department and the Pharmaceutical
Contractors Committee (PCC)
11
agreed
that it was appropriate to adopt the
Scottish Drug Tariff model in Northern
Ireland. Prices listed in the Scottish Drug
Tariff reflect prices set by the Department
of Health (England) since the UK
operates as one medicines market.
2.13 In 1999, following turbulence in the
pharmaceutical market, the Department
of Health (England) sought to rationalise
the prices of medicines to the NHS.
Research
12
published by the Department
of Health in England in 2003 estimated
that CPCs were typically able to make
30 per cent or more retained profit on
generic drugs. Research undertaken to
establish profit margins on ‘branded’
drugs in NI revealed similar trends to
other parts of the UK.
2.14 The research was not extended in
Northern Ireland to cover generic
drugs because local CPCs refused to
provide the required information. Later
research
13/14
has supported the view
that Northern Ireland CPCs, as part of
the UK-wide medicines market, enjoy
similar levels of profit to those generated
elsewhere in the UK. The on-going
Margins Survey estimates that CPCs
typically generated profit levels of 40
per cent in 2011-12.
2.15 On foot of the UK research, the
Department of Health (England)
launched a revised community pharmacy
contract in England and Wales in April
2005. In Scotland the contract was
phased in during 2006. An integral
part of that contract was the introduction
of a significant new category within
the UK Drug Tariff - Category M.
The Drug Tariff provides a funding
mechanism for pharmacists as well as
stimulating competition in the supply
chain. Financially, the Drug Tariff is set
to deliver a target level of retained profit
for CPCs and in Northern Ireland this is
set at £16.5m. Funding released from
the new Category M arrangements
are available to fund additional patient
focussed pharmaceutical services in the
community setting.
2.16 The revised contract was not introduced
in NI because pharmaceutical
representatives here contended that,
because the supporting information-
gathering exercise had not been
extended to NI, it could not be assured
that the new Category M would fairly
remunerate NI CPCs.
2.17 Despite the absence of agreement with
the local representatives, the Department
continued to apply the Scottish Drug
Tariff in Northern Ireland
15
. On
the basis that Northern Ireland was
recognised as part of a UK wide Drugs
Market and had been since 1998. In
effect, Category M was introduced in
11 The Pharmaceutical Contractors Committee (PCC) is the local representative body for community pharmacists providing
services under the National Health Service in Northern Ireland.
12 A pharmacy Cost of Service Inquiry (CoSI) report 2003.
13 NI - True Costs of NHS Pharmacy, The Tribal Report, 13 January 2011.
14 The on-going Margins Survey commenced in April 2011.
15 The drugs market operates on a UK-basis. All generic prices are set by the Department of Health (England) and included in
an English Drug Tariff. That Tariff covers England and Wales and is applied in NI. Scotland applies the English Drug Tariff
(after amendment to reflect variations in discount rates).

Primary Care Prescribing 23
Northern Ireland and CPCs in Northern
Ireland (as in other regions) saw their
reimbursement levels reduced.
2.18 Category M covers over 500 of the
most common generic medicines
dispensed. In NI, category M
covers about 55 per cent of all items
reimbursed and about 86 per cent of all
generic items reimbursed.
2.19 Given the concerns of CPCs, the
Department proposed that a proportion
of savings generated through Category
M would be paid where other services
were delivered (as in England, Scotland
and Wales). A subsequent disagreement
over whether payments should have
been made when these other services
were not provided, culminated in legal
challenge by CPCs. (Details of legal
proceedings against the Department are
set out in Appendix 2).
2.20 In 2010, a Judicial Review found in
favour of the CPCs and concluded
that the Department’s continued use of
the Scottish Drug Tariff did not meet
the statutory obligation to provide
fair and reasonable remuneration to
CPCs. The Department and HSC Board
subsequently took steps to put in place a
lawful Drug Tariff. A subsequent Judicial
Review in 2011 also found in favour
of CPCs but crucially, the revised Drug
Tariff was not deemed to be unlawful. In
December 2012, the Department and
HSC Board withdrew an appeal of the
Judicial Review decisions and a further
interim agreement was reached with
Community Pharmacy Northern Ireland
(CPNI).
The legal action has cost the
Department £550,000. CPCs received
compensation of some £6 million.
A further £40 million was made
available to CPCs over the seven
year period to 2011
2.21 The Judicial Review process has cost
the Department almost £550,000.
In addition, and outside the Judicial
Review process, the Department paid
£6 million to CPCs in 2006-07.
Following the outcome of the first Judicial
Review, the Department negotiated
an Interim Agreement with CPNI. As
part of that agreement, the Department
acknowledged the revised arrangements
resulted in lower reimbursement rates
and provided £40 million to CPCs
over the seven year period to 2010-11
inclusive of previous payments that had
already been made on account.
2.22 The Department has begun a NI Cost
of Service Investigation (CoSI)
16
and
anticipates that the data collection phase
will be completed by April 2015. The
outcome of the 2011-12 margins survey
became available in May 2014. A
2012-13 margins survey is currently
being undertaken. The Department
expects that the results of that will be
available by the end of 2014. The
outcomes of these investigations and
surveys will form the basis of further
negotiations with CPNI. The decision to
exclude multiples companies (as in the
rest of the UK), however, will limit the
extent of increased transparency.
16 The objective of the Cost of Service Investigation (CoSI) is to quantify the level of profit generated by CPCs.

24 Primary Care Prescribing
Part Two:
Community Pharmacy Contractors’ Reimbursement
2.23 While we accept that the Department
faced considerable opposition to
the implementation of Category M
in the Northern Ireland Drug Tariff,
in our view, many of the stumbling
blocks should have been foreseen
by the Department and overcome.
In particular, the Department should
have ensured that it was fully informed
about the likely economic impact
of introducing the revised tariff and
should have completed a Regulatory
Impact Assessment (RIA). Following the
outcome of the first Judicial Review,
it would have been prudent for the
Department to have completed an RIA
and investigation prior to enforcing
further change. The Department told us
that it completed, and consulted on an
economic analysis which supported
its view that no RIA was required.
We note however, that this was not
accepted as sufficient by the Court.
2.24 In addition to damaging relationships
with CPCs, the Judicial Review
process had a financial impact. While
no financial remedy was imposed by
the Courts, the Department told us that
the total cost incurred through both
Reviews amounted to £550,000.
2.25 We acknowledge that the Cost of
Services Inquiry and Margins Survey
will produce useful information on
the level of profit generated by
contractors. In our view however, the
decision to exclude multiples (as in
the rest of the UK) from the margins
survey, will limit the extent of increased
transparency. We recommend that the
Department reconsiders this decision.

Part Three:
Trends in General Practitioner (GP) Prescribing Practice

26 Primary Care Prescribing
Part Three:
Trends in General Practitioner (GP) Prescribing Practice
3.1 GPs use independent clinical judgement
to decide which drugs to prescribe. A
complex relationship of activities including
procurement, selection, prescribing,
dispensing, administration, monitoring
and review of medicines impact on both
clinical outcomes and cost. Research
17
has shown that GP prescribing behaviour
is influenced by many factors, which
operate at different levels in the health
and social care system. At the national
or international levels, clear evidence
on treatments and drugs presented in
authoritative journals is a significant
influence. The Department has noted
that it is therefore to be expected that an
equally complex array of activities are
required to ensure that optimal therapeutic
gains can be achieved from investment in
medicines while at the same time ensuring
value for money.
3.2 At the HSC level, influences include
local guidelines, newsletters, site visits
by HSC Board Medicines Management
Advisers, personalised contacts, and
recommendations from specialist or
consultants in the secondary health
care setting. At the practice level, the
professional experience of the GP, the
clinical needs of the patient, patient
demand, peer networks, and drug
company representatives may influence
prescribing. Decisions can, to an
extent, be influenced by the HSC Board
efficiency initiatives (see paragraph 4.2)
and by several other factors. A number of
examples are listed below.
• Legislation: The Health and Personal
Social Services (General Medical
Services Contracts) Regulations
(Northern Ireland) 2004 applies to
prescribing by GPs and requires that
a prescriber shall order any drugs,
medicines or appliances which are
needed for the treatment of any
patient.
• Guidance: A GP’s clinical decision
as to whether a drug is required
is complex. The General Medical
Council
18
(GMC) requires GPs “in
providing clinical care [to] provide
effective treatments based on best
available evidence”. It is policy in
NI to follow guidance provided
by The National Institute of Health
and Clinical Excellence (NICE)
guidance which is evidence based
and considered to be best practice.
GMC also advises GPs “To minimise
waste, improve services and promote
the effective use of resources, you
should take financial responsibility for
the delivery of your service at a level
appropriate to your role”.
• General Medical Services
contract
19
: The Quality and
Outcomes Framework (QOF) is part
of the General Medical Services
(GMS) contract for general practices
and was introduced on 1 April
2004. The QOF rewards practices
for the provision of ‘quality care’ and
helps to fund further improvements in
the delivery of clinical care. Practice
participation in QOF is voluntary
17 RAND Europe, Prescribing in primary care, Understanding what shapes GPs’ prescribing choices and how might these be
changed, 2006
18 General Medical Council Guidance: http://www.gmc-uk.org/index.asp
19 GMS Contract details are available at: http://www.nhsemployers.org/your-workforce/primary-care-contacts/general-
medical-services

but most practices take part. Given
that QOF provides incentives for
better disease management, it may
therefore have an influence on GPs’
prescribing behaviour.
• Access to information: GPs’
assessment of the clinical and cost
effectiveness of the drugs they
prescribe will be influenced by a
range of factors. The Department has
advised us that the Northern Ireland
formulary
20
is in place and is an
unbiased review of the medicines
and recommendation for first and
second line choices.
• Interaction with representatives
from the pharmaceutical industry:
In 2005, it was estimated that
the UK pharmaceutical industry
spends £1.65 billion a year on
drug promotion and marketing
21
.
It is likely, therefore, that marketing
activities can have an influence on
prescribing decisions.
• Secondary Care Prescribing:
Another influence on GPs’
prescribing is the secondary care
sector. In some cases, hospital
consultants specify a particular drug
for a patient leaving hospital and/
or an outpatient. While ultimately the
decision to prescribe rests with the
GP, it is likely that his decision will
be influenced by the clinical opinion
of the secondary care consultant.
The volume of prescribed drugs
has increased at a steady rate over
recent years but costs have fallen
substantially since 2010
3.3 In 2000, over 23 million items were
prescribed by GPs at a cost of just over
£245 million. Figure 6 shows that by
2010, the number of items prescribed
had increased to almost 36 million at
a cost of £440 million. Along with the
influences set out in paragraph 3.1, the
Department considers that the increase
also reflects the impact of a steadily
growing older population and the fact
that they consume more medicines.
3.4 The Pharmaceutical Clinical Effectiveness
(PCE) Programme
22
is a suite of
medicines management initiatives,
initiated by the Department in 2005 and
now implemented by the HSC Board.
Primary Care Prescribing 27
20 The NI formulary is available at: http://niformulary.hscni.net/Pages/default.aspx
21 House of Commons Health Committee, The Influence of the Pharmaceutical Industry 5 April 2005.
22 Pharmaceutical clinical effectiveness (PCE) is the outcome of the application of pharmaceutical skills directed to providing a
systematic approach to rational product selection and use, consistently applied across secondary and primary care, taking
account of clinical need, evidential product clinical performance, product presentation, safety characteristics and economic
factors. The process can be applied to medicines, wound care and medical and surgical disposable products. It employs
a multidisciplinary collaborative approach to reach consensus on the most appropriate clinical products and achieve the
ownership and behavioural change necessary to make the decisions operational. Effectively, in medicines terms, it is the
right medicine for the right patient at the right time and for the right cost. The PCE programme has been in operation since
2005 and represents the synergistic combination of a number of initiatives designed to optimise the implementation of the
product selection process through effective procurement, prescribing policy and guidelines and pharmaceutical service
improvements.

28 Primary Care Prescribing
Part Three:
Trends in General Practitioner (GP) Prescribing Practice
3.5 In the three year period, following the
introduction of PCE the rate of growth
in expenditure on drugs was reduced
to less than 5 per cent per annum (see
Figure 6) which, according to the
Department, resulted in £75 million in
savings having been made as part of
the targeted Comprehensive Spending
Review 2002-08 efficencies. The
Department also told us that between
2006-13, the cost of prescribing was
reduced in real terms by 18 per cent.
3.6 On 1 July 2010 responsibility for
managing the General Pharmaceutical
Services budget
23
was devolved from
the Department to the HSC Board. Since
2010, while the volume of prescriptions
continued to increase (by almost 5 per
cent to 2012), the cost of prescribing
these drugs has decreased by just over
7 per cent in the same period.
Spend (£ Million)
number of items (millons)
Spend Number of prescriptions
150
200
250
300
350
400
450
500
550
2012201120102009200820072006200520042003200220012000
15
20
25
30
35
40
Responsibility for the
General Pharmaceutical
Budget transferred to HSC
Board on 1 July 2010
Implementation of PCE
Figure 6: Percentage increases in the number and cost of items prescribed
Source: Business Services Organisation – Prescription Cost Analysis Reports
23
23 Responsibility for the entire Family Health Services Budget was devolved to the HSC Board on 1 July 2010. Family Health
Services expenditure includes General Medical Services, General Dental Services, General Pharmaceutical Services and
General Opthalmic Services.

Primary Care Prescribing 29
There have been a range of influences
which have helped to contain the cost
of primary care prescribing
3.7 GP prescribing decisions are tightly
regulated and monitored. Each year,
GP practices are subject to prescribing
reviews and repeat prescription audits.
The purpose of these reviews and audits
is to demonstrate that GPs have:
• implemented the National Institute for
Health and Care Excellence (NICE)
guidelines on prescribing and cost-
effectiveness;
• selected only medicines listed in the
NI Formulary; and
• implemented the Pharmaceutical
Clinical Effectiveness Programme
which sets key therapeutic objectives
that GP practices are encouraged
to implement which will deliver
improved quality, safety, effectiveness
and efficiency
3.8 Safe and cost-effective primary care
prescribing requires that:
• GPs have access to up-to-date
information about medicines;
• GP, hospital staff and pharmacy staff
co-ordinate prescribing activity;
• all new prescribers and prescribing
support staff receive sufficient, robust
training;
• generic medicines are used where
clinically appropriate; and
• medicine management advisers work
in tandem with practices.
3.9 GP Prescribing Incentive Schemes
played a part in influencing effective
prescribing. The schemes, which were
largely budgetary focused, were based
upon the principle that savings made
on the prescribing budget should be
shared between GP Practices and their
Local Commissioning Groups (LCGs).
The savings were retained by GP
Practices for reinvestment in services
designed to improve or enhance patient
care, without adding any additional
layer of bureaucracy. The savings
earmarked were also designed to assist
in reinvestment with health and social
care aimed at delivering improvements
to patient care. It is essential, especially
given the current financial constraints
within which the public sector finds
itself, that every opportunity to deliver
efficiencies is pursued.

30 Primary Care Prescribing
Part Three:
Trends in General Practitioner (GP) Prescribing Practice
HSC Board Medicines Management
Advisors have been instrumental in
ensuring prescribing efficiencies are
generated
3.10 Containing the cost of prescribing
by GPs is primarily managed by the
HSC Board’s Medicines Management
Advisers (MMAs) who seek to influence
the prescribing behaviour of GPs. As
qualified pharmacists, MMAs perform
two main functions:
• each MMA monitors the prescribing
patterns of an allocated number of
GP practices (approximately 25 for
a full-time MMA) with a focus on
safety, effectiveness and efficiency.
By identifying high value expenditure
and variations in prescribing
patterns, MMAs are well placed
to highlight areas where financial
savings could be generated without
impacting on the quality and safety
of care; and
• each MMA is responsible for
reviewing prescribing patterns
within given therapeutic areas
(such as obesity or asthma). The
MMA is set a specific effectiveness
target for this area and influences
prescribing practice by providing
comprehensive, up to date advice to
GPs on the most effective treatments.
3.11 In part, the success of MMAs is reflected
in achievement against annual GP
prescribing efficiency-saving targets
which have been in place since
2010-11
24
(see Paragraph 4.2). By
encouraging GPs to prescribe more cost-
effectively by, for example, increasing
the level of generic prescribing and
identifying areas where cheaper
alternatives (proven to have the same
outcomes) can be used, MMAs have
played an important role in helping
to slow the year-on-year increase in
the number of items dispensed and to
reduce costs.
3.12 The ratio of MMAs per head of
population has been used in Scotland
to demonstrate that prescribing
performance can be enhanced by
increasing MMA capacity. Compared to
Scotland
25
, the ratio is lower here with 1
whole time equivalent (WTE) MMA per
130,000 of the population compared
to between 3.5 and 6 WTE prescribing
support staff (similar to the role of MMAs
in NI) per 100,000 of the population in
Scotland.
24 Until July 2010, the Department had responsibility for the General Pharmaceutical Service budget. It set the efficiency target
of £40 million for that year. Responsibility was then devolved to the HSC Board.
25 Audit Scotland Report: Prescribing in General Practice in Scotland 2013.
3.13 While the relative impact of various
prescribing support activities is difficult
to assess, in our view, MMAs play
a key role in controlling prescribing
costs by coordinating these activities.
We recommend that the HSC Board
should use available benchmarking
data to inform their consideration of
whether MMA staffing levels in NI
are appropriate. The Department has
informed us that it recognises the role
of MMAs and will consider available
evidence from NI and elsewhere to
inform consideration of appropriate
and affordable staffing levels.

Primary Care Prescribing 31
British National Formulary (BNF)
3.14 The British National Formulary (BNF) is
a publication which contains information
and advice on prescribing, dispensing
and administering medicines. It is used
by GPs and pharmacists to confirm
drug dosages, indications, interactions
and side effects. Medicines are classed
in accordance with their therapeutic
actions and are categorised against
one of 15 BNF chapters. Some drugs,
such as aspirin, appear in a number of
BNF chapters since they can be used to
treat several conditions. Basic net prices
are given in the BNF to provide an
indication of the relative cost of different
drugs.
3.15 The NI administrative prescribing
database, hosted by The HSC Sector
Business Services Organisation (BSO),
classifies medicines in accordance
with the BNF format in order to report
prescribing/dispensing activity by
therapeutic areas. BSO include
one additional section allocating
unclassified
26
medicines. Typically
over 60 per cent of the total cost
of prescribing falls to one of four
therapeutic areas (see Figure 7).
26 Unclassified are dispensed items for which there is no corresponding code in the NI Code book issued by BSO.
Figure 7: 2013 Expenditure in top four BNF Chapters
BNF Chapter Conditions
Commonly Treated
2013
Expenditure
Percentage of
overall prescribing
expenditure in
2013
BNF 4 –
Central Nervous System
Depression, dementia,
alzheimers disease, multiple
sclerosis, pain
£113 million 28 per cent
BNF 2 –
Cardiovascular System
Angina, heart attacks £48 million 12 per cent
BNF 3 –
Respiratory System
Asthma, emphyzema, chronic
obstructive pulmonary disorder,
acute respiratory distress,
sinusitis, tonsillitis, laryngitis
£48 million 12 per cent
BNF 6 –
Endocrine System
Diabetes, thyroid problems,
osteoporosis
£45 million 11 per cent
Source: Business Service Organisation

32 Primary Care Prescribing
Part Three:
Trends in General Practitioner (GP) Prescribing Practice
3.16 Around 20 per cent falls to a further five
therapeutic areas, with four per cent of
all prescribing expenditure allocated to
‘unclassified’ (see Figure 8).
0
20
40
60
80
100
120
Total for remaining
Unclassified
Skin
Obstetrics,
Gynaecology and
Urinary-Tract disorders
Gastro-Intestinal
system
Nutrition and Blood
Endocrine system
Respiratory system
Cardiovascular
system
Central Nervous
system
BNF Chapters
Spend (£ Million)
Figure 8: Analysis of 2013 Expenditure by BNF Chapter
Source: HSC Board

Primary Care Prescribing 33
The use of an ‘unclassified’ category
prevents comprehensive analysis of
prescribing patterns
3.17 Where a GP prescribes an unusual
item or a liquid form of a routinely
dispensed tablet, the items is allocated
to the ‘unclassified’ category. In 2013,
250,000 prescription items costing £15
million were charged to the unclassified
code. Figure 9 shows that the level of
unclassified expenditure has more than
doubled in the 10 year period to 2013.
Figure 9: Spend allocated to the unclassified category in NI over the period 2004 to 2013
0
2
4
6
8
10
12
14
16
2013201220112010200920082007200620052004
Spend (£ Million)
Source: HSC Board

34 Primary Care Prescribing
Part Three:
Trends in General Practitioner (GP) Prescribing Practice
3.18 It is, however, the view of the HSC
Board that the inclusion of an unclassified
category allows greater transparency
and allows the quantification and
interrogation of the use of these products.
In Scotland, unclassified items (referred
to as dummies in Scotland) represented
less than two per cent of the prescribing
costs. England and Wales do not use
an unclassified category. All prescribed
items are allocated to a BNF chapter/
therapeutic area.
3.19 We examined the top 100 most
expensive items prescribed and
allocated to ‘unclassified’ in December
2013. In our sample we identified that:
• Just over half of all items selected
(costing £46,000) were liquid forms
of routinely dispensed medicines;
• Pharmacists had been reimbursed
between £622 and £1,230 for
dispensing individual liquid (rather
than tablet) doses of omeprazole.
Tablet form omeprazole costs
approximately £2.27;
• In one case, a pharmacist was
reimbursed £220 for dispensing a
‘special
27
’ suspension. We noted that
this product was available on the
market at a cost of £23.43; and
• An application for reimbursement
relating to a ‘special’ item costing
just over £400 was turned down
by the HSC Board. The HSC Board
advised the pharmacist to dispense
the treatment in tablet form at a cost
of £1.48.
27 Where a prescribed item or solution cannot easily be prepared by the pharmacist, it is categorised as a ‘special’ product.
Specials tend to be unusual items, such as appliances designed specifically for the patient, solutions which combine various
drugs or treatments which require an active ingredient at a level which is not available commercially. The pharmacist is
reimbursed the full amount he is charged by the drug company.
3.20 The use of an unclassified cost in
NI masks the overall cost of treating
various conditions. We recommend
that the HSC Board replicates the
arrangements in England and Wales
(where no unclassified code exists)
by removing the unclassified code in
an effort to improve transparency and
monitoring. We note that BSO has
introduced a new Family Practitioner
Service payment system which will
provide enhanced management
information and permit more detailed
classification of uncoded items.
3.21 Although we note that the HSC
Board reviews applications for
‘special’ product reimbursement, in
our view, additional savings could be
generated by strengthening controls.
We recommend that the HSC
Board continues to work closely with
healthcare professionals to ensure
that all possible alternatives are
considered before a ‘special’ item is
dispensed.

Primary Care Prescribing 35
Variations in regional prescribing
rates which cannot be fully explained
by differences in population
demographics suggest that it may
be possible to improve the quality of
prescribing further.
3.22 Effective prescribing should ensure that
the clinical needs of a population are
met by prescribing a volume of drugs
which is consistent with the prevalence of
a disease. Paragraph 1.8 shows that the
overall volume of items prescribed has
been increasing across all UK countries
over recent years. While research
28
has
consistently shown health need here is
much greater than elsewhere in the UK,
data from other sources suggests that the
relationship between health need and
prescribing is not as straightforward as
may be expected.
3.23 Data on the prevalence of specific
diseases or health conditions are an
important element of the Quality and
Outcomes Framework (QOF) and
according to the HSC Board
29
:
“(disease) registers are particularly
valuable in recording both the number
of patients known to have the condition
and in calculating the prevalence locally
and regionally. This can be extremely
useful for assessing clinical need and
planning service development.....QOF
data can indicate variation in practice
and potential unmet need within the
population”.
3.24 The Department has told us that it has
been advised by the NI Statistics and
Research Agency and the Health and
Social Care Information Centre in
England that QOF data is unsuitable
as a measure of need in this context.
The QOF is primarily designed to
address primary care management not
prevalence or need. QOF data is not
statistically robust for this purpose. The
limitations inherent in utilising QOF in
this analysis include that no account is
taken of the population structure across
the four countries.Severity of disease
or co-morbidities is not considered,
all of which are contributory factors in
level and cost of prescribing. Although
QOF may be considered consistent in
definitions across the four countries; the
social and demographic characteristics
of the population differ widely as will the
recording and clinical behaviour of the
GPs.
3.25 We recognise that accepted research
shows there is additional health need
in Northern Ireland which may range
from 9 to 26 per cent. However, while
we acknowledge the Department’s
view that QOF should be interpreted
with caution
30
, recent data shows that
the prevalence of many of the main
diseases does not appear to be in line
with the general understanding of higher
health need here. Figure 10 shows the
prevalence of specific diseases
28 NAO, Healthcare Across the UK: A comparison of the NHS in England, Scotland, Wales and Northern Ireland.
29 Performance Review Report 2012-13,Pages 7 and 9, General Medical Services, HSC Board, 2013.
30 The Department considers that caution should be taken when interpreting QOF prevalence since the rates are simply the total
number of patients on the register, expressed as a proportion or percentage of the total number of patients registered with
the practice. They are not adjusted to account for patient age distribution or other factors that may differ between general
practices. Furthermore, although registers may be restricted (e.g. to only include persons over a specified age) the QOF
prevalence rate is based on the total number of persons registered with the practice (the practice list size) at one point in
time.
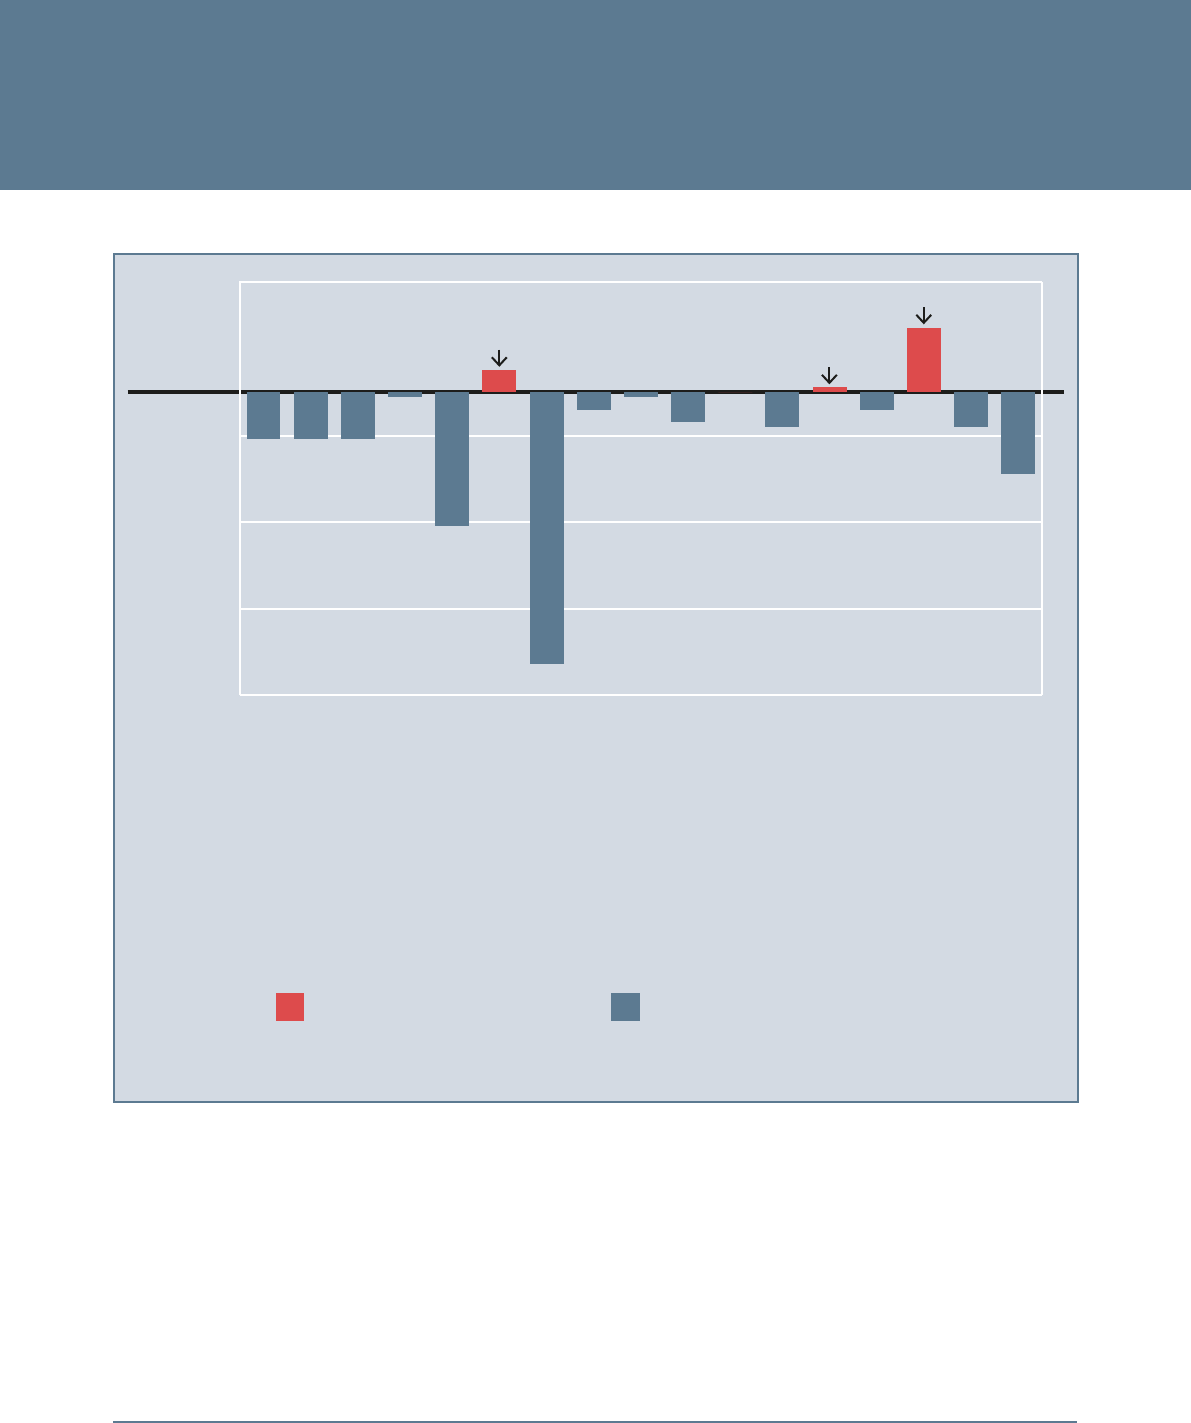
36 Primary Care Prescribing
Part Three:
Trends in General Practitioner (GP) Prescribing Practice
Average Level
in Great Britain
-1.75%
-1.25%
-0.75%
-0.25%
0.25%
Obesity
Atrial Fibrillation
Depression
Chronic Kidney Disease
Dementia
Heart Failure due to LVD (Note 2)
Heart Failure
Stroke
Mental Health
Hypothyroidism
Hypertension
Epilepsy
Diabetes
Heart Disease
COPD (Note 1)
Cancer
Asthma
Indicates higher prevalence of the disease in
Northern Ireland compared to Great Britain
Indicates lower prevalence of the disease in
Northern Ireland compared to Great Britain
Depression
Epilepsy
Dementia
Note 1: COPD - Chronic obstructive pulmonary disease Note 2: LVD - Left Ventricular Dysfunction
Figure 10: Comparison of disease prevalence in NI with the average level in the rest of the UK in March 2012
Source: The Department/NIAO

Primary Care Prescribing 37
and conditions here compared to the
average in other parts of the UK at
March 2012. Prevalence of epilepsy,
depression and dementia is higher
in Northern Ireland than the average
level in GB. However, for the majority
of categories, prevalence in NI is
considerably less than the average for
other parts of the UK.
3.26 On the basis of the data presented
in Figure 10, therefore, prevalence
of a condition does not seem to fully
explain the higher rates of prescribing
here. Despite the caveats footnoted
at paragraph 3.25, we consider that
estimates of disease prevalence rates
based on QOF data from GP practices
provides an additional source of
information which can help in providing
as complete a picture of prescribing
activity as possible, in order to identify
the opportunities to improve standards
and provide safer care as well as
improving efficiency and effectiveness.
In a period of unprecedented financial
challenge, coupled with major
transformational change, we would
agree with the HSC Board (paragraph
3.23) that the use of QOF data could
be helpful in focusing attention around
optimising medicines use.
3.27 Information on long-standing illness and
disability (based on people’s subjective
assessments of their own health)
31
also
shows NI below the UK average – 18.4
per cent compared against 19.7 per
cent. The Department told us that the
use of patients’ subjective assessments
of their own health in reaching this
conclusion is inappropriate as the data
is unsuitable as a measure of need in this
context. Moreover, while the likelihood
is that people will suffer chronic illness
increases with age, the age distribution
of the population of NI reveals a
relatively smaller share of older citizens
than the rest of the UK (Figure 11).
31 The NI Statistics and Research Agency collects data relating to long standing illness and disability, based on people’s
subjective assessments of their own health. Independent healthcare providers would argue strongly that the incentives under
which they operate ensure that their activities are well aligned with the public interest. The results are contained in the
National Wellbeing Measures publication.

38 Primary Care Prescribing
Part Three:
Trends in General Practitioner (GP) Prescribing Practice
0%
5%
10%
15%
20%
25%
30%
2041203620332030202720242021201820152012
Percentage of population aged 65 and over
England
Northern Ireland
Scotland
Wales
Figure 11: Age distribution of the UK population – percentage of population aged 65 and over
Source: National Population Projections, 2012-based projections (Office of National Statistics)
3.28 Overprescribing represents a waste
of resources. On the other hand,
under-prescribing can indicate unmet
need and potential future health
complications. In order to identify
the extent to which there may be
opportunities for improving the
value for money GPs get from their
prescribing, we recommend that the
HSC Board, along with GPs, should
use the streams of data on disease
prevalence, patients’ self assessments
and relative age distributions to
further explore the relationship
between prescribing rates and
relative healthcare need.

39 Primary Care Prescribing
Part Four:
The Scope for more efficient and effective prescribing
Part Four:
The Scope for more efficient and effective prescribing

40 Primary Care Prescribing
Part Four:
The Scope for more efficient and effective prescribing
4.1 While the prescribing of drugs in
primary care is a matter for GPs
independent clinical judgement, the
HSC Board can nonetheless seek to
influence the choices made by GPs
when prescribing, for example, between
different drugs that have the same
clinical effect but different prices. The
scope for savings in prescribing choices
arises because, for many conditions,
there are a range of drugs that could
be prescribed. When deciding to treat
a patient with medication, a doctor
will typically have a range of different
options to choose from. Frequently, the
cost of these varies considerably. It does
so for two main reasons:
• many drugs are available in both
branded and generic versions, the
latter generally being cheaper; and
• there may also be more than one
drug available for treating a given
medical condition, also at different
prices.
4.2 The management of spending on drugs
in primary care has generally improved
in recent years. For example, the HSC
Board provided us with details showing
annual GP prescribing efficiency savings
of £132 million in the four year period
to 2011-14 (Figure 12).
Figure 12: Annual Efficiency Targets and Achievement over the period from 2010-11 to 2013-2014
Year Efficiency Target
£ million
Efficiencies realised
£ million
(Under)/ Over
achievement
2010/11
£40 £26 (£14)
2011/12
£30 £40 £10
2012/13
£29 £34 £5
2013/14
£23 £32 £9
Total
£122 £132 £10
Note: These figures were calculated by the Department /HSC Board but were not validated as part of our review.
Source: Business Services Organisation

Primary Care Prescribing 41
32 In 2006 the Department launched the “Go Generic” campaign to increase public awareness of generic medicines and
advocate their use. In July 2006 the Department launched a new Prescribing Incentive Scheme (PIS) for GP practices which
included targets for generic dispensing. The PIS is no longer in operation.
33 Source: BSO.
34 By monitoring dispensing rates for generic drugs, NI is more closely identifying generic drug usage. Monitoring elsewhere
in the rest of the UK is based on prescribing levels which do not accurately reflect what was actually dispensed.
35 Generic Prescribing rates for NI are only available since April 2011. Since April 2011 BSO records items prescribed and
dispensed generically, previously it only recorded dispensed.
Primary Care Prescribing 41
The Department, HSC Board and GPs
are to be commended for the savings
generated from improving the rate of
generic prescribing
4.3 For many years the Department
32
and
the HSC Board have been encouraging
GPs to write prescriptions using a
drug’s chemical name, whether or
not the product in question is out of
patent. This is typically known as
‘generic prescribing’. When a branded
medicine’s patent expires, the generic
equivalents which appear on the market -
containing the same active ingredient(s) -
are usually cheaper. In 2013 the average
cost of a generic drug was around £4.21
whilst the average cost of a branded drug
was about £22.61
33
.
4.4 Generic dispensing rates have improved
considerably in NI over the past 10
years. In 2003-04, 41 per cent of items
dispensed were generic rather than
branded drugs. By March 2014, NI
generic prescribing rates had risen to 80
per cent and generic dispensing rates
34
had risen to 71 per cent. Figure 13
compares the generic rates in NI since
2003-04 against that elsewhere in the UK.
Financial
year
NI dispensing
rate %
NI’s prescribing
rate
35
%
England
%
Scotland
%
Wales
%
2003/04
41 - 78 79 76
2004/05
43 - 79 80 78
2005/06
46 - 80 81 80
2006/07
49 - 82 82 82
2007/08
53 - 83 82 84
2008/09
56 - 83 82 84
2009/10
58 - 83 82 84
2010/11
60 75 83 82 83
2011/12
64 78 83 83 83
2012/13
68 79 84 83 83
2013/14
71 80 84 83 83
Figure 13: Generic Prescribing Rates across the UK from 2003 to 2013
Source: The Department and the HSC Board

42 Primary Care Prescribing
Part Four:
The Scope for more efficient and effective prescribing
4.5 The scope for achieving savings
from generic prescribing had been
highlighted in the past. For example, a
report published in 2005
36
outlined that
one of the main reasons for the higher
unit cost of prescriptions in NI (relative
to England) was the greater use of
branded drugs. The report stated that if
NI achieved the same generic rate as
England, costs could be reduced by 18
per cent, saving £55 million. A more
recent report, published in October
2012
37
, estimated that £129 million
savings could be generated in NI over
the 4 year period to 2015 through the
increased use of generic medicines.
The HSC Board estimate that currently
achievable savings from switching to
generic drugs are likely to be modest at
around £1.6 million when set against
the overall drugs bill as most of the
potential savings from generic switching
have already been made.
There is wide variation in the cost of
prescribing per head of population
across individual GP practices locally
4.6 While we recognise the progress that
has been made in how prescribing
costs have been controlled over recent
years, the Department and HSC
Board acknowledges that prescribing
costs per head of population here
are still higher than they should be
and are being addressed as part
of the efficiency agenda. Reducing
22 36
22 37
unwarranted variations in prescribing
activity and cost is one area where there
is potential to save on prescription costs.
Given the factors set out in paragraph
3.2, the occurrence of some variation
is not only inevitable but, on occasion,
may also be necessary in terms of
clinical practice. Therefore, while it can
be difficult to determine why variations in
prescribing patterns exist, unwarranted
variations in activity and expenditure are
causes for concern as they may reflect
differences in quality of care and may
lead to extra expense and potential
waste of resources.
4.7 Age and level of deprivation are two of
the principal determinants of the health
of any population. They affect both the
incidence of the disease (the number of
new cases that develop in a year) and
its prevalence (the number of people
who have a chronic disease at any point
in time).
4.8 Local data has been adjusted for,
among other things, social class and
age distribution using ‘prescribing units’
(PUs) to standardise GP caseloads so
that valid comparisons can be made. As
Figure 14 demonstrates, there can be a
substantial degree of variation between
GP practices after taking account of
population differences.
4.9 We recognise that BSO together with
GP practices have been working hard
to understand variation and to mitigate
unwarranted variation through the work
36 The Appleby Report examined the likely future resource requirements of the health & social care sector in Northern Ireland
and the scope for resources to be used more effectively.
37 The Office of Health Economics for the Association of British Pharmaceutical Industries. UK NHS Medicines Bill projection
2012-15, Oct 2012.

Primary Care Prescribing 43
of MMAs (see paragraphs 3.10 to
3.12). The Department told us that in
the period 2010 to 2013 the range of
variation has reduced. However, Figure
14 shows that in 2013 there was a
variation of over 100 per cent between
the GP practice with the lowest cost
prescribing rate (£26,303) and that of
the highest cost practice (£55,501).
The differences in spending on GP
prescribing among practices here may
be due to differences in the amount of
prescribing; differences in the choice
of drugs prescribed and their cost; or a
mixture of both. The precise causes of
the variations require careful inspection
Figure 14: Cost per 1000 NI Prescribing Units by GP practices in NI (2013)
All GP Practices Mean
£0
£10,000
£20,000
£30,000
£40,000
£50,000
£60,000
351301251201151101511
£41,004
£26,303
£55,501
Source: BSO
to determine the extent to which they
represent good quality practice.
4.10 As the NI PU system normalises
prescribing data to enable a more
balanced comparison within prescribing,
this variation cannot reasonably be
explained by population differences. We
consider that this presents a significant
opportunity for financial savings for
the health and social care sector. For
example, if GP practices performing
above the average prescribing cost
brought their prescribing costs to that of
the average (£41,004), efficiencies of
around £19 million could be achieved.

44 Primary Care Prescribing
Part Four:
The Scope for more efficient and effective prescribing
4.11 The Department has commented that
such an estimate is crude and does not
take into consideration the other factors
associated with prescribing, such as
access to other services; the impact of
cross-border workers; private healthcare.
The Department considers that there
will always be a degree of variability
between GP practices and therefore the
full quantum of such efficiencies will not
be realisable. Despite this, we consider
that a rolling target could be set to
minimise the level of variation between
GP practices. Further we consider that
there is scope to reduce the average
over time. For example, reducing the
average by 10 per cent over a three
year period would generate savings of
£54 million.
4.12 The Department told us that, while it
does not expect that all GP practices
should be at the mean, it accepts
that those with statistically significant
variations (that is, beyond two standard
deviations of the mean) should be
investigated. The Department told us
that it does not accept the analysis
or conclusions in respect of the figure
of £54 million, as being deliverable
without further robust analysis.
There is scope to make further savings
from prescribing without affecting
patient care
4.14 Perhaps the most important dimension
in competition between medicines
is that of the relative effectiveness of
the drugs concerned. In principle, a
difference in price between two drugs is
understandable if the two products have
very different effects. However, when the
prices of prescription medicines do not
reflect their relative therapeutic benefits,
the health and social care sector may
obtain poor value for money.
4.15 As outlined in paragraph 4.3, the
price at which branded medicines are
reimbursed does not change when they
come off-patent and generic substitutes
enter the market. In order to maximise the
savings available when generic substitute
drugs become available, therefore, it
is essential that the HSC Board has
arrangements in place to notify GPs well
in advance of patent expiry dates and to
provide them with clear guidance on the
recommended generic replacements.
4.16 We examined the scope for efficiency
improvements in three therapeutic
areas which account for a significant
proportion of the prescribing budget:
Stomach Acid Treatments; Cholesterol-
controlling Treatments (statins); and
Depression Treatments. The drugs
discussed were chosen for illustrative
purposes to demonstrate the opportunity
costs of failing to prescribe more cost
effective alternatives.
4.13 We recommend that the HSC Board
and BSO continues to compare and
investigate the reasons for variations
that are statistically significant in the
NI PU between GP practices to assist
in the identification of opportunities for
achieving the potential saving levels
set out in paragraph 4.10.

Primary Care Prescribing 45
Earlier switching to cheaper generic
stomach acid treatments (Proton
Pump Inhibitors (PPI)) would have
resulted in additional efficiency
savings of £2.2 million in 2012 and
£1 million in 2013
4.17 Proton Pump Inhibitors (PPIs) reduce the
amount of acid made by the stomach.
They are used to treat acid reflux
and treat and prevent ulcers of the
Figure 15: The number and cost of PPI prescribed since 2009
Spend (£ Million)
Number of Prescription Items (Thousand)
Spend Number of Prescription Items
£15m
£7.5m
0
2
4
6
8
10
12
14
16
20132012201120102000
0
500
1000
1500
2000
2500
Source: BSO
stomach and duodenum. They are also
prescribed to patients using non-steroidal
anti-inflammatory drugs.
4.18 Figure 15 shows that while the number
of PPIs prescribed here has increased
over the last five years, costs have
decreased substantially. However,
Figure 16 shows that NI is still some
way behind the rest of the UK in terms
of the cost of PPI treatments per head of
population.

46 Primary Care Prescribing
Part Four:
The Scope for more efficient and effective prescribing
4.19 The higher cost per patient here reflects
the fact that GPs have tended to
prescribe lower volumes of a generic
PPI substitute compared to other UK
regions. Prior to 2002, PPI patients
were treated with one of a number
of branded drugs (such as Losec© or
Nexium©). In 2002 the Losec© patent
expired and a generic PPI, omeprazole,
became available. In NI, the majority
of patients who had been treated with
the branded Losec© were transferred
to omeprazole. However, few patients
who had traditionally been treated with
Nexium© (esomeprazole) were switched
to omeprazole therefore a comparatively
greater proportion of patients in NI
continued to be treated with the branded
drug Nexium© than the rest of the UK.
During 2012, the cost of Nexium©
was £17.03 compared with £2.27 for
omeprazole.
4.20 Figure 17 shows that in NI in 2012,
48 per cent of the PPI spend related
to branded esomeprazole. Only 29
per cent related to, the much cheaper,
omeprazole. This is low compared
to the level of omeprazole spend in
other UK regions. Although NI GPs
Figure 16: Cost of PPI treatments per head of population in the UK over the 4 year period to 2013
£0
£1
£2
£3
£4
£5
£6
£7
£8
£9
Northern IrelandWalesScotlandEngland
2010
2012 20132011
£2.35
£3.85
£2.64
£4.14
Source: BSO

Primary Care Prescribing 47Primary Care Prescribing 47
prescribe more (low cost) omeprazole
than esomeprazole, the proportion
of esomeprazole prescribed in NI is
higher than any other region of the UK.
In 2012, the opportunity cost to local
health and social care services of not
prescribing omeprazole at a similar rate
as the rest of the UK was £2.2 million.
During 2013 the opportunity cost was
£1million.
Switching to less expensive statins
would have saved around £2.7 million
in 2012 and £2.5 million in 2013
4.21 Statins lower cholesterol and are one
of the classes of drugs employed to
treat cardiovascular disease - the single
greatest cause of death in the UK. High
levels of Low Density Lipoprotein (LDL) or
‘bad cholesterol’ are a well accepted
risk factor associated with the onset of
coronary heart disease. Statins have a
strong effect in reducing LDL cholesterol.
Figure 17: Comparison of the proportion of Omeprazole and Esomeprazole dispensed in the UK during 2012
based on Cost
0%
10%
20%
30%
40%
50%
60%
Northern IrelandWalesScotlandEngland
Omeprazole (£2.27)
Esomeprazole (£17.03)
Source: BSO

48 Primary Care Prescribing
Part Four:
The Scope for more efficient and effective prescribing
4.22 In an attempt to address rising rates of
cardiovascular disease the number of
statins prescribed by GPs has steadily
increased over the last number of years.
By moving from branded to generic
statins, the HSC Board has managed to
reduce unit costs (Figure 18). However,
while Figure 19 shows that the cost per
head of population has successfully been
reduced from £16 in 2010 to £5.32
in 2013, other regions of the UK have
fared even better: during 2013 Wales
spent £3.37 per head, Scotland £5.24
and England £2.88.
Figure 18: The number and cost of statins prescribed since 2009
Spend (£ Million)
Number of Prescribed Items (Thousand)
Spend Number of prescription items
35.10 35.76
33.77
23.17
14.64
0
5
10
15
20
25
30
35
40
20132012201120102009
1500
1600
1700
1800
1900
2000
Source: BSO

Primary Care Prescribing 49Primary Care Prescribing 49
4.23 As with PPIs (paragraphs 4.17 to 4.20),
analysis of the drugs dispensed across
the UK demonstrate that GPs here tend
to prescribe more expensive statins than
GPs elsewhere. In particular, GPs here
prescribe higher volumes of atorvastatin
and rosuvastatin. Prior to coming off
patent in May 2012, atorvastatin
cost £38 per pack and rosuvastatin
(which is not coming off patent until
2016) costs £32 per pack. By contrast
simvastatin and pravastatin (both
available generically since 2003) cost
approximately £2.20 per pack. Figure
20 compares the prescribing behaviour
of GPs here with their counterparts in
the rest of the UK and shows that, in
general, they prescribe larger volumes
of the more expensive statin drugs and
therefore incur higher unit costs.
Figure 19: Cost of Statins per head of population in the UK over the 4 year period to 2013
£0
£2
£4
£6
£8
£10
£12
£14
£16
Northern IrelandWalesScotlandEngland
2010
2012 20132011
£2.88
£5.24
£3.37
£5.32
Source: BSO

50 Primary Care Prescribing
Part Four:
The Scope for more efficient and effective prescribing
38 Statins for the prevention of cardiovascular disease, NICE, January 2006.
4.24 In the absence of strong evidence that
other statins achieve a better reduction in
cardiovascular related deaths and illness
in large populations than simvastatin,
the fact that GPs here tend to favour
the prescription of more expensive
equivalents has a major budgetary
impact.
4.25 Evidence on the comparative efficacy of
statins was produced by the National
Institute for Health and Care Excellence
(NICE) in 2006
38
. In summary, this
guidance recommended the use of a
statin of lowest cost and at that time, this
was simvastatin. In September 2011,
The Scottish Medicines Consortium
advised prescribers that rosuvastatin was
not recommended within Scotland for
the prevention of cardiovascular events.
In November 2011, the All Wales
22 38
Figure 20: Comparison of the use of statins in the UK during 2012
0%
10%
20%
30%
40%
50%
60%
70%
80%
Northern IrelandWalesScotlandEngland
Generic Statin (£2.20)
Branded Statin (£35)
75%
25%
69%
31%
73%
27%
59%
41%
Note The cost figure represent the average cost of statins during 2012
Source: BSO

Primary Care Prescribing 51Primary Care Prescribing 51
39 Lipid modification: cardiovascular risk assessment and the modification of blood lipids for the primary and secondary
prevention of cardiovascular disease, NICE, July 2014.
Medicines Strategy Group directed
that rosuvastatin was not recommended
for preventing major cardiovascular
events in patients with a high risk as
the clinical and cost effectiveness
evidence provided was not sufficient
to recommend it. Until April 2014, in
Northern Ireland there was no body
specifying what medicines ought to
be or not be prescribed resulting in a
higher proportion of the more expensive
drugs being prescribed. Since this
time though, the HSC Board has
put in place the NI Formulary and a
‘Managed Entry’ process to deal with
new medicines.
4.26 Atorvastatin is now available
generically and now costs less than
10 per cent of the branded version.
The NICE Clinical Guidance has
recently been updated
39
and it now
recommends the use of atorvastatin.
However, it has been apparent that
GPs here have been prescribing
comparatively more expensive
equivalents that have a major
budgetary impact. In 2012, the
opportunity cost to local health and
social care services of not prescribing
simvastatin at a similar rate as the rest
of the UK was £2.7 million. The total
opportunity cost for not prescribing all
statins at similar proportions to the rest of
the UK was £4 million and during 2013
was £2.5 million.
Earlier switching to alternative generic
drugs in the treatment of depression
would have resulted in additional
efficiency savings of £2.7 million in
2012 and £1.6 million in 2013
4.27 QOF data (see paragraph 3.24)
shows a slightly higher prevalence of
depression in NI than other UK regions
(see Figure 21). Therefore it is expected
that NI will spend slightly more per
capita on this type of medication.
However, as previously noted, the
Department considers that QOF data is
unsuitable as a reliable measure of need
in this context.
Figure 21: UK Disease Prevalence (as a % of GP Registered Population) Comparison March 2012
Disease Area NI England Scotland Wales
Conditions for
Depression
Screening
7.1% Not available 7.8% 8.2%
Diagnosis of
Depression
9.6% 9.2% 9.0% 9.5%
Source: DHSSPS

52 Primary Care Prescribing
Part Four:
The Scope for more efficient and effective prescribing
Figure 22: The volume and cost of anti-depressants prescribed in NI since 2009
Spend (£ Million)
Number of Presscritpion Items (Thousand)
Spend Number of prescription items
£0
£2
£4
£6
£8
£10
£12
£14
£16
£18
£20
20132012201120102009
0
500
1000
1500
2000
2500
3000
Source: HSC Board
4.28 The volume of anti-depressant
prescribing here has been steadily
increasing over recent years. The cost of
anti-depressants fell considerably during
2012 but rose again slightly in 2013
(see Figure 22). Figure 23 illustrates
that NI has consistently had significantly
higher anti-depressant prescribing costs
per capita than other UK regions.

Primary Care Prescribing 53
4.29 Comparison with the rest of the UK
shows that in Northern Ireland there
was a lower proportion of generic
treatments being prescribed for
depression which would, in part,
explain the higher cost per head.
In particular, escitalopram, one of
the more expensive treatments for
depression, is used more widely here
than any other region of the UK.
During 2012 prescribing costs per
head of population was £1.71 here
compared with £0.41 in Scotland
and £0.26 in Wales.
Figure 23: The cost of anti-depressant prescribing per head of population in the UK over the
4 year period to 2013
£0
£2
£4
£6
£8
£10
£12
Northern IrelandWalesScotlandEngland
2010
2012 20132011
£5.27
£5.55
£6.58
£8.61
Source: HSC Board
4.30 While research suggests that there may
be some slight differences between
escitalopram and close equivalents
(which may make a difference in
how the medicines work), the drug
citalopram is regarded as a close
comparator. However, the price of
these two drugs varies considerably.
Figure 24 shows that a higher
proportion of (the more expensive)
escitalopram is prescribed in NI than
in the rest of the UK. In 2012, the
opportunity cost to local health and
social care services of not prescribing

54 Primary Care Prescribing
Part Four:
The Scope for more efficient and effective prescribing
citalopram at a similar rate as the
rest of the UK was £2.7 million. The
opportunity cost in 2013 due to
Northern Ireland prescribing patterns for
anti-depressant medication not being
similar to those in the rest of the UK was
£1.6 million.
4.31 It should be noted that the HSC Board
has advised that simply switching from
a branded medicine to a different
medicine that is available as a generic
needs to be managed carefully. Given
that the two medicines cited here are
being used for depression and other
mental health issues, the HSC Board has
advised that such changes need to be
worked through very carefully.
Figure 24: Comparison of the proportionate use of Escitalopram and Citalopram in the UK
countries in 2012
0%
10%
20%
30%
40%
50%
60%
Northern IrelandWalesScotlandEngland
Escitalopram
Citalopram
4%
51%
3%
46%
2%
57%
10%
38%
Source: BSO

Primary Care Prescribing 55
40 Pregabalin became available as a generic in October 2013.
Primary Care Prescribing 55
More money is spent prescribing
Pregablin in NI than on any other
drug. Pregablin is more frequently
prescribed in NI than elsewhere in
the UK
4.32 Pregabalin
40
is a medicine used to
treat epilepsy, neuropathic pain and
generalised anxiety disorder. As an
analgesic it works by reducing the
volume of pain signals sent to the brain
from damaged nerves. It can have a
euphoric effect on patients and cases of
abuse and misuse have been reported.
4.33 Figure 25 shows a steep rise in the
volume of pregabalin prescribed
over the last six years and despite a
slowing down of expenditure over
this period, pregabalin currently costs
the prescribing budget £17 million
a year (see Figure 25). This level of
expenditure is higher than any other
single medicine prescribed by GPs.
Pregablin is also more frequently
prescribed in NI than in the rest of
the UK. Figure 26 shows that, during
2013, £9.43 was spent on pregabalin
per head of population here compared
to approximately £4 per head in the
rest of the UK .
Figure 25: The number and cost of Pregabalin since 2009
Spend (£ Million)
Number of Prescription Items (Thousand)
Spend Number of prescription items
0
5
10
15
20
20132012201120102009
0
50
100
150
200
250
300
Source: HSC Board

56 Primary Care Prescribing
Part Four:
The Scope for more efficient and effective prescribing
Figure 26: The cost of Pregabalin per head of population in the UK over the period 2010-2013
£0
£1
£2
£3
£4
£5
£6
£7
£8
£9
£10
Northern IrelandWalesScotlandEngland
2010
2012 20132011
£3.98
£3.78
£4.51
£9.43
Source: HSC Board
4.34 NICE initially recommended
pregabalin (or amitriptyline) as a first-
line treatment in its early guidance on
the pharmacological management
of neuropathic pain published in
2010. But within 18 months withdrew
this recommendation. Guidance
subsequently published in 2013 is that
pregabalin is one of three drugs to be
considered in first line treatment.
4.35 Given the additional cost incurred
by prescribing pregabalin, and the
potential for it to be ‘abused’, it is
not clear why pregablin is so heavily
prescribed in Northern Ireland. In 2013,
the opportunity cost to local health and
social care services of not prescribing
pregablin at a similar rate as the rest of
the UK was £9.7 million. During 2012
it was £8.5 million.

Primary Care Prescribing 57Primary Care Prescribing 57
4.38 We acknowledge that GPs have
succeeded in generating significant
savings in prescribing costs over
recent years by moving from branded
to generic drugs. However, it is clear
also, from the variations we have
found between prescribing practice
here and the rest of the UK, that there
is potential to increase the quantum
of savings even further by focusing on
conditions where there are suitable
drugs available at differing prices. For
instance, on the small range of drugs
we have examined in paragraphs
4.17 to 4.36 we have calculated
that the opportunity cost to health
and social care services here of not
prescribing in a more cost effective
way was over £17 million in 2012
and £15 million in 2013.
4.36 BSO monitors the level of pregabalin
use in NI. In view of its concerns
that usage in NI is higher than is
necessary, it has set a target to
reduce total pregabalin spend by
approximately £1million during 2014.
BSO anticipates that MMAs will play
a significant role in ensuring this target
is achieved.
4.37 We note that the HSC Board has
set a target to reduce usage of
pregabalin in NI by £1 million during
2014. However, in our view, this
target is not sufficiently challenging.
We consider that, with the assistance
of MMAs, GP practices in NI
could move much more quickly to
prescribing levels elsewhere in the
UK.
4.39 An integrated approach,
encompassing all stakeholders,
is needed to optimise the use of
clinically-appropriate and cost-
effective medicines. It is essential the
HSC Board continues to build on the
work it has been undertaking in the
promotion of efficient prescribing.


Appendices:

60 Primary Care Prescribing
Appendix 1
Generic Drug Categories (paragraph 2.12)
Definition Price Basis
Category A
Drugs which are readily
available.
Weighted average of the
prices listed by the following
manufacturers and suppliers:
AAH, Alliance Healthcare
(Distribution) Ltd, Teva UK
and Actavis.
Category B
Drugs whose usage has
declined over time.
Price lists from the following
manufacturers or suppliers
are considered strictly in the
following order: Alliance
Healthcare (Distribution) Ltd,
AAH, UCB Pharma and
Thornton & Ross.
The Tariff price is the list price
for the item is that quoted by
the first manufacturer or
supplier.
Category C
Drugs which are not readily
available as a generic.
Based on the price of
a particular proprietary
product, or as listed by the
manufacturer or, as the case
may be, supplier.
Category E
Extemporaneously prepared
items, made up of two or
more products listed elsewhere
in the Tariff.
The Tariff price is the sum
of the Tariff prices of the
components.
Category M
Drugs which are readily
available.
The Tariff price is set by the
Department of Health based
on information submitted
by manufacturers under
Scheme M
41
.
41 Scheme M is a voluntary scheme for generic manufactures which is designed to assist the Department of Health, England
gather information to support the revision of Category M prices.

Primary Care Prescribing 61
Appendix 2
Legal challenge to new Drug Tariff (paragraph 2.19)
The PCC sought to have the
Department’s decision to introduce the
new Drug Tariff in Northern Ireland
judicially reviewed in 2010. The legal
challenge brought by the PCC was
successful.
In January 2010 the lawfulness of the Department’s
arrangements for remunerating community
pharmacies for dispensing drugs was the subject
of a High Court Judicial Review. The legal
challenge was brought by the Pharmaceutical
Contractors Committee (the PCC)
42
and two
companies which own and operate community
pharmacies in Northern Ireland.
The judge concluded that the 1994 agreement
to follow the Scottish Drug Tariff (which was
based on the English Drug Tariff) reflected the
view of the Department and the PCC that it fairly
remunerated pharmacists. He noted that by 2001,
the Department had become concerned that
the remuneration being provided to pharmacists
was excessive. However, he considered that the
Department’s decision to make a compensatory
payment of over £6 million in 2006-07 was
evidence that it accepted that the revised
arrangements did not fairly reimburse pharmacists.
The judge considered that once it became
apparent to the Department that the Drug Tariff was
not fulfilling its statutory purpose, it had a legal
obligation to resolve the situation. While accepting
that the Department took steps to remedy the
position, the judge was critical of the Department
for failing to calculate and offer a compensatory
amount for the 2007-08 and 2008-09 financial
years.
42 On 15 June 2005, the Pharmaceutical Contractors Committee (PCC) became a Company Limited by guarantee.
On 24 March 2011, the company changes its name to Community Pharmacy NI (CPNI) to reflect and represent its
expanded remit.
43 The CPNI represents all of Northern Ireland’s community pharmacy contractors negotiations on services, the pharmacy
contract and remuneration and reimbursement with the Health and Social Care Board (HSCB) and the Department of
Health, Social Services and Public Safety (DHSSPS).
The judge ruled that the failure to reach agreement
with the PCC did not excuse the Department from
its obligation to provide reasonable remuneration
to pharmacists (for past and future periods).
Concluding that the Department was continuing to
fail in complying with its statutory obligations, he
declared that the arrangements at that time were
unlawful.
The 2010 Judicial Review led to extensive
negotiations between the Community Pharmacy
Northern Ireland (CPNI)
43
and the Department. This
resulted in the signing of a provisional agreement
in July 2010. The provisional agreement provided
for interim, non-recurrent monthly payments to
contractors from 1 April 2010 to 31 March
2011. The agreement highlighted that it was
incumbent on all relevant parties to work to have a
fair and reasonable remuneration model in place
by 31 March 2011. Finally it was made clear that
if agreement could not be reached the Department
would be legally obliged to implement a fair and
reasonable solution.
No agreement could be reached and, on 1 April
2011, following consultation on the outcome
of an external review of community pharmacy
remuneration in NI which recommended the
introduction of the English Drug Tariff in NI, the
Department introduced a revised Drug Tariff. In
December 2011, the CPNI brought a second
judicial challenge against the Department.

62 Primary Care Prescribing
Appendix 2
Legal challenge to new Drug Tariff (paragraph 2.19)
44 NI - True Costs of NHS Pharmacy, The Tribal Report, 13 January 2011.
The CPNI sought a second Judicial
Review of the Department’s decisions
when it unilaterally introduced a
revised Drug tariff in 2011. This
second legal challenge brought by
PCC was also successful.
The Department, having an awareness of the
importance of obtaining access to reliable and
up-to-date market information employed an external
consultant
44
to provide advice. The consultant was
tasked with developing a methodology, model and
working prototype:
• to support the development and
ongoing maintenance of a new NI
Drug tariff which could be adapted
or reviewed to reflect changing
circumstances; and
• to support the assessment of the
return on investment required by
community pharmacists to achieve
fair and reasonable funding for
the delivery of their NHS service
contract.
In October 2010, the consultant reported that any
amended NI Drug Tariff should adopt the English
model as a reference source. It acknowledged
that the model would require adjustment to reflect
the different conditions in Northern Ireland and
highlighted that there were various areas were
Northern Ireland-specific data would need to
be gathered in order that appropriate, informed
adjustments could be made.
Having considered the evidence the judge
concluded that:
• the Department failed to carry
out sufficient consultation and
investigation to enable it to compile
and publish a Drug tariff which
complied with statutory objectives,
including the objective of ensuring
fair and reasonable remuneration for
pharmacists, in particular, it failed to
carry out any costs surveys or any
margins survey, or to use available
alternative powers to establish key
information about the costs and
profits of pharmacy business in
Northern Ireland;
• the respondents failed to carry
out sufficient consultation and
investigation to enable them to
identify the need for (and arrange
for the implementation of) any
necessary adjustments to the English
Tariff model in light of conditions in
Northern Ireland, with the objective
of ensuring fair and reasonable
remuneration for pharmacists here;
and
• the Department erred in failing
to carry out a Regulatory Impact
Assessment (RIA) and that error
constituted a breach of the
applicant’s legitimate expectation that
an RIA would be conducted in the
present case and resulted in potential
loss of relevant information.

Primary Care Prescribing 63
In summary the legal challenge brought by the
CPNI was successful. While the judicial review
clarified the Department’s statutory obligation to
provide fair and reasonable reimbursement and
remuneration, the judge did not quash the extant
NI Drug Tariff (as requested by the CPNI) or
impose any financial penalty on the Department.
As a consequence of the second Judicial Review,
the Department was required to conduct a Cost of
Service Inquiry and an On-going Margins Survey
for NI. These exercises are on-going.
The Department and CPNI agreed an interim
financial arrangements covering the two year
period to 31 March 2013. Agreement was also
reached that no RIA was required for this period.
The NI Drug Tariff continues to reflect
reimbursement costs in England and Wales and
is key to ensuring that the cost of medicines in NI
is not excessive (compared to other UK regions).
The application of English Tariff prices supports the
current policy position that NI is part of a UK-wide
Drugs Markets with access to the same medicine
prices as the rest of the UK.
Community Pharmacists received
£6 million compensation in 2006-
07. Additional non-recurrent
remuneration of some £40 million
was paid to community pharmacists
over the period 2007 to 2011.
Since the implementation of Category M in NI
in 2006, CPCs have received £6 million in
compensation in recognition that the revised
arrangements have resulted in lower reimbursement
rates for community pharmacists. Additional non-
recurrent remuneration of some £40 million was
paid to community pharmacists as part of an
agreed interim position covering the period 2007
to 2011.
Further agreement was reached following the
outcome of the second judicial review. On the eve
of an Appeal Hearing, community pharmacists
agreed to participate in the Cost of Service
Inquiry and the On-going Margins Survey and
waived the need for the Department to produce an
RIA. Elements of the funding provided under this
further agreement remain subject to retrospective
clawback subject to the outcome of the on-going
reviews.
Additional Payments to Pharmacy Contractors over
the period 2006 to 2013
Year Additional
Payments
(£ million)
2006-07 6
2007-08 to 2010-11 40
Total 46
Source : DHSSPS

64 Primary Care Prescribing
NIAO Reports 2013-2014
Title Date Published
2013
Department for Regional Development: Review of an Investigation
of a Whistleblower Complaint 12 February 2013
Improving Literacy and Numeracy Achievement in Schools 19 February 2013
General Report on the Health and Social Care Sector by the Comptroller
and Auditor General for Northern Ireland 5 March 2013
Northern Ireland Water’s Response to a Suspected Fraud 12 March 2013
Department of Culture, Arts and Leisure: Management of
Major Capital Projects 22 March 2013
Sickness Absence in the Northern Ireland Public Sector 23 April 2013
Review of Continuous Improvement Arrangements in Policing 3 September 2013
The Agri-Food and Biosciences Institute (AFBI) 12 September 2013
Tackling Social Housing Tenancy Fraud in Northern Ireland 24 September 2013
Account NI: Review of a Public Sector Financial Shared Service Centre 1 October 2013
DOE Planning: Review of Counter Fraud Arrangements 15 October 2013
Financial Auditing & Reporting 2013 5 November 2013
The exercise by local government auditors of their functions in the
year to 31 March 2013 19 November 2013
Department for Regional Development: Archaeological Claims Settlement 3 December 2013
Sport NI’s Project Management and Oversight of the St Colman’s Project 10 December 2013
2014
The Future Impact of Borrowing and Private Finance Initiative Commitments 14 January 2014
Improving Pupil Attendance: Follow-Up Report 25 February 2014
Belfast Metropolitan College’s Titanic Quarter PPP Project 25 March 2014
Safer Births: Using Information to Improve Quality 29 April 2014
Continuous Improvement Arrangements in Policing 6 May 2014
Improving Social Housing through Stock Transfer 3 June 2014
Managing and Protecting Funds Held in Court 1 July 2014
Modernising benefit delivery in the Social Security Agency’s
local office network 11 November 2014
Local Government Auditor’s Report - 2014 18 November 2014

Primary Care Prescribing 67

Published and printed by CDS
CDS 122074
9 781910 219553
ISBN 978-1-910219-55-3
