
Working Paper Series
Identification of systematic monetary
policy
Lukas Hack, Klodiana Istrefi, Matthias Meier
Disclaimer: This paper should not be reported as representing the views of the European Central Bank
(ECB). The views expressed are those of the authors and do not necessarily reflect those of the ECB.
No 2851
Abstract
We propose a novel identification design to estimate the causal effects of systematic
monetary policy on the propagation of macroeconomic shocks. The design combines (i) a
time-varying measure of systematic monetary policy based on the historical composition of
hawks and doves in the Federal Open Market Committee (FOMC) with (ii) an instrument
that leverages the mechanical FOMC rotation of voting rights. We apply our design to
study the effects of government spending shocks. We find fiscal multipliers between two and
three when the FOMC is dovish and below zero when it is hawkish. Narrative evidence from
historical FOMC records corroborates our findings.
Keywords: monetary policy, FOMC, rotation, government spending.
JEL Codes: E32, E52, E62, E63, H56.
ECB Working Paper Series No 2851
1
Non-technical summary
Monetary policy decisions made by central banks are intentional responses to macroeconomic
conditions. These responses are known as systematic monetary policy. In theory, system-
atic monetary policy plays a crucial role in influencing the impact of macroeconomic shocks.
However, there is a lack of reduced-form empirical evidence that identifies and quantifies this
causal relationship. In this study, we first introduce an identification design to assess the causal
effects of systematic monetary policy on the propagation of macroeconomic shocks. We then
use this design to study the interaction between government spending and the response of
systematic monetary policy. Our findings show that systematic monetary policy is a crucial
determinant of the effectiveness of fiscal policy.
Our identification design combines a measure of systematic monetary policy based on the histor-
ical composition of hawks and doves in the Federal Reserve’s Federal Open Market Committee
(FOMC) since the 1960s, along with an instrument that levers the mechanical rotation of voting
rights in the FOMC. The classification of FOMC members as hawks or doves is based on narra-
tives from news archives, portraying them as either more concerned about inflation (hawks) or
more concerned about supporting employment and growth (doves), as in Istrefi (2019).
To account for changes in the composition of hawks and doves in the FOMC that are influenced
by economic and political developments, we construct an instrumental variable that takes advan-
tage of the mechanical rotation of voting rights in the FOMC. This rotation is a yearly process
that redistributes voting rights among the Federal Reserve Bank presidents. The mechanical
nature of the rotation renders it exogenous to economic or political factors, allowing us to iden-
tify the causal effects of systematic monetary policy. To the best of our knowledge, our FOMC
rotation instrument is the first instrument of systematic monetary policy.
To estimate the causal effects of systematic monetary policy on the propagation of fiscal shocks
in the economy, we use a local projection model where macroeconomic variables such as GDP
or government consumption respond to the fiscal shock, the interaction between the fiscal shock
and the Hawk-Dove balance in the FOMC, the level of the Hawk-Dove balance, and potentially
other factors as well. The instrument vector is given by the vector of regressors when replacing
the Hawk-Dove balance with the FOMC rotation instrument. For the fiscal shock, we examine
military spending shocks as studied in previous works by Ramey (2011) and Ramey and Zubairy
(2018), for the period from 1960 to 2014.
Our findings show that the response of GDP to government spending shocks depends crucially
on the number of dovish and hawkish FOMC members. An increase in discretionary govern-
ment spending leads to a GDP expansion which is more pronounced when more dovish FOMC
members vote in the FOMC. Conversely, more hawks dampen the expansionary effect of govern-
ment spending. Quantitatively, we find that the peak GDP increase roughly doubles when there
are two more doves in the FOMC relative to the long-run sample average. In contrast, we find
that GDP does not expand in response to additional government spending when there are two
more hawks in the FOMC.
A common metric to evaluate the effectiveness of fiscal spending is the fiscal multiplier: the
increase in GDP per additional government spending. We find a strong and highly significant
dependence of the fiscal multiplier on systematic monetary policy. Under a hawkish FOMC,
ECB Working Paper Series No 2851
2
the multiplier is insignificant, with point estimates at or below 0. Under a dovish FOMC,
the multiplier is highly statistically significant and ranges between 2 and 3. An additional
important result is that when we consider systematic monetary policy in our analysis, the
average multipliers are larger and more precisely estimated compared to a linear model that
ignores this relationship.
Upon examining the mechanism underlying the state-dependent effects of government spending
shocks, we observe distinct patterns in nominal interest rates depending on the hawkishness
of the FOMC. Under a hawkish FOMC, nominal interest rates tend to rise substantially. On
the other hand, under a dovish FOMC, nominal interest rates initially decline and experience a
delayed increase. This suggests that a hawkish FOMC hikes rates in response to fiscal expansion
to contain inflationary pressures. Indeed, we find that a hawkish FOMC is more successful in
containing inflation expectations and inflation.
It is important to note that drawing the conclusion that the government should increase spending
when central banks have committees with dovish members in the majority could be misleading.
This is because such changes in government spending would not be random shocks (what we
studied) but predictable policy decisions. The Lucas critique applies if there are structural
changes in the conduct of fiscal policy. To avoid misleading conclusions, a promising direction
for future research is to utilize our findings to inform micro-founded models that study optimal
fiscal stabilization policies.
Finally, while our identification design is specific to U.S. monetary policy, a promising avenue
for future research is to study other countries or currency areas in which committees decide
monetary policy. In fact, since 2015 the European Central Bank’s Governing Council allocates
voting rights to its members through a rotation mechanism. Investigating these contexts can
provide valuable insights into the interaction between systematic monetary policy and fiscal
shocks in different settings.
ECB Working Paper Series No 2851
3

1 Introduction
Monetary policy is not random but a purposeful response to macroeconomic conditions. This
response represents systematic monetary policy. Fundamentally, the systematic response reflects
the preferences of the policymakers, e.g., concerning price stability and employment, which
change over time as the policymakers change. As a consequence, the effects of macroeconomic
shocks differ across time, depending on systematic monetary policy. In theory, systematic
monetary policy is well-known to be important for the propagation of macroeconomic shocks.
However, there is no direct evidence on the causal effects of the Fed’s systematic monetary
policy.
1
The main contribution of this paper is an identification design to estimate the causal effects
of systematic monetary policy on the propagation of macroeconomic shocks. We use historical
fluctuations in the composition of hawks and doves in the Federal Open Market Committee
(FOMC) to measure time variation in systematic monetary policy. To address the concern
that these fluctuations are endogenous to economic and political developments, we propose an
instrument that exploits the mechanical rotation of voting rights in the FOMC. To the best of
our knowledge, our FOMC rotation instrument is the first instrument for systematic monetary
policy. We then apply the identification design to government spending shocks and find that
fiscal multipliers significantly depend on systematic monetary policy. When the FOMC is
dovish, it delays tightening in response to an expansionary fiscal spending shock, and fiscal
multipliers are between two and three. Conversely, multipliers can be negative under a hawkish
FOMC that tightens faster and more aggressively.
We measure time variation in systematic U.S. monetary policy building on the narrative clas-
sification of FOMC members by Istrefi (2019) which uses news archives to classify members of
the FOMC as hawks and doves, for the period 1960 to 2023. Hawks are more concerned about
inflation, while doves are more concerned about supporting employment and growth. Following
Istrefi (2019) and Bordo and Istrefi (2023), we aggregate individual FOMC member preferences
into an aggregate Hawk-Dove balance for each FOMC meeting.
2
The Hawk-Dove balance is an
appealing measure of systematic monetary policy because it reflects the aggressiveness of the
FOMC towards fulfilling one or the other leg of the dual mandate without having to specify a
policy reaction function or the policy tools.
Identifying the causal effects of systematic monetary policy, independent of how it is measured,
is challenging because of endogeneity. For example, systematic monetary policy may change in
response to unemployment or inflation (Davig and Leeper, 2008). Similarly, the appointment
of central bankers can depend on economic and political circumstances, e.g., as documented
1
A vast empirical literature estimates the effects of monetary policy shocks (e.g., the pioneering work by
Romer and Romer, 1989; Bernanke and Blinder, 1992; Cochrane and Piazzesi, 2002). These shocks are commonly
understood as deviations from a policy rule, whereas most policy variation is due to systematic monetary policy,
i.e., the rule itself. While evidence on monetary policy shocks may (indirectly) be informative about the effects
of systematic monetary policy under certain assumptions (e.g., McKay and Wolf, 2022), we propose to directly
estimate the causal effects of systematic monetary policy.
2
Istrefi (2019) constructs the FOMC Hawk-Dove balance and shows that these preferences match with narra-
tives on monetary policy, preferred interest rates, dissents, and forecasts of FOMC members. Bordo and Istrefi
(2023) study what forms these preferences and how the FOMC composition affects decision making by estimating
a Taylor rule augmented by the Hawk-Dove balance. We go beyond their analysis by estimating the dynamic
causal effects of systematic monetary policy on the propagation of macroeconomic shocks.
ECB Working Paper Series No 2851
4

for the Nixon administration (Abrams, 2006; Abrams and Butkiewicz, 2012). We discuss this
identification challenge through the lens of a New Keynesian model in which the coefficients of
the monetary policy rule fluctuate in response to macroeconomic shocks. The model dynamics
can be represented as a state-dependent local projection. The OLS estimates of the local
projection will fail to identify the causal effects of systematic monetary policy because they are
contaminated by unobserved shocks that change the monetary policy rule. Instead, we show
that an instrument that captures exogenous variation in systematic monetary policy achieves
identification.
We propose an instrument that levers exogenous variation in the Hawk-Dove balance arising
from the FOMC rotation. The rotation is an annual mechanical scheme that shuffles four voting
rights among eleven Federal Reserve Bank presidents.
3
Specifically, our FOMC rotation instru-
ment is the Hawk-Dove balance of the subset of FOMC members with temporary voting rights
through the rotation. Importantly, the mechanic nature of the rotation renders it orthogonal
to economic and political developments.
Our identification design combines the measure of systematic monetary policy and the instru-
ment in a state-dependent local projection for a macroeconomic shock of interest. Specifically,
we regress an outcome of interest on the shock, the shock interacted with the Hawk-Dove
balance, the Hawk-Dove balance in levels, and possibly further controls. The instrument vector
is given by the vector of regressors when replacing the Hawk-Dove balance with the FOMC
rotation instrument. This local projection is in line with the dynamics of a New Keynesian
model with time-varying systematic monetary policy. However, different from a New Keynesian
model, our design identifies the effects of systematic monetary policy without imposing strong
structural assumptions.
We apply our identification design to study the effects of government spending shocks. The
response of monetary policy to fiscal policy is widely considered to be crucial for the effectiveness
of fiscal policy, both in the policy debate (e.g., Blinder, 2022) and in New Keynesian theory
(e.g., Woodford, 2011; Farhi and Werning, 2016). Notwithstanding the perceived importance of
this type of fiscal-monetary interaction, there is no direct evidence on the causal effects of the
Fed’s systematic monetary policy for the propagation of government spending shocks.
We focus on the military spending shocks in Ramey (2011) and Ramey and Zubairy (2018) for
the period 1960-2014.
4
We find that the real GDP response significantly depends on systematic
monetary policy. The GDP response increases in the share of dovish FOMC members, and
decreases in the share of hawks. When the Hawk-Dove balance exceeds the sample average
by two doves, quarterly GDP increases by up to 0.7% in response to a military shock, which
is expected to raise cumulative military spending by 1% of GDP over the next five years.
Conversely, quarterly GDP falls by up to 0.3% when the Hawk-Dove balance exceeds the sample
average by two hawks.
5
3
The rotation is considered important by Fed watchers in the media. Each year before the rotation, they
discuss its implications for the direction of monetary policy. Relatedly, Ehrmann et al. (2022) study how voting
rights affect the communication of Federal Reserve Bank presidents and market reaction to this communication.
4
In the post-Korean War sample that we study, Ramey (2011) shows that these shocks are poor instruments
and the average spending multiplier is imprecisely estimated. In contrast, we show that accounting for time-
varying systematic monetary policy strongly improves the precision of the estimated multiplier.
5
For comparison, an increase of the Hawk-Dove balance by two doves or two hawks roughly corresponds to
ECB Working Paper Series No 2851
5

The negative (and significant) dependence of the GDP response on the FOMC’s Hawk-Dove
balance is in line with commonly used New Keynesian models in which a more aggressive central
bank response to fiscal shocks leads to smaller GDP effects. We see this evidence as supporting
the usefulness of our identification design. In contrast, the OLS estimate substantially under-
estimates the role of systematic monetary policy on the GDP response to spending shocks.
A common metric to assess the effectiveness of fiscal spending is the spending multiplier, the
dollar increase of real GDP per additional dollar of real government spending. We estimate the
two- and four-year cumulative spending multipliers and find strong dependence on systematic
monetary policy. While multipliers under a hawkish FOMC are typically insignificant with point
estimates at or below 0, we find that dovish multipliers are between 2 and 3 and statistically
significant. Moreover, the average multipliers are larger and much more precisely estimated
when accounting for systematic monetary policy compared to a linear model that omits this
state dependency. These results are robust to various modeling choices, as we show in an
extensive sensitivity analysis.
We further inspect the mechanism behind the state-dependent effects of government spending
shocks. We show that nominal interest rates rise under a hawkish FOMC, while they initially
fall and rise only with substantial delay under a dovish FOMC. When the Hawk-Dove balance
exceeds the sample average by two hawks, the federal funds rate (FFR) starts to increase within
one year and rises up to 50 basis points beyond the pre-shock level around two years after the
shock. Conversely, the FFR falls below the pre-shock level for more than two years after the
shock, and then sharply rises toward a 50 basis point increase three years after the shock, when
there are two more doves in the FOMC. The different interest rate responses are consistent
with the fiscal multiplier estimates across hawkish and dovish FOMCs. Moreover, we find that
hawkish policy is more successful in containing inflation and that the monetary policy response
primarily transmits to real GDP through private consumption.
Finally, we complement our quantitative analysis with narrative evidence from the historical
records of the FOMC meetings. These records reveal that FOMC members and staff frequently
discuss changes in (military) government spending, their potential impact on the economy
and inflation, and the FOMC’s policy response. We further provide detailed case studies of
two important military spending buildup events in the 1960s, associated with the U.S. Space
Program and the Vietnam War. We show that a hawkish FOMC indeed tightens faster after
military buildups, whereas a dovish FOMC delays action.
Relation to literature. This paper contributes to a literature that aims to identify the effects
of systematic monetary policy on the propagation of macroeconomic shocks. Closely related
are McKay and Wolf (2022) and Barnichon and Mesters (2022) which differ in the required
structural assumptions and observational requirements from our identification design.
6
Their
approach assumes a linear (structural) model to identify the effects of monetary policy rules
using multiple monetary policy (news) shocks. In contrast, our approach exploits the historical
one standard deviation in the change of the Hawk-Dove balance.
6
McKay and Wolf (2022) focus on constructing policy counterfactuals, whereas Barnichon and Mesters (2022)
uses a similar approach to study optimal policy. Relatedly, Wolf (2023) uses the approach of McKay and Wolf
(2022) to provide fiscal policy shock counterfactuals for a strict inflation targeting central bank.
ECB Working Paper Series No 2851
6

variation in systematic monetary policy in a non-linear model to directly estimate its causal
effects. In fact, our evidence shows that the non-linearity with respect to systematic mone-
tary policy is statistically significant and economically large. This suggests that avoiding the
linearity assumption is important, underscoring the importance of our identification design. A
more traditional approach constructs monetary policy counterfactuals via a sequence of mone-
tary policy shocks (e.g., Bernanke et al., 1997; Kilian and Lewis, 2011; Benati, 2021).
7
Yet,
this approach is subject to the Lucas critique (Sargent, 1979), except for the special case of
modest shocks (Leeper and Zha, 2003). Our identification design is not subject to this Lucas
critique because we explicitly model and estimate how the dynamics depend on systematic
monetary policy. Another closely related paper is Cloyne et al. (2021), which estimates the
role of systematic monetary policy for the propagation of fiscal consolidation shocks. Whereas
Cloyne et al. (2021) leverages time-invariant cross-country differences in systematic monetary
policy estimated from Taylor rule regressions, we leverage exogenous variation in systematic
monetary policy in the U.S. over time.
Another approach of estimating the effects of time-varying systematic monetary policy uses
non-linear VAR models (e.g., Primiceri, 2005; Sims and Zha, 2006). A key advantage of our
approach is that it requires weaker identifying assumption and addresses the potential endo-
geneity of systematic monetary policy. Our paper also relates to a literature studying macroe-
conomic models with exogenous changes in systematic monetary policy (e.g., Davig and Leeper,
2007; Bianchi, 2013; Leeper et al., 2017) or endogenous changes (e.g., Davig and Leeper, 2008;
Barthélemy and Marx, 2017). Our time-series approach requires fewer structural assumptions
and provides moments to discipline such models.
Finally, our paper relates to a large empirical literature that estimates the government spending
multiplier. Most empirical estimates find an average fiscal spending multiplier between 0.5 and
1.5 (e.g., Blanchard and Perotti, 2002; Mountford and Uhlig, 2009; Barro and Redlick, 2011;
Ramey, 2011). Closely related are recent papers which study how the effects of government
spending shocks differ at the zero lower bound (e.g., Ramey and Zubairy, 2018; Miyamoto
et al., 2018). While the zero lower bound reflects a specific monetary policy regime, this regime
is endogenous to the business cycle which means the estimates may reflect both the regime and
the shocks leading to it. Instead, we isolate the causal effects of monetary policy. Another
related paper is Nakamura and Steinsson (2014), which estimates relative regional multipliers
that difference out the response of monetary policy. Our paper also relates to many recent
papers that have estimated state-dependencies of the multiplier (other than systematic monetary
policy), e.g., depending on the economy being in recession (Auerbach and Gorodnichenko, 2012;
Jordà and Taylor, 2016; Ramey and Zubairy, 2018; Ghassibe and Zanetti, 2022); sign of the
shock (Barnichon et al., 2022; Ben Zeev et al., 2023); exchange-rate regime, trade openness,
and public debt (Ilzetzki et al., 2013); foreign holdings of debt (Broner et al., 2022); and tax
progressivity (Ferrière and Navarro, 2018).
The paper is organized as follows: Section 2 provides a simple New Keynesian model to
discuss the identification challenge. Section 3 introduces the identification design for system-
7
A further related paper on the intersection of shocks and systematic policy is Arias et al. (2019) which
identifies monetary policy shocks via sign restrictions on systematic monetary policy.
ECB Working Paper Series No 2851
7

atic U.S. monetary policy. Section 4 contains the main empirical results on the effects of fiscal
spending shocks. Section 5 provides evidence for understanding the mechanism. Section 6
provides a narrative of the FOMC records in the 1960s. Section 7 concludes.
2 Identification challenge
In this section, we present a stylized non-linear New Keynesian model in which systematic
monetary policy may fluctuate endogenously. We use the model to expound the challenge of
empirically identifying the effects of systematic monetary policy on the propagation of macroe-
conomic shocks.
A New Keynesian model. The model is a textbook New Keynesian model (e.g., Galí,
2015) except for a monetary policy rule with time-varying coefficients. Households choose
consumption, labor and bond holdings to maximize E
0
P
∞
t=0
β
t
log C
t
− N
1+φ
t
subject to
budget constraints. Intermediate good firms produce variety goods using Y
it
= x
a
t
N
it
where
x
a
t
is exogenous productivity. The price of the variety good can be reset with a constant
probability 1 − θ. Final good firms produce the final good Y
t
=
R
1
0
Y
(ϵ−1)/ϵ
it
di
ϵ/(ϵ−1)
. A
fiscal policy authority finances government spending G
t
= γY x
s
t
with lump-sum taxes where
γ ∈ [0, 1), Y is steady-state output, and x
s
t
denotes exogenous changes in fiscal spending. Goods
market clearing requires Y
t
= C
t
+ G
t
. The exogenous variables follow stable AR(1) processes
log x
k
t
= ρ
k
log x
k
t−1
+ ε
k
t
with ε
k
t
∼ (0, σ
2
k
) for k = a, s respectively. A monetary policy rule
closes the model. Letting lower case letters denote (log) deviations from the steady state, the
monetary authority sets nominal interest rates i
t
according to
i
t
=
e
ϕ
t
π
t
, (2.1)
where
e
ϕ
t
∈ (1, ∞) is systematic monetary policy, which varies over time according to a stable
AR(1) process
ϕ
t
= ρ
ϕ
ϕ
t−1
+ ζ
s
ε
s
t
+ ζ
a
ε
a
t
+ η
t
, (2.2)
where
e
ϕ
t
= ϕ+ϕ
t
and ϕ denotes the unconditional mean of
e
ϕ
t
. Importantly, we allow systematic
monetary policy to be endogenous, as ϕ
t
may respond to macroeconomic shocks (ε
s
t
, ε
a
t
).
8
Such
endogeneity creates an empirical identification challenge as we discuss toward the end of this
section. In addition, we allow for exogenous changes in systematic monetary policy, captured
by the exogenous policy shifter η
t
. We assume that ε
s
t
, ε
a
t
, and η
t
are mutually independent
and identically distributed over time.
Accounting for the non-linear effects of systematic monetary policy ϕ
t
, the approximate equi-
librium dynamics of GDP are given by
y
t
= a + b
s
x
s
t
+ b
a
x
a
t
+ c
s
x
s
t
ϕ
t
+ c
a
x
a
t
ϕ
t
+ dϕ
t
, (2.3)
8
For DSGE models with exogenous changes in the Taylor rule coefficients, see, e.g., Davig and Leeper (2007)
and Bianchi (2013). For endogenous changes in the Taylor rule coefficients, see, e.g., Davig and Leeper (2008)
and Barthélemy and Marx (2017).
ECB Working Paper Series No 2851
8

where a, b
s
, b
a
, c
s
, c
a
, d are coefficients that depend on the deep structural parameters of the
model. Appendix A.1 provides details on the derivation.
Identification challenge. We next discuss the challenge of identifying the effects of system-
atic monetary policy from a regression when y
t
is generated by (2.3). Without loss of generality,
and in anticipation of our main empirical question, we focus our discussion on the fiscal spending
shock. Consider an econometrician who observes y
t
, ε
s
t
, ϕ
t
, and estimates the state-dependent
local projection
y
t+h
= α
h
+ β
h
ε
s
t
+ γ
h
ε
s
t
ϕ
t
+ δ
h
ϕ
t
+ v
h
t+h
, (2.4)
for h = 0, . . . , H forecast horizons. For h = 0, the residual v
h
t+h
contains lagged spending shocks,
contemporaneous and lagged technology shocks, and the interaction of these shocks with ϕ
t
.
For h > 0, the residual further contains shocks (ε
s
t
, ε
a
t
) and policy shifter (η
t
) occuring between
t and t + h. The estimands in (2.4) are
β
h
= b
s
(ρ
s
)
h
, γ
h
= c
s
(ρ
s
ρ
ϕ
)
h
, δ
h
= d(ρ
ϕ
)
h
. (2.5)
Both β
h
, the average effect of the spending shock, and γ
h
, the differential effect associated with
ϕ
t
, diminish in the forecast horizon h.
We next ask whether the OLS estimates of (β
h
, γ
h
, δ
h
) are consistent, i.e., whether they asymp-
totically recover the estimands in (2.5).
9
In general, consistency holds under the strong exogeneity
assumption ζ
s
= ζ
a
= 0, that is if ϕ
t
is independent of the macroeconomic shocks. In contrast,
if ϕ
t
correlates with at least one of the shocks, the OLS estimates do not consistently esti-
mate (β
h
, γ
h
, δ
h
). If, for example, ϕ
t
responds to a technology shock, the OLS estimator will
be contaminated by the response of GDP to the technology shock.
10
For further details, see
Appendix A.2.
Now suppose the econometrician observes an instrument ϕ
IV
t
that is correlated with ϕ
t
(rele-
vance), but uncorrelated with all past, present, and future macroeconomic shocks ε
s
t
and ε
a
t
and that is uncorrelated with all past and future policy shifters η
t
(exogeneity). Consider the
IV estimates of (β
h
, γ
h
, δ
h
) when using (ε
s
t
, ε
s
t
ϕ
IV
t
, ϕ
IV
t
) as instrument vector for the regres-
sors (ε
s
t
, ε
s
t
ϕ
t
, ϕ
t
). The IV estimator consistently estimates (β
h
, γ
h
, δ
h
), even when ϕ
t
fluctu-
ates endogenously in response to macroeconomic shocks (ζ
a
, ζ
m
̸= 0). For further details, see
Appendix A.2. This result guides the remainder of our paper in which we propose an instrument
for systematic monetary policy and use it to estimate the causal effects of systematic monetary
policy.
Illustration. To illustrate the effects of systematic monetary policy and the identification
challenge, we focus on a special case of our economy in which ρ
s
= ρ
a
= ρ
ϕ
= 0. To understand
9
We explicitly include δ
h
in the vector of coefficients because including the (endogenous) control variable ϕ
t
in the regression is important for identification, as ϕ
t
is correlated with ε
s
t
and ε
s
t
ϕ
t
in general.
10
If the econometrician observes and includes all shocks and corresponding interaction terms in the regression
according to equation (2.3), then the OLS estimates will be consistent without the exogeneity assumption. In
practice, this is infeasible as many shocks are (partially) unobserved.
ECB Working Paper Series No 2851
9

Figure 1: GDP response and systematic monetary policy
Notes: The solid line shows the model solution for the GDP response to a spending shock as a function of systematic
monetary policy (ϕ
t
), i.e., b
s
+ c
s
ϕ
t
, with b
s
and c
s
given by (2.6) and the parametrization: β = 0.99, θ = 0.75, ϵ = 9,
φ = 2, γ = 0.2,
¯
ϕ = 1.5, ζ
s
= 1, ζ
a
= 0.25, σ
s
= σ
a
= 1. The dashed line shows the OLS estimate
ˆ
β
OLS
s
+ ˆγ
OLS
s
ϕ
t
based
on a regression of (2.3) when the terms in u
t
are unobserved. The implied coefficients are β
s
= 0.164 and γ
s
= −0.017,
and the large-sample OLS estimates are
ˆ
β
OLS
s
= 0.164 and ˆγ
OLS
s
= −0.002.
how ϕ
t
affects the GDP response to fiscal spending shock ε
s
t
, we need to know
b
s
= γ (1 + λϕ) ω
−1
, c
s
= −γ(1 − γ)λφω
−2
, (2.6)
where ω = 1 + λ (φ(1 − γ) + 1) ϕ, λ = (1 − θ)(1 − βθ)/θ. Since β
s
> 0 and γ
s
< 0 (under
standard parameter restrictions), the GDP response falls in the strength of the monetary policy
reaction to inflation. This is the monetary offset (e.g., Woodford, 2011; Christiano et al., 2011).
The solid line in Figure 1 illustrates the monetary offset. The dashed line illustrates the OLS
bias in the estimated GDP response to the spending shock. In our example, the OLS estimate
understates the role of systematic monetary policy.
3 Identification design
In this section, we propose an identification design to study how systematic monetary policy
in the U.S. shapes the propagation of macroeconomic shocks. Our identification design relies
on three crucial elements: (i) a measure of systematic monetary policy, (ii) an instrument for
systematic monetary policy, and (iii) a state-dependent local projection regression that combines
(i) and (ii) to tackle the identification challenge discussed in the preceding section.
3.1 Hawk-Dove balance in the FOMC
In the following, we build on the classification of Federal Open Market Committee (FOMC)
members into hawks and doves by Istrefi (2019) and argue that the Hawk-Dove balance captures
ECB Working Paper Series No 2851
10

well variation in systematic monetary policy over time.
The FOMC. The FOMC is the committee of the Federal Reserve that sets U.S. monetary
policy. The FOMC consists of 12 members: the seven members of the Board of Governors of
the Federal Reserve System, including the Federal Reserve Chair, the president of the Federal
Reserve Bank (FRB) of New York, and four of the remaining 11 FRB presidents, who serve
one-year terms on a rotating basis. The seven FRB presidents temporarily without FOMC
membership participate in the FOMC meetings as non-voters.
Individual policy preferences. To measure the policy preferences of FOMC members we
use the Istrefi (2019) classification of FOMC members as hawks and doves, for the period 1960-
2023.
11
Underlying this classification are more than 20,000 real-time media articles from over
30 newspapers and business reports of Fed watchers (available in news archives like ProQuest
Historical Newspapers and Factiva) mentioning individual FOMC members. Istrefi (2019) uses
these articles to categorize individual FOMC members as hawks or doves for each FOMC
meeting based on the news information available up until the meeting. So, the Hawk-Dove
classification is a panel that tracks FOMC members over time, at FOMC meeting frequency.
Hawks are perceived to be more concerned with inflation, while doves are more concerned with
employment and growth.
12
Through the lens of our model in Section 2, we can think about
hawks as preferring a larger inflation coefficient ϕ
t
than doves. However, the Hawk-Dove clas-
sification we use is not tied to assuming a specific policy rule.
Overall, 129 of the 147 FOMC members between 1960 and 2023 are classified as hawk or dove.
The news coverage for the remaining 18 members does not allow classification (as hawk or dove)
for any meeting, as some served in the early 1960s with sparse media coverage and others are
very recent appointments in the FOMC. The majority (95) of the classified FOMC members
are consistently hawks or doves over time while the rest switches camps at least once. Swings
are equally split in either direction and quite uniformly distributed over time. On average, the
34 swinging FOMC members switch camps at only 1.8% of the member-meeting pairs.
While true policy preferences are unobserved, Istrefi (2019) shows that perceived preferences
match well with policy tendencies that are unknown in real-time to the public, as expressed
by preferred interest rates, with forecasting patterns of individual FOMC members, and with
dissents. In addition, Bordo and Istrefi (2023) show that the FOMC members’ educational
background, e.g., whether they graduated from a university related to the Chicago school of
economics, and early life experience, i.e., whether they grew up during the Great Depression,
predicts the Hawk-Dove classification. The long lasting effect of the early life experience in the
formation of policy preferences is consistent with the very few swings in our sample.
11
The data in Istrefi (2019) covers 1960 through 2014. The data is currently extended up to the first meeting
of 2023. Thus, our sample covers all 634 (scheduled) FOMC meetings between 1960 and 2023.
12
A typical example of a newspaper quote used to categorize a hawk reads: “Volcker leans toward tight-money
policies and high interest rates to retard inflation”, New York Times, 2 May 1975. For a dove: “The weakness
of Treasury prices and higher yields was seen reflecting the view that Bernanke will be ‘pro-growth’ and perhaps
less hawkish on inflation, said John Roberts, managing director at Barclays Capital in New York”, Dow Jones
Capital Markets Report, 24 October 2005.
ECB Working Paper Series No 2851
11

Aggregate Hawk-Dove balance. To measure variation in systematic monetary policy over
time, we aggregate the cross-section of individual FOMC member preferences into an aggregate
Hawk-Dove balance for each meeting (cf. Istrefi, 2019). We do so because the nature of monetary
policy-making by committee involves the aggregation of diverse individual policy preferences in
a collective decision.
13
We adopt a symmetric numerical scale for the qualitative Hawk-Dove
classification in order to aggregate the preferences. We define Hawk
iτ
as the policy preference
of FOMC member i at FOMC meeting τ :
Hawk
iτ
=
+1 Consistent hawk
+
1
2
Swinging hawk
±0 Preference unknown
−
1
2
Swinging dove
−1 Consistent dove
(3.1)
A consistent hawk is an FOMC member that has not been categorized as a dove in the past.
In contrast, a swinging hawk has been a dove at some point in the past. The definition of a
consistent dove and a swinging dove is analogous. We assign a lower weight to swingers as they
are often perceived as ‘middle-of-the-roaders’ with more moderate leanings to the hawkish or
dovish side (Istrefi, 2019).
14
Finally, we assign Hawk
iτ
= 0 when the policy preference of the
FOMC member is (yet) unknown.
We next aggregate the individual policy preferences in (3.1). We compute the aggregate Hawk-
Dove balance by
Hawk
τ
=
1
|M
τ
|
X
i∈M
τ
Hawk
iτ
(3.2)
where M
τ
denotes the set of FOMC members at meeting τ. A full FOMC consists of |M
τ
| = 12
members but |M
τ
| is occasionally below 12 because of absent members or vacant positions.
15
The Hawk-Dove balance in (3.2) is the arithmetic average across individual preferences. This
is our baseline aggregation of the Hawk-Dove balance in the FOMC and conforms well with the
consensual mode in which the FOMC typically operates.
1617
In Section 4.5, we show that our
13
Relatedly, Blinder (1999) writes: While serving on the FOMC, I was vividly reminded of a few things all of
us probably know about committees: that they laboriously aggregate individual preferences; that they need to be led;
that they tend to adopt compromise positions on difficult questions; and–perhaps because of all of the above–that
they tend to be inertial.
14
Our empirical findings are robust to not distinguishing between consistent and swinging preferences, see
Section 4.5.
15
When a substitute temporarily replaces an absent FOMC member, we assume the substitute acts in the
interest of the original FOMC member and assign the same policy preference, see Appendix B for details. This
assumption affects less than one percent of all observations and is not important for our results.
16
Riboni and Ruge-Murcia (2010) argue that a consensus model fits actual policy decisions of the Federal
Reserve. In addition, Riboni and Ruge-Murcia (2022) provide evidence suggesting that policy proposals of the
Fed Chair are the result of a compromise, reflecting a balance of power within the FOMC.
17
Cieslak et al. (2022) construct a Hawk-Dove score based on the language in FOMC meeting transcripts.
In contrast to our measure which captures FOMC members preferences about monetary policy, their measure
captures (a hawkish or dovish) sentiment on current direction of policy changes. Furthermore, Ferguson et al.
(2023) classify central bank governors in 80 countries as hawks and doves, with respect to financial sector support,
for the periods preceding banking crises.
ECB Working Paper Series No 2851
12

Figure 2: Hawk-Dove balance in the FOMC
Notes: The solid red line shows the quarterly time series of the aggregate Hawk-Dove balance of the FOMC
(Hawk
t
) from 1960 until 2023. The dashed red line shows the aggregate Hawk-Dove balance of the subgroup
of rotating FRB presidents with voting right in period t, the FOMC rotation instrument (Hawk
IV
t
). Grey
bars indicate NBER dated recessions.
empirical findings are robust to alternatively using the median of preferences or putting a higher
weight on the Fed Chair’s preference. Finally, we aggregate Hawk
τ
from meeting frequency to
quarterly frequency. We compute the Hawk-Dove balance Hawk
t
for quarter t as the average
balance in the first month of the quarter. If the first month is without a meeting, we use the
first preceding month with a meeting.
We present the evolution of the Hawk-Dove balance from 1960 to 2023 as the solid line in
Figure 2. There is considerable variation in this balance, featuring both hawkish and dovish
majorities. The variation reflects the turnover of rotating FOMC members, the turnover of non-
rotating FOMC members, and changes in policy preferences of incumbent FOMC members. We
discuss the importance of these components for Hawk
t
fluctuations in Subsection 3.2.
Systematic monetary policy. The aggregate Hawk-Dove balance Hawk
t
represents our
measure of systematic U.S. monetary policy. It accounts for the diversity of views within
the FOMC on how policy should be adjusted to promote both, price stability and maximum
employment. This diversity is usually expressed in FOMC meetings through different forecasts
of individual members, through dissents, and in public through speeches. While the Fed’s
response to macroeconomic shocks is more sophisticated and depends on various economic
factors, we argue that our Hawk-Dove balance matches well with narratives of monetary policy
in the U.S. (Istrefi, 2019). For example, the dovish leaning of Hawk
t
in the mid-1960s coincides
with a period of delays and hesitation from the FOMC to take anti-inflationary action (Meltzer,
2005). The hawkish majorities in the 1970s might be surprising given the high inflation rates
in this period. Yet it is consistent with monetary policy being misguided by an underestimated
ECB Working Paper Series No 2851
13

natural rate of unemployment (DeLong, 1997; Romer and Romer, 2002) and persistence of
inflation (Primiceri, 2006). In particular, Orphanides (2004) argues that for the periods before
and after Paul Volcker’s appointment in 1979, policy was broadly similar and consistent with
a strong reaction to Greenbook inflation forecasts.
18
During the 1980s, the perception of a
less hawkish FOMC reflects nominations of dovish Board members by President Reagan. In
addition, it is consistent with the imperfect credibility of hawkish policy during the Volcker
disinflation, as observed in persistently elevated long-term interest rates (indicative of inflation
expectations) in this period (Goodfriend and King, 2005). Overall, this suggests that the Hawk-
Dove balance captures important aspects of the Fed’s systematic policy-making.
Our approach of measuring systematic policy via Hawk
t
has several advantages to alternative
approaches such as calibrating or estimating policy rules (e.g., Clarida et al., 2000; Bauer et al.,
2022). Importantly, we do not have to specify a particular reaction function, nor do we need to
restrict the analysis to specific policy instruments or communication strategies.
19
We further
avoid the well-known identification issues that plague the estimation of monetary policy rules
(Cochrane, 2011; Carvalho et al., 2021). Independently of the policy tool or policy rule, our
measure reflects the aggressiveness of the FOMC towards fulfilling one or the other leg of
the dual mandate. In addition, the Hawk-Dove balance reflects public beliefs, in real-time,
about monetary policymakers. In contrast, ex-post estimates of systematic monetary policy
may inadvertently use ex-post information not available at the time of the policy decision,
potentially giving rise to misleading conclusions (Orphanides, 2003).
Comparability over time. A potential concern with the classification of FOMC members
into hawks and doves is that the meaning of being a hawk or dove might have changed over
time. We argue this is likely no major concern. First, Istrefi (2019) has classified each member
as a hawk or dove based on a common and time-invariant definition, that is the policy leaning
with regard to the dual mandate of the Fed: maximum employment and stable prices. Second,
given that preferences tend to be stable, we would expect many swings whenever the meaning of
hawks or doves changes. However, swings in measured preferences are rare suggesting that the
meaning of being a hawk or dove is relatively stable over time. Third, the fact that we observe
large and persistent fluctuations in Hawk
t
is incompatible with the Hawk-Dove classification
being a relative ranking, according to which hawks are those FOMC members which are more
hawkish than the contemporaneous average policy preference among FOMC members, and
analogously for doves. Finally, in a robustness exercise in Section 4, we show that our results
are robust to using an alternative Hawk-Dove balance which accounts for potential trends in
the meaning of hawks and doves.
Relation to monetary policy shocks. Empirically identified monetary policy shocks are
often considered to reflect changes in central bank preferences (Christiano et al., 1999; Ramey,
18
Moreover, Orphanides (2003) shows that a dovish Taylor rule with a sufficiently large weight on the output
gap would have resulted in substantially higher inflation.
19
For a summary of alternative policy rules that the FOMC consults, see here:
https://www.federalreserve.gov/monetarypolicy/policy-rules-and-how-policymakers-use-them.htm. Policy
instruments have been changing over our sample, from targeting monetary aggregates to targeting the Fed Funds
rate, conducting balance sheets policy, and through forward guidance communication.
ECB Working Paper Series No 2851
14

2016). Hence, they may be related to the Hawk-Dove balance, our measure of systematic mone-
tary policy. In Appendix D, we characterize this relationship based on the Romer and Romer
(2004) identification strategy of monetary policy shocks. Because their identification strategy
assumes a time-invariant policy rule, the identified monetary policy shocks may indeed capture
time variation in systematic monetary policy. However, the relationship between identified
monetary policy shocks and systematic monetary policy is non-linear and also depends on the
state of the economy (e.g., the inflation rate). Instead, our Hawk-Dove balance provides a
cleaner measure of systematic monetary policy.
3.2 FOMC Rotation Instrument
We next propose and discuss a novel FOMC rotation instrument that allows us to identify the
effects of systematic monetary policy, even if monetary policy is endogenous to the state of the
economy (cf. Section 2).
Potential endogeneity. Systematic monetary policy may change depending on the state of
the economy. For example, the Federal Reserve may become more dovish in response to high
unemployment, or more hawkish in response to high inflation (cf. Davig and Leeper, 2007).
More fundamentally, some FOMC members may become hawkish or new appointments may
increase the number of hawks in the FOMC. Changes in individual policy preferences could be
intrinsic responses to changes in the macroeconomic environment. They could also be driven by
external pressure from lobbies or the government. Relatedly, Abrams (2006) and Abrams and
Butkiewicz (2012) document the influence of the Nixon administration on the FOMC in the
period leading up to the 1972 election. In addition, which type of central banker gets appointed
may depend on the state of the economy. In this context, note that members of the Board of
Governors and the Fed Chair require a nomination from the U.S. President for their first and
any subsequent term. This may render both extensive margin and intensive margin changes in
the Hawk-Dove balance endogenous.
FOMC rotation instrument. To address the endogeneity of the Hawk-Dove balance we
propose an instrument which leverages exogenous variation in Hawk
t
that arises from the
annual FOMC rotation. Each year, four FOMC memberships rotate among eleven FRB pres-
idents following a mechanical scheme that has been in place since the early 1940s. According
to the scheme, some FRB presidents become FOMC members every second year (Cleveland
and Chicago) and others every third year (Philadelphia, Richmond, Boston, Dallas, Atlanta,
St. Louis, Minneapolis, San Francisco and Kansas City). As the rotation of voting rights is
independent of the state of the economy, it induces exogenous variation in Hawk
t
. To leverage
the variation from the FOMC rotation we propose a novel instrument, which we refer to as
FOMC rotation instrument. Formally, the instrument is given by
Hawk
IV
τ
=
1
|R
τ
|
X
i∈R
τ
Hawk
iτ
, (3.3)
ECB Working Paper Series No 2851
15

where R
τ
denotes the set of rotating FOMC members at FOMC meeting τ. A full set of rotating
members consists of |R
τ
| = 4 members.
20
We aggregate the FOMC rotation instrument to
quarterly frequency analogously to the Hawk-Dove balance.
In Figure 2, the dashed line presents the FOMC rotation instrument over time. On average, the
rotating presidents are more hawkish than the overall FOMC Hawk-Dove balance, reflecting the
fact that FRB presidents tend to be more hawkish than governors (Chappell et al., 2005; Istrefi,
2019; Bordo and Istrefi, 2023). Both series display sizable variation over time, but fluctuations
in the instrument Hawk
IV
t
are more short-lived, with a year-over-year autocorrelation of 0.20
compared to 0.66 for Hawk
t
, see Table 1.
Table 1: Summary statistics
Mean Median SD Autocorr Corr Min Max T
Hawk
t
0.04 0.09 0.35 0.66 - -0.80 0.67 253
Hawk
IV
t
0.28 0.33 0.45 0.20 0.64 -0.75 1.00 253
Notes: Summary statistics for the quarterly time series from 1960 until 2023. Hawk
t
is the average Hawk-
Dove balance of the FOMC. Hawk
IV
t
is the FOMC rotation instrument. Autocorr refers to the year-over-year
first-order autocorrelation. Corr refers to the correlation with Hawk
t
.
Relevance of instrument. Our instrument Hawk
IV
t
aggregates the policy preferences of one-
third of the FOMC members, capturing a significant part of the variation in the overall Hawk-
Dove balance Hawk
t
. In fact, the correlation between Hawk
t
and Hawk
IV
t
is 0.64. Formal
weak instrument tests require a fully specified regression model and are therefore delegated to
Section 4. However, we can estimate a stylized first-stage regression to study the explanatory
power of the FOMC rotation instrument. We regress Hawk
t
on Hawk
IV
t
and a constant. This
regression has an R
2
of 0.41 and an effective F-statistic (Montiel Olea and Pflueger, 2013)
for joint significance of 46.13, well above the common threshold of 10 for weak instruments
(Andrews et al., 2019).
We further provide a decomposition of Hawk
t
into intensive margin changes of incumbent
FOMC members’ policy preferences and extensive margin changes in the composition of the
FOMC due to entry and exit, see Appendix C for details. We find that extensive margin
changes in the FOMC composition due to the rotation account for 53% of the variance in yearly
changes of Hawk
t
. The turnover of non-rotating FOMC members accounts for another quarter
of the variance, and the remainder is due to preference changes of incumbent FOMC members
and various covariance terms. Both the first-stage regression and the variance decomposition
strongly suggest that our instrument is relevant for Hawk
t
.
Finally, the rotation is considered important by Fed watchers in the media. Each year before
the rotation, they discuss its implications for monetary policy. A typical media discussion, here
an article in The New York Times from January 1, 2011, reads as follows:
20
In our sample, |R
τ
| = 4 for 625 out of 634 FOMC meetings and |R
τ
| = 3 for the remaining nine meetings
because of an absent member.
ECB Working Paper Series No 2851
16

As the Federal Reserve debates whether to scale back, continue or expand its $600
billion effort to nurse the economic recovery, four men will have a newly prominent
role in influencing the central bank’s path. The four men are presidents of regional
Fed banks, and under an arcane system that dates to the Depression, they will become
voting members in 2011 on the Federal Open Market Committee, [...] the change
in voting composition is likely to give the committee a somewhat more hawkish cast.
This could amplify anxieties about unforeseen effects of Bernanke’s policies [...]. Two
of the four new voters are viewed as hawkish on inflation, meaning that they tend
to be more worried about unleashing future inflation than they are about reducing
unemployment in the short run.
Exogeneity of instrument. We next argue that variation in Hawk
IV
t
is quasi-exogenous.
First, the rotation scheme is mechanical and time-invariant and therefore unrelated to the state
of the economy. Second, new appointments of FRB presidents are relatively infrequent and
unlikely to be influenced by the federal government. FRB presidents are appointed by the
Board of Directors of the respective Federal Reserve district. The directors are to represent
the broader public and financial institutions located in the district. In contrast, members of
the Board of Governors (including the Fed Chair) are nominated by the U.S. president and
confirmed by the Senate. Furthermore, the average tenure of an FRB president is eleven years
but only seven years for a governor in our sample. Relatedly, Bordo and Istrefi (2023) show that
different from governors, there is no correlation between the preferences of the FRB presidents
and the U.S. president’s party at the time of their appointment. In addition, some regional
FRBs have persistent leanings toward either the dovish or the hawkish camp. For example, the
Cleveland FRB president is typically a hawk whereas the president of the San Francisco FRB
is typically a dove.
Third, swings of preferences are likely a negligible threat to the exogeneity of our instrument.
For rotating FOMC members, swings occur only in 1.3% of member-meetings pairs, and not all
swings are endogenous to the state of the economy.
21
In addition, we find that swings account
for a negligible fraction of the variance of the rotation instrument. In particular, we decompose
Hawk
IV
t
into intensive margin changes of preferences (swings) and extensive margin changes
of the composition of rotating FOMC members due to either the rotation or appointments,
see Appendix C for details. The rotation accounts for 93% of the variance in yearly changes
of Hawk
IV
t
, appointments for 8% and swings for 1%.
22
Fourth, Hawk
IV
t
displays relatively
short-lived time series fluctuations that are unlikely to be correlated with slow-moving macroe-
conomic trends, such as increasing market power, female labor force participation, and various
technological innovations. Similarly, Hawk
IV
t
is uncorrelated with business cycle fluctuations.
For example, the correlation between Hawk
IV
t
and yearly real GDP growth is -0.02 and statis-
tically insignificant. In contrast, the correlation between Hawk
t
and GDP growth is 0.15 and
21
Bordo and Istrefi (2023) discuss three major swing waves in the FOMC during 1960-2014. The first wave is
a hawkish wave influenced by inflation dynamics in the late 1960s to early 1970s. The second wave is a hawkish
swing in the early 1990s, related to the discussion on inflation targeting inspired by the announcements of the
Reserve Bank of New Zealand and Bank of Canada. Finally, the third swing wave is a dovish one in the late
1990s, following a new understanding of the economy.
22
Our empirical results are robust to excluding swingers from our instrumental variable, see Section 4.5.
ECB Working Paper Series No 2851
17

significant at the 5% level.
Overall, the above arguments support the validity of our FOMC rotation instrument for iden-
tifying the causal effects of systematic monetary policy. To the best of our knowledge, this
paper is the first to propose an instrument for systematic monetary policy. We believe this is a
substantial contribution to the literature which opens up myriad research questions.
A validation exercise for Hawk
t
and Hawk
IV
t
. Given our definition of hawkish policy
makers and conventional wisdom about hawkish monetary policy, we should expect a hawkish
FOMC to respond more aggressively to inflation. As validation exercise, we empirically test
this correlation via a dynamic Taylor rule regression. We use Hawk
IV
t
as instrument in a
local projection of the federal funds rate on the Greenbook inflation forecast interacted with
Hawk
t
. We find that a hawkish FOMC indeed raises the federal funds rate significantly more
aggressively in the presence of higher inflation forecasts. For more details on the exercise, the
results, and a weak instrument test, see Appendix E. Overall, this exercise suggests that Hawk
t
and Hawk
IV
t
capture important variation in systematic monetary policy.
3.3 Local projection framework
Finally, we propose to combine Hawk
t
and Hawk
IV
t
in a state-dependent local projection
framework that permits causal identification of how systematic monetary policy shapes the
propagation of various macroeconomic shocks. The setup of the local projection is consistent
with the New Keynesian model discussed in Section 2.
We regress an outcome variable of interest, x
t+h
, on a macroeconomic shock of interest, ε
s
t
, the
interaction of the shock with the Hawk-Dove balance Hawk
t
, as well as Hawk
t
in levels and a
vector of additional control variables Z
t
. Formally,
x
t+h
= α
h
+ β
h
ε
s
t
+ γ
h
ε
s
t
(Hawk
t
− Hawk) + δ
h
(Hawk
t
− Hawk) + ζ
h
Z
t
+ v
h
t+h
, (3.4)
for h = 0, . . . , H forecast horizons. Hawk denotes the arithmetic sample mean of Hawk
t
. To
address the potential endogeneity of Hawk
t
, we use the instrument vector
q
t
=
h
1, ε
s
t
, ε
s
t
Hawk
IV
t
− Hawk
IV
,
Hawk
IV
t
− Hawk
IV
, Z
t
i
(3.5)
for the regressors in (3.4). The two key coefficients in (3.4) are β
h
and γ
h
, which capture the
average response, when the Hawk-Dove balance of the FOMC is at its sample average, and
the differential response, when the FOMC is more or less hawkish than the sample average.
Based on Section 2, the IV estimator is consistent if the instrument Hawk
IV
t
is orthogonal to
all macroeconomic shocks (both observed shocks ε
s
t
and other unobserved shocks) at all lags
and leads. In the next section, we discuss whether the identifying assumptions are satisfied in
the context of a government spending shock.
In general, this framework can be used to study the propagation of any shock through systematic
U.S. monetary policy. Our framework permits revisiting a range of important empirical ques-
tions, such as the role of systematic monetary policy for the effects of oil-related shocks (e.g.,
Bernanke et al., 1997; Kilian and Lewis, 2011), technology shocks (e.g., Galí et al., 2003), news
ECB Working Paper Series No 2851
18

shocks (e.g., Barsky and Sims, 2011), fiscal spending shocks (e.g., Ramey and Zubairy, 2018),
and tax shocks (e.g., Romer and Romer, 2010). Moreover, our framework allows the estimation
of a new set of moments that can be used to discipline structural models with time variation
in systematic monetary policy, such as regime-switching models (e.g., Davig and Leeper, 2007;
Bianchi, 2013; Bianchi and Ilut, 2017).
4 Government spending and monetary policy
In this section, we use our identification design to estimate how the effects of U.S. government
spending shocks depend on systematic monetary policy. We find that a hawkish FOMC signif-
icantly dampens the expansionary effects of increased government spending on GDP, while
a dovish FOMC supports it. Relatedly, we find sizeable differences in the fiscal multiplier
depending on the hawkishness or dovishness of the FOMC. We further provide evidence on the
strength of our instrument, and perform an extensive sensitivity analysis considering alternative
Hawk-Dove balances, an alternative spending shock, varying sample periods, and the inclusion
of additional control variables.
4.1 Data and identifying assumptions
We next discuss the data (in addition to Hawk
t
and Hawk
IV
t
) and the identifying assumptions
for our analysis of government spending shocks.
Variables. We first specify the local projection framework (3.4)-(3.5). Our baseline shock of
interest, ε
s
t
in (3.4), is the military spending shock constructed by Ramey (2011) and Ramey
and Zubairy (2018), based on a narrative approach to identify surprise build-ups (or build-
downs) in U.S. military spending. The shock is constructed as the present value of expected
changes in real defense spending over the next years, typically up to a horizon of five years,
and expressed relative to real potential GDP. The two outcome variables of interest, x
t+h
in
(3.4), are real GDP and real government spending, both expressed relative to real potential
GDP.
23
Finally, the vector of control variables, Z
t
in (3.4), includes four lags of real GDP and
real government spending, both relative to potential output and four lags of the fiscal spending
shock. If we restrict γ
h
= δ
h
= 0, our specification of (3.4) corresponds to equation (1) of
Ramey and Zubairy (2018). This facilitates the comparability of our results with the literature.
Sample. Our baseline sample covers the period from 1960Q1 to 2014Q4, which is the longest
possible sample for which the Hawk-Dove balance and the fiscal spending shocks are available.
Our sample includes important military spending shocks, e.g., the Vietnam War, the Carter-
Reagan military buildup, and 9/11. On the other hand, our sample excludes WWII and the
Korean War which are important events in Ramey (2011) and Ramey and Zubairy (2018).
24
In
23
Detrending by potential GDP is the so-called Gordon and Krenn (2010) transformation. Compared to using
log variables, this avoids using an ex-post multiplication with the GDP/G ratio, which substantially varies over
time, to obtain the fiscal spending multiplier.
24
Ramey (2011) shows that excluding the Korean War renders military spending shocks a weak instrument
for contemporaneous government spending. In general, it is not surprising that military spending shocks are a
ECB Working Paper Series No 2851
19

the context of studying the response of monetary policy to fiscal spending shocks, however, it
may be desirable to exclude these events because monetary policy was less autonomous from
fiscal policy prior to the Treasury-Fed Accord in 1951. Between 1942 and 1951, the Fed was
constrained to support government bond prices by pegging short-term interest rates.
Identifying assumptions. Two key identifying assumptions are necessary for the causal
interpretation of the estimates of β
h
and γ
h
in (3.4).
The first assumption is that military spending shocks are random shocks. In particular,
the distribution of military spending shocks does not depend on systematic monetary policy.
According to Ramey and Shapiro (1998) and Ramey and Zubairy (2018), military spending
shocks are unanticipated changes in spending plans triggered by geopolitical events and are
therefore exogenous to the economy. This argument similarly applies when conditioning on
systematic monetary policy. We provide three additional arguments as to why the military
spending shocks are independent of systematic monetary policy: (i) the response of military
spending to the shock does not depend on systematic monetary policy, see Section 5.2; (ii)
the news quotes used to construct military spending shocks as described in the supplementary
appendix to Ramey and Zubairy (2018) do not mention monetary policy, the Federal Reserve,
or the FOMC for our sample; and (iii) the Hawk-Dove balance does not predict future spending
shocks. The specific concern the last point addresses is that military spending shocks might be
timed to episodes with a more dovish FOMC. To test this concern we regress future military
spending shocks on Hawk
t
and use Hawk
IV
t
as an instrument. We find no significant effects of
the Hawk-Dove balance on contemporaneous or future military spending shocks, see Figure G.1
in Appendix H. If anything, we find expansionary shocks when the FOMC is hawkish, inconsis-
tent with the timing hypothesis above.
The second assumption is that the FOMC rotation instrument is orthogonal to other macroe-
conomic shocks at all leads and lags. This is plausible for various reasons as discussed in
Section 3.2. More specifically, given that fluctuations in Hawk
IV
t
are relatively short-lived and
uncorrelated with real GDP growth, it is unlikely that our estimates capture differences in the
response across booms and busts (e.g., Auerbach and Gorodnichenko, 2012; Ramey and Zubairy,
2018). It is similarly unlikely that Hawk
IV
t
correlates with changes in systematic fiscal policy,
which tends to be persistent.
4.2 GDP and government spending
We next present our empirical estimates of the causal effects of systematic monetary policy on
the responses of real GDP and real government spending to fiscal spending shocks. We find
that expansionary spending shocks raise GDP significantly more strongly when the FOMC is
more dovish.
Baseline IV estimates. Figure 3 shows the responses of real GDP and real government
spending (G) to a military spending shock conditional on systematic monetary policy (Hawk
t
).
weak instrument for contemporaneous government spending because the shocks largely pertain to future spending.
Therefore, we do not use military spending shocks as an instrument but as shocks in our local projection framework
(3.4) and find a significant dynamic government spending response, see Section 4.2.
ECB Working Paper Series No 2851
20

Figure 3: Responses to spending shocks conditional on monetary policy
(a) Average GDP (β
h
) (b) Average G (β
h
)
(c) Differential GDP (γ
h
) (d) Differential G (γ
h
)
(e) State-dependent GDP (β
h
± γ
h
) (f) State-dependent G (β
h
± γ
h
)
Notes: The figure shows responses of real GDP and real government spending (G) to an expansionary military spending
shock, corresponding to one percent of GDP, conditional on systematic monetary policy (Hawk
t
). We show IV estimates
based on the local projection framework (3.4)-(3.5) as specified in Section 4.1. The β
h
captures the responses when Hawk
t
equals its sample average. The γ
h
captures the differential responses when Hawk
t
exceeds the sample average by two
hawks. The β
h
± γ
h
shows the state-dependent responses when Hawk
t
exceeds the sample average either by two hawks
(+2 Hawks) or by two doves (+2 Doves). The shaded areas indicate 68% and 95% confidence bands using Newey-West
standard errors.
The estimates are based on the local projection framework (3.4)-(3.5) as specified in Section 4.1.
The solid lines show the point estimates and the shaded areas indicate 68% and 95% confidence
ECB Working Paper Series No 2851
21

bands using Newey-West standard errors.
25
All estimates of β
h
and γ
h
are normalized to
correspond to an expansionary shock that raises the expected present discounted value of future
military spending by one percent of GDP.
26
Panels (a) and (b) show the IV estimates of β
h
for GDP and G, which capture the responses
when Hawk
t
equals its sample average. The average responses of both GDP and G are positive
and significantly different from zero at most horizons beyond the first year. Both responses
build up gradually and exceed 0.15% for GDP and 0.11% for G after one year.
Panels (c) and (d) show the estimates of γ
h
, which capture the differential responses of GDP
and G when the FOMC exceeds the average Hawk-Dove balance by two hawks. Specifically, γ
h
is scaled to capture an increase in (Hawk
t
− Hawk) of 2/12. This means, for example, that
two FOMC members with unknown preferences are replaced by two consistent hawks, or that
two FOMC members swing from dovish to hawkish. An increase in Hawk
t
by 2/12 exceeds
one standard deviation of the change in Hawk
t
which is 0.15. Importantly, the GDP response
is lower after a fiscal expansion when the FOMC is more hawkish. This effect is statistically
significant at the 5% level until three years after the shock. The estimated magnitudes are
sizeable. Between two and three years after the shock the GDP response is more than 0.4%
lower under a more hawkish FOMC. Conversely, the GDP response is 0.4% higher when there
are two more doves in the FOMC. The differential response of government spending (G) is also
negative at horizons until three years after the shock, albeit smaller in absolute terms and less
significant. In Section 5.2, we show that the differential G response is driven by non-military
spending, whereas we find no meaningful differential effect for military spending.
Panels (e) and (f) of Figure 3 show β
h
± γ
h
, the state-dependent responses when Hawk
t
exceeds the sample average either by two hawks (+2 Hawks) or by two doves (+2 Doves). The
GDP response strongly varies between the dovish and the hawkish FOMC. The dovish FOMC
supports the GDP expansion while the hawkish FOMC undoes the GDP expansion. Quantita-
tively, GDP increases by up to 0.68% under the dovish FOMC, but falls by up to 0.35% under
the hawkish FOMC. The former response is highly statistically significant, whereas the latter
response is less precisely estimated.
Overall, our evidence suggests that monetary offset of fiscal spending shocks is not a constant
feature of monetary policy but varies strongly with the Hawk-Dove balance in the FOMC.
In contrast to the GDP response, government spending displays smaller and less significant
differences in the state-dependent responses.
Comparison with OLS. We compare our IV estimates presented above with the OLS coun-
terparts. Figure 4 shows the OLS and IV estimates of cumulative GDP responses to a military
shock as a function of the FOMC’s Hawk-Dove balance. At horizons of around one year, the
OLS estimates substantially understate the dependence of the GDP response on the Hawk-Dove
balance. In contrast, at long horizons of around four years, the OLS bias seems negligible.
27
25
For the Newey-West standard errors, we set the bandwidth to h + 1, where h is the horizon in (3.4). A
truncation parameter rule (Lazarus et al., 2018) or automatic bandwidth selection leads to similar results.
26
Normalizing the responses to a shock size of 1% of GDP approximately normalizes to one standard deviation
of the shock series, which is 1.17% of GDP.
27
Figure G.3 in the Appendix presents the cumulated responses at intermediate horizons of two and three
years. Figure G.2 presents the OLS estimates of β
h
and γ
h
.
ECB Working Paper Series No 2851
22

Figure 4: Cumulative GDP responses for OLS and IV
(a) 1-year response (b) 4-year response
Notes: The figure shows the cumulative real GDP response to an expansionary military spending shock, corresponding to
one percent of GDP, conditional on systematic monetary policy (Hawk
t
). We show IV and OLS estimates based on the
local projection framework (3.4)-(3.5) as specified in Section 4.1. The displayed estimates are computed as
P
H
h=0
[β
h
+
γ
h
(Hawk
t
− Hawk
t
)] for H = 4 quarters (Panel a) and H = 16 quarters (Panel b).
This comparison suggests that ignoring the endogeneity of Hawk
t
leads to biased conclusions
about the role of systematic monetary policy for fiscal spending shocks.
4.3 Weak instruments
A common concern with IV estimates is the strength of the instrument. We provide evidence
supporting the strength of our instruments, including weak instrument tests and weak instrument-
robust inference, reinforcing the contribution of our identification design.
First-stage results. Our local projection framework (3.4) contains two endogenous regres-
sors, ε
s
t
(Hawk
t
− Hawk) and (Hawk
t
− Hawk). The estimates of the two associated first-stage
regressions are shown in Table G.1 in the Appendix. We find that the instrumental variable
ε
s
t
(Hawk
IV
t
− Hawk
IV
) has a positive effect on the endogenous variable ε
s
t
(Hawk
t
− Hawk)
and is significant at the one percent level. Similarly, (Hawk
IV
t
− Hawk
IV
) has a positive and
highly significant effect on (Hawk
t
− Hawk). In both regressions, the R
2
increases by about 0.4
when including the instruments as regressors and we also find large jumps up in the associated
Kleibergen-Paap F-statistics. Taken together, this suggests that our instruments are strong
(Bound et al., 1995).
Weak instrument tests. We further use three statistical tests to assess the strength of our
instrument more formally. First, we use the Montiel Olea and Pflueger (2013) test of weak
instruments, which is popular in time series settings because it is robust to autocorrelation
and heteroskedasticity. Formally, we test whether the relative weak instrument bias for the IV
estimates of γ
h
exceeds 10%, 20%, or 30%.
28
Panel (a) of Figure 5 shows the p-values of the
28
We apply the test to γ
h
because it is our main coefficient of interest (together with β
h
), and because the
Montiel Olea and Pflueger (2013) test can only be applied to a single endogenous regressor. For the other
endogenous regressor, (Hawk
t
− Hawk) in levels, we estimate the first stage separately and plug in the fitted
values in the second stage used to test the interaction term. If we alternatively replace Hawk
t
level term by
ECB Working Paper Series No 2851
23

Figure 5: Weak instrument tests
(a) Montiel Olea and Pflueger (2013) (b) Lewis and Mertens (2022)
Notes: The figure shows p-values for rejecting the null of weak instruments for the responses of real GDP, based on the
local projection framework (3.4)-(3.5) as specified in Section 4.1. The Montiel Olea and Pflueger (2013) test evaluates the
null of the bias in γ
h
exceeding a threshold τ. Similarly, the Lewis and Mertens (2022) test evaluates the null of the ℓ
2
norm of the bias in γ
h
and δ
h
exceeding a threshold τ . For the former, the endogenous regressor Hawk
t
is not tested
but directly replaced by its first stage fitted value. The critical values and associated p-values are based on Newey-West
standard errors.
weak instrument tests for the differential GDP response. At all horizons, even a relatively small
10% bias (τ = 0.1) can be rejected at significance levels below 2%.
The second weak instrument test we apply was recently developed by Lewis and Mertens (2022)
and generalizes Montiel Olea and Pflueger (2013) to allow for multiple endogenous regressors.
We apply this test to jointly evaluate whether the average relative bias across γ
h
and δ
h
exceeds
some threshold τ and report the results in Panel (b) of Figure 5. A small average bias of 10%
can be rejected at significance levels below 10% for most horizons. Moreover, we can reject a
bias of 20% at the two percent level for all horizons. For government spending, both tests lead
to the same conclusion, see Figure G.4 in Appendix G.
Lastly, we test for weak instruments via the reduced form of our regression framework. Following
Chernozhukov and Hansen (2008), the hypothesis test of the reduced form estimates of γ
h
against zero is equivalent to testing whether the instrument has zero relevance. Figure G.5 in
the Appendix shows that the reduced-form estimates for γ
h
are significant, as in Figure 3. To
summarize, all three tests indicate that our instruments are not weak.
Weak instrument-robust inference. To address residual concerns about instrument strength,
we further provide inference that is robust to weak instruments and allows for multiple endoge-
nous regressors based on Andrews (2018). We find robust confidence sets for the differential
GDP and G responses similar to our baseline intervals, see Figure G.6 in the Appendix. This
provides additional support for the strength of our instruments.
4.4 Fiscal spending multiplier
A key object for the design and evaluation of fiscal policies is the fiscal spending multiplier. We
use our framework to estimate how the fiscal spending multiplier depends on the hawkishness
Hawk
IV
t
we obtain very similar results.
ECB Working Paper Series No 2851
24

of the FOMC. We find that a dovish FOMC leads to substantially larger multipliers, relative
to an average or a more hawkish FOMC composition.
Definition and estimation. The multiplier is defined as the dollar amount by which GDP
increases per dollar increase in fiscal spending (both in real terms). A common procedure is
to compute the multiplier as the cumulative response of GDP to a spending shock divided
by the cumulative response of government spending to the same shock over some horizons of
interest (e.g., Mountford and Uhlig, 2009; Ramey and Zubairy, 2018). To study how systematic
monetary policy shapes the fiscal multiplier, we define the monetary policy-dependent fiscal
multiplier as
F M
H
(χ) =
P
H
h=0
β
h
GDP
+ γ
h
GDP
χ
P
H
h=0
β
h
G
+ γ
h
G
χ
(4.1)
where H is the maximal considered forecast horizon, β
h
i
and γ
h
i
are the average and differential
responses of outcome i ∈ {GDP, G} to a spending shock, and χ indicates some level of the
Hawk-Dove balance in deviation from the sample mean (Hawk
t
− Hawk).
We estimate the cumulative average and differential responses,
P
H
h=0
β
h
i
and
P
H
h=0
γ
h
i
, in one
step by replacing the left-hand side of the local projection in (3.4) by the cumulative outcome
between h = 0 and H. Otherwise, we exactly follow Section 4.2 and use the specification of
the local projection framework in Section 4.1. We construct valid standard errors for F M
H
(χ)
by accounting for the covariance between the estimates in the numerator and denominator of
(4.1). Appendix F provides further details and a comparison of our multiplier estimation with
the approach in Ramey and Zubairy (2018).
Results. Table 2 presents the IV estimates of the fiscal spending multipliers F M
H
(χ) for
both a two-year and a four-year horizon. For an average Hawk-Dove balance, χ = 0, the
cumulative spending multiplier is 1.3 at both horizons, and significantly different from zero at
the 10% level. Analogous to Figure 3, we consider a range of χ from −2/12 to +2/12. As
the FOMC becomes more dovish than average, the multiplier increases from 1.3 to 2.3 for one
additional dove (χ = −1/12), and to 3 for two additional doves (χ = −2/12). The difference
between the average and the dovish multipliers are similar across the two horizons. Moreover,
the difference is statistically significant at the 5% level for the four-year horizon, see Table G.3
in Appendix G. Conversely, as the FOMC becomes more hawkish, the multiplier F M
H
(χ) drops
to zero or below and is insignificantly different from zero. The differences in F M
H
(χ) across χ
are mainly driven by differences in the cumulative GDP response rather than the G response.
The differences in the GDP response across χ are larger in magnitude and more significant, see
Table G.2. This result is analogous to the findings in Figure 3.
Comparison with linear model. We explicitly estimate how the fiscal spending multiplier
depends on systematic monetary policy, whereas much of the related literature has estimated a
single ‘average’ fiscal spending multiplier (e.g., Blanchard and Perotti, 2002; Ramey, 2016). To
compare our results with this tradition in the literature, we estimate an average fiscal spending
ECB Working Paper Series No 2851
25

Table 2: Government spending multipliers and monetary policy
Baseline model Linear
Outcome +2 Hawks +1 Hawk Average +1 Dove +2 Doves model
Two-year horizon
Multiplier -4.825 -0.476 1.348 2.351 2.986 0.860
(5.229) ( 1.418) (0.708) (0.934) (1.239) (1.427)
GDP (cum) -1.689 -0.282 1.124 2.531 3.937 0.616
(0.989) (0.768) (0.649) (0.689) (0.865) (1.057)
G (cum) 0.350 0.592 0.834 1.076 1.319 0.716
(0.250) (0.300) (0.395) (0.510) (0.634) (0.338)
Four-year horizon
Multiplier -1.790 -0.001 1.308 2.307 3.095 0.838
(2.637) (0.862) (0.475) (0.808) (1.162) (1.449)
GDP (cum) -2.735 -0.002 2.731 5.465 8.198 1.494
(2.498) (1.557) (0.842) (1.045) (1.892) (2.747)
G (cum) 1.528 1.808 2.088 2.368 2.649 1.782
(1.010) (0.804) (0.734) (0.848) (1.079) (0.689)
Notes: The table shows IV estimates of the cumulative fiscal spending multipliers F M
H
(χ) in equation (4.1) for H = 8
(top panel) and H = 16 quarters (bottom panel), as well as the cumulative GDP response (numerator of F M
H
(χ)) and the
cumulative G response (denominator of F M
H
(χ)). The coefficients are estimated using a cumulative version of the local
projection framework (3.4)-(3.5) as specified in Section 4.1. For our baseline model, the columns present different states of
the Hawk-Dove balance between “+2 Hawks” (χ = +2/12), “Average” (χ = 0), and “+2 Doves” (χ = −2/12). The linear
model in the last column presents the estimates when we restrict γ
h
= δ
h
= 0 in the local projection (3.4). Driscoll-Kraay
standard errors are in parenthesis, see Appendix F for details.
multiplier in a linear version of our framework. To be precise, we estimate (3.4) using the same
data but restricting γ
h
= δ
h
= 0. We then use the estimates of β
h
from the linear model
to compute the fiscal multiplier
g
F M
H
= (
P
H
h=0
β
h
GDP
)/(
P
H
h=0
β
h
G
). The resulting estimates
are presented in the last column of Table 2. We find average multipliers of about 0.85 at both
horizons. While this estimate is relatively close to the multiplier estimates in Ramey and Zubairy
(2018) which range from 0.66 to 0.71 (see their Table 1), it is substantially below the multiplier
of 1.3 for an average FOMC composition (F M
H
(0)) in our baseline model. In addition, the
standard errors for the multiplier in the linear model are substantially larger than the standard
errors of F M
H
(0). This comparison suggests that accounting for systematic monetary policy
is important for the magnitude and precision of multiplier estimates. Moreover, one potential
reason for the broad range of multiplier estimates in the literature is not accounting for time
variation in systematic monetary policy.
ECB Working Paper Series No 2851
26

4.5 Sensitivity analysis
In this section, we provide an extensive sensitivity analysis to assess the robustness of our base-
line results. We investigate alternative Hawk-Dove balances, an alternative spending shock,
varying sample periods, and the inclusion of additional control variables. The multiplier esti-
mates for all specifications are provided in Appendix G.
29
Alternative Hawk-Dove balances. We address potential concerns regarding the aggrega-
tion of individual policy preferences and the comparability of preferences over time.
While our baseline Hawk
t
aggregates individual preferences by an unweighted arithmetic average,
we consider four alternative aggregation schemes. First, we use the median policy preference
across FOMC members. Second, we use an arithmetic average but double the weight of the
Fed Chair. Third, we use the arithmetic average but do not distinguish between consistent and
swinging FOMC members when defining Hawk
iτ
in (3.1). We estimate impulse responses and
multipliers similar to the baseline, albeit smaller ones for the median aggregation, see Table G.3.
In a fourth alternative aggregation, we consider the role of strong majorities in the FOMC. We
construct an alternative Hawk-Dove balance which equals -1 if Hawk
t
falls below the first
quartile or tertile of the distribution of Hawk
t
over time, +1 above the highest quartile or
tertile, and zero otherwise. The estimated average and differential effects remain quite similar
in terms of the shapes and significance and also roughly align with the baseline multipliers,
see Table G.4. Finally, we construct an alternative instrument by setting the preferences of
swinging FRB presidents to zero before aggregating them to the FOMC rotation instrument.
This yields somewhat larger multiplier estimates, albeit less precisely estimated, see Table G.3.
This suggests that swings in the instrument are not driving or amplifying our results.
Another potential concern is that the meaning of being a hawk or dove might have changed
over time, see the discussion in Section 3.1. To account for trends in the Hawk-Dove balance,
we consider an alternative Hawk-Dove balance which subtracts from the baseline Hawk
t
its
backward-looking 5, 10, or 15-year moving average. The estimated average and differential
responses are very similar to our baseline estimates. In addition, the average and dovish multi-
pliers have similar magnitudes as the baseline while the hawkish multiplier is similarly imprecise,
see Table G.3 in the Appendix. Overall, our results reinforce the arguments in Section 3.1 that
the classification of hawks and doves is indeed comparable over time.
Alternative spending shock. Our baseline shock is specific to military spending. We inves-
tigate the external validity of our results by using an alternative fiscal spending shock, which
is identified from a timing restriction on total government spending as suggested by Blanchard
and Perotti (2002), henceforth BP. They assume that only government spending shocks can
affect government spending contemporaneously.
We find that GDP and G respond more swiftly compared to our baseline. This is in line with
the nature of the BP shock. More importantly, we find that a hawkish FOMC significantly
dampens the expansionary effect on GDP. The average fiscal multiplier is around 1.4 for the
29
For the impulse responses of GDP and G associated to the sensitivity analysis, see Appendix G of the CEPR
Discussion Paper version (Hack et al., 2023, see https://cepr.org/publications/dp17999).
ECB Working Paper Series No 2851
27
four-year horizon, see Table G.3, which is remarkably similar to our baseline multiplier. The
state-dependent multiplier ranges from 0.88 to 1.74 between the hawkish and dovish FOMC
(χ = ±2/12). While the variation in the multiplier is more compressed compared to the
baseline, it is similarly significant.
Great Recession and ZLB. Our baseline results are estimated using the sample from
1960Q1 to 2014Q4 which includes the Great Recession (GR) and the subsequent ZLB period.
We investigate the sensitivity of our results on a sample that ends either in 2007Q4 to exclude
the GR and ZLB period or in 2008Q4 to exclude the ZLB period. For both of these subsamples,
our estimates are highly similar to the baseline for average and differential responses and the
corresponding multipliers in Table G.3.
Additional control variables. Finally, we investigate the sensitivity of our results to adding
potentially important co-variates to the baseline specification of our local projection framework.
The additional control variables are short-term and long-term interest rates, inflation, and the
primary surplus. While the estimates are similar to the baseline, we naturally give up some
statistical power, see Table G.3. Nevertheless, we estimate dovish multipliers around 2 which
substantially exceeds the average multiplier, consistent with our baseline results. We further
add non-linear controls by including interactions of Hawk
t
with the control variables. The
results are remarkably close to the baseline, see Table G.3.
5 Inspecting the mechanism
In this section, we inspect the mechanism behind our findings in the previous section. We show
that in response to an expansionary spending shock, nominal and real interest rates rise and
inflation is dampened under a hawkish FOMC. Conversely, interest rates initially fall and rise
only with substantial delay under a dovish FOMC, supporting a crowd in of consumption
and investment and an increase in non-military government spending. We argue that the
fiscal multiplier estimates across hawkish and dovish monetary regimes are plausible given the
different interest rate responses.
5.1 Interest rates and inflation
Conventional wisdom says that monetary policy tightens in response to higher government
spending in order to mitigate the inflationary pressure. The Federal Reserve can use a range
of tools, including the target federal funds rate, the discount rate, balance sheet policies and
communication including forward guidance. These tools can affect short- and long-term interest
rates, and hence inflation.
Nominal interest rates. We study the response of the federal funds rate (FFR) and the
annualized yield on 1-year and 10-year Treasury securities to government spending shocks by
using our local projection framework (3.4)-(3.5) with interest rates as outcome variable x
t+h
.
We follow the specification in Section 4.1 but include four lags of the FFR, 1-year and 10-year
ECB Working Paper Series No 2851
28

Figure 6: Responses of nominal interest rates
(a) Average FFR (β
h
) (b) State-dependent FFR (β
h
± γ
h
)
(c) Average 1-year rate (β
h
) (d) State-dependent 1-year rate (β
h
± γ
h
)
(e) Average 10-year rate (β
h
) (f) State-dependent 10-year rate (β
h
± γ
h
)
Notes: The figure shows responses of the federal funds rate (FFR), as well as the 1-year and 10-year treasury yields to an
expansionary military spending shock, corresponding to one percent of GDP, conditional on systematic monetary policy
(Hawk
t
). All outcomes are annualized interest rates. We show IV estimates based on the local projection framework
(3.4)-(3.5) as specified in Section 5.1. The β
h
captures the responses when Hawk
t
equals its sample average. The β
h
± γ
h
shows the state-dependent responses when Hawk
t
exceeds the sample average either by two hawks (+2 Hawks) or by two
doves (+2 Doves). The shaded areas indicate 68% and 95% confidence bands using Newey-West standard errors.
Treasury yields, and CPI inflation as additional control variables to control for pre-trends in
these outcomes.
Panels (a), (c) and (e) of Figure 6 show the IV estimates of β
h
, the average response of the
three nominal interest rates when Hawk
t
equals its sample average. The average FFR response
ECB Working Paper Series No 2851
29

appears muted in the first year, after which it gradually increases and reaches 30 basis points
at horizons beyond two years. The average responses of the 1-year and 10-year yields feature
similar shapes, albeit at lower magnitudes. Panels (b), (d) and (f) show the IV estimates of
β
h
± γ
h
, the state-dependent interest rate responses when Hawk
t
exceeds the sample average
either by two hawks (+2 Hawks) or by two doves (+2 Doves). All interest rates increase faster
and more strongly under a hawkish FOMC. Compared to the average response, the peak in
the FFR is reached one year earlier and is almost double in size (about 56 basis points). In
contrast, under a dovish FOMC, the FFR falls for almost two years and a reversion to a higher
FFR is observed only three years after the shock. Similarly, both 1-year and 10-year Treasury
yields increase after two years under a dovish FOMC, suggesting that the monetary regimes
also differ in their effects on expected future policy at long horizons.
The delayed FFR response is consistent with the initial uncertainty surrounding the military
spending shock and the gradually evolving macroeconomic effects of the shock, see Figure 3.
Section 6 provides narrative evidence from the FOMC historical records suggesting that indeed
the FOMC delays action until some uncertainty about the spending plans and their potential
effect on the economy and inflation is resolved. Furthermore, a delayed differential policy
response that extends for several quarters beyond the term of the FOMC and the associated
rotation present at the time of the shock, is consistent with the decision dynamics in the FOMC.
For example, Laurence Meyer, member of the Board of Governors from 1996 to 2002, describes
these dynamics during his term at the Fed as follows:
So was the FOMC meeting merely a ritual dance? No. I came to see policy deci-
sions as often evolving over at least a couple of meetings. The seeds were sown at
one meeting and harvested at the next. [...] Similarly, while in my remarks to my
colleagues it sounded as if I were addressing today’s concerns and today’s policy deci-
sions, in reality I was often positioning myself, and my peers, for the next meeting.
Laurence Meyer (2004), A Term at the Fed: An Insider’s View, Harper Business
Consistent with Meyer’s view that it takes time to influence policy strategies in the FOMC,
we find that the FOMC rotation (Hawk
IV
t
) is more important for the policy response to the
spending shock and its real effects when the shock occurs closer to the beginning of the FOMC
rotation, which takes place in the first quarter of the year. When we drop spending shocks in
the second half of the year, we obtain similar findings compared to the baseline, see Figures H.1-
H.2 in Appendix H. Conversely, the dependence on monetary policy becomes weaker and less
significant when dropping spending shocks in the first half of the year.
Inflation rates. We further asses the effects of military spending on inflation expectations,
CPI core inflation (excluding food and energy prices), and CPI headline inflation.
30
We esti-
mate the inflation responses using the specification of our local projection framework (3.4)-(3.5)
for nominal interest rates and additionally control for four lags of the inflation measure under
consideration. Overall, the inflation responses are not precisely estimated. The average response
30
We use one-year inflation expectations based on the CPI forecasts from the Livingston Survey of the Federal
Reserve Bank of Philadelphia. It is the oldest continuous survey on the expectations of economists from industry,
government, banking, and academia. For details, see Appendix B.
ECB Working Paper Series No 2851
30

of expected inflation tends to be positive, while the evidence is mixed for core and headline infla-
tion. Turning to the dependence on the Hawk-Dove balance, we find that inflation expectations
increase sluggishly under a dovish FOMC and peak at about three years. In contrast, inflation
expectations tend to fall under a hawkish FOMC, suggesting that the FOMC is successful in
containing inflation expectations. The response of core inflation follows a similar but even more
sluggish pattern, suggesting that policy tightening is successful in containing inflationary pres-
sures. Compared to the interest rate responses, the inflation response appear delayed by one
to two years, broadly in line with the lags in the transmission of monetary policy. Finally, the
results for headline inflation are more mixed, possibly due to larger transitory fluctuations in
energy and food prices.
Real interest rates. In a large class of models, the real effects of monetary policy depend
on its ability to affect real interest rates. Under a hawkish FOMC, the response of nominal
rates is larger, while the response of inflation is smaller. Hence, the implied response of real
interest rates is larger. In response to a government spending shock, real interest rates increase
by more if the FOMC is hawkish and by less if the FOMC is dovish. We obtain similar
results when directly estimating the real interest rate response. We consider real interest rates
constructed by subtracting the expected CPI inflation from the three nominal interest rates
considered in Figure 6. Figure H.3 in Appendix H presents the IV estimates of the average and
state-dependent responses.
Relation to fiscal multipliers in the literature. The interest rate responses allow us
to relate our fiscal spending multiplier estimates in Table 2 with the findings in the related
literature. Our spending multiplier is between two and three under the dovish FOMC which
is associated with a weak negative response of the nominal (and real) FFR for the first two
years. In theory, the multiplier may be far above one (or negative) depending on the response
of interest rates (Woodford, 2011; Farhi and Werning, 2016). In an estimated medium-scale
DSGE model, Christiano et al. (2011) find multipliers between two and four at the ZLB when
the short-run nominal interest rate does not respond.
Our findings also relate to an empirical literature that estimates fiscal spending multipliers.
For example, Nakamura and Steinsson (2014) estimate two-year regional multipliers for the
U.S. of approximately 1.5. To the extent that regional multipliers correspond to the aggregate
multiplier when nominal interest rates do not respond, we can compare their estimates to our
two-year multiplier estimates. In particular, we construct a spending multiplier for the case in
which the nominal FFR is unresponsive by choosing the Hawk-Dove balance (χ) that minimizes
the squared distance of the FFR response from zero in the first two years.
31
This requires a
χ slightly below the “+1 Dove” case in Table 2. The associated two-year spending multiplier
is 1.9, which is similar to the range of estimates in Nakamura and Steinsson (2014). While
our identification design allows us to estimate the spending multiplier when monetary policy is
non-responsive, it also allows us to study many other monetary policy scenarios.
31
Formally, we solve min
χ
P
8
h=0
(β
h
F F R
− χ · γ
h
F F R
)
2
, where χ indicates a level of the Hawk-Dove balance in
deviation from the sample mean (Hawk
t
− Hawk).
ECB Working Paper Series No 2851
31

Figure 7: Responses of inflation rates
(a) Average expected inflation (β
h
) (b) State-dependent expected inflation (β
H
± γ
h
)
(c) Average core inflation (β
h
) (d) State-dependent core inflation (β
H
± γ
h
)
(e) Average headline inflation (β
h
) (f) State-dependent headline inflation (β
H
± γ
h
)
Notes: The figure shows responses of expected inflation, CPI core, and CPI headline inflation to an expansionary military
spending shock, corresponding to one percent of GDP, conditional on systematic monetary policy (Hawk
t
). All outcomes
are annualized inflation rates. We show IV estimates based on the local projection framework (3.4)-(3.5) as specified in
Section 5.1. The β
h
captures the responses when Hawk
t
equals its sample average. The β
h
± γ
h
shows the state-dependent
responses when Hawk
t
exceeds the sample average either by two hawks (+2 Hawks) or by two doves (+2 Doves). The
shaded areas indicate 68% and 95% confidence bands using Newey-West standard errors.
We further compare our estimates with the estimate of the aggregate spending multiplier when
monetary policy is constrained at the ZLB. Ramey and Zubairy (2018) finds a ZLB multiplier of
1.6 after two years (when excluding WWII), while Miyamoto et al. (2018) find a ZLB multiplier
well above 1.5 for Japan. Notwithstanding the endogeneity of a binding ZLB, our multiplier
ECB Working Paper Series No 2851
32

of 1.9 under a non-responsive FFR is similar to the ZLB multipliers in the literature. Overall,
our multiplier estimates and the associated interest rate path are broadly similar to previous
quantitative and empirical findings.
5.2 Decomposing the GDP and G responses
In the following, we examine the underlying components of the responses of real GDP and real
government spending. We find that the differential GDP effects are primarily driven by private
consumption and somewhat less by private investment. Moreover, the differential government
spending response is almost entirely driven by non-military expenses, consistent with our iden-
tifying assumptions.
Investment and consumption. The fiscal spending multiplier can be above one when GDP
components other than G are crowded in by the spending shock. Conversely, crowding out may
lead to multipliers below one. Therefore, we estimate the responses of private investment and
private consumption.
32
The results are provided in Figure H.4 in Appendix H. For the average
Hawk-Dove balance, we find a mild but insignificant crowding out of private consumption and
crowding-in of private investment in the short run. In contrast, the crowding out of consumption
is strong and significant under a hawkish FOMC. For investment, we find a similar albeit
smaller and less significant pattern. Overall, the strong state-dependence of our fiscal multipliers
appears to be mainly driven by private consumption.
Military and non-military government spending. We further estimate the respective
responses of military and non-military government spending to the military spending shock, see
Figure H.5 in Appendix H. On average, we find a modest and insignificant decline in non-military
spending. However, the government cuts non-military spending strongly and significantly under
a hawkish FOMC. Fiscal policy responds to higher interest rates by lowering non-military
spending, consistent with higher costs of servicing federal debt and lower tax revenues. This
further contributes to the negative GDP response under a hawkish FOMC in addition to the
contributions by consumption and investment. For military spending, we find the opposite.
While the average response is large and significant, there is no meaningful dependence on the
Hawk-Dove balance for military expenditures. This suggests that the shock is unrelated to
systematic monetary policy, corroborating our key identifying assumptions, as discussed in
Section 4.1.
6 Historical FOMC records
Interviewer: What would have happened, do you think, if the Fed had not raised
the discount rate?
Chairman Martin: A golden opportunity to stop inflation in its tracks would have
been lost.
Interviewer: It was primarily the projection of Vietnam spending; is that correct?
32
For details on the definition of consumption and investment, see Appendix B.
ECB Working Paper Series No 2851
33

Chairman Martin: Right. I kept telling him we could not have guns and butter.
Interviewer: When you talked to Lyndon Johnson about this projection, what did
he say? Did he disagree with it or did he agree with it?
Chairman Martin: He disagreed. He thought we could have guns and butter.
33
We complement our quantitative analysis with narrative evidence from the records of discussions
and decisions at FOMC meetings. This evidence serves two purposes. First, it confirms that
the FOMC members discuss changes in government defense spending, assessing the impact on
economic activity and inflation as well as the FOMC’s policy response. Second, it shows that
the policy response depends on the composition of the FOMC.
To illustrate the FOMC discussion around military spending shocks, the FOMC composition,
and the corresponding policy response, we focus on two important events during the 1960s:
the acceleration of the U.S. Space Program in 1961 and the Vietnam ground war starting in
1965. The corresponding military shocks are both large while the FOMC composition appears
on average hawkish in the first part of the 1960s and dovish in the second part, see Figure 2.
In this period, the Fed was headed by William McChesney Martin, a consistent hawk whose
tenure as chairman from 1951 to 1970 was the longest in history.
For both events, we identify three phases of the FOMC’s reaction to military defense spending
from the historical FOMC records. First, there is uncertainty about the extent to which the
spending plans will be realized and about their impact on the economy. Second, the effects of
higher spending on the economy become visible while inflation appears unresponsive, therefore
they wait until “all the evidence was in”. Third, the effects on inflation become visible but the
FOMC delays action. The first two are common for hawkish and dovish committees while the
third phase is more pronounced under a dovish one, broadly in line with our empirical findings.
We summarize the key aspects of each case study below.
34
The sources for our narrative evidence
are the FOMC Historical Minutes until 1967 and the Memoranda of Discussion thereafter.
6.1 The U.S. Space Program
In the first half of 1961, Ramey and Zubairy (2018) identify two expansionary shocks related to
President Kennedy’s defense spending plans, including the Space Program to “go to the Moon”.
In the FOMC meeting of August 1, 1961, the staff presents the following assessment:
On top of substantial increases in expenditures to finance space exploration and
longer-run defense measures [...] the President has found it necessary to recommend
an increase of $3-1/2 billion in current defense expenditures [...]. More important,
the President accompanied his recommendations with a very firm statement regarding
his intentions with respect to the 1963 budget. These factors have certainly tended
to minimize the immediate inflationary expectations and the urgency of the need for
counter-measures. As of this moment in time, actual developments do not seem to
call for any change in monetary policy. (p.8)
33
Former Fed Chairman William McChesney Martin: Oral History, Interview I by Michael L. Gillette in 1987,
LBJ Library Oral History Collection. The interviewer refers to the decision of the Federal Reserve to raise the
discount rate on December 1965. Lyndon B. Johnson was the President of the United States from 1963 to 1969.
34
The complete case studies can be found in Appendix I of the CEPR Discussion Paper version (Hack et al.,
2023, see https://cepr.org/publications/dp17999).
ECB Working Paper Series No 2851
34

The majority of the FOMC members argued similarly for no change in policy because the effects
could not yet be evaluated. Hawkish FOMC members suggested the need for alertness to avoid
getting into an inflationary situation while agreeing to no policy change in this meeting. In this
regard, New York Fed first-vice president, William Treiber noted: If expenditures and related
private spending result in an upsurge of activity with inflationary aspects, we may have to modify
our policy of basic monetary ease sooner than we would otherwise have done. In the coming
period undue ease should be avoided. (p.22-23)
FOMC members started to acknowledge the expansionary impact on employment and business
sentiment in defense-related industries by the end of 1961 and later in 1963 on prices. On
May 7, 1963, the FOMC voted to firm policy as a preemptive move against inflation.
35
In this
meeting, Chairman Martin said:
If the Committee waited too long, however, it might have to deal with an active
problem of inflationary pressures. In his opinion, there was already a good bit of
pressure in some areas that could build up rapidly. If one waited until after the
resulting price movements actually occurred, he might wonder why he had not done
something about it before. It would be too late at that juncture. (p.61)
In this period, the FOMC composition was hawkish on average. This helped the hawkish
Chairman Martin to reach a consensus for tighter policy to act preemptively against inflationary
pressures.
6.2 The Vietnam War
In 1965, the U.S. entered the ground war in Vietnam leading to a series of expansionary military
spending shocks lasting until 1967Q1. In the FOMC meeting of August 10, 1965, the staff’s
presentation explicitly accounted for the intended increase of military spending:
Further stimulus to the economy will come from expanded Government procure-
ment for Vietnam hostilities. [...] the increases in spending and in the armed forces
now proposed do not appear significant enough to touch off [...] widespread price
increases. [...] The market response to Vietnam developments doesn’t suggest any
widespread fears of shortages, rationing, or inflation. On balance, then, the domestic
evidence isn’t clear enough to me to justify a significant policy move in either direc-
tion at this juncture. (p. 28-29).
Several FOMC members agreed with the staff’s assessment and argued for an unchanged policy
due to significant uncertainties related to the developments in Vietnam. In contrast, few hawkish
FOMC members noted that the Vietnam hostilities were already affecting industrial prices.
Two meetings later, on September 28, the dovish members dissented against the “status quo”,
arguing that, in their judgment, evidence of inflationary pressure was lacking and hence, they
preferred an easier policy. In contrast, Alfred Hayes (New York Fed), a hawk, argued in the
35
The FOMC shifted the emphasis of monetary policy toward slightly less ease and toward maintaining a
moderately firm tone in the money market in June 1962, mentioning balance-of-payments concerns. In this
period, FOMC members interested in a tighter, inflation-focused monetary policy often cited the balance-of-
payments criterion to bolster their case (Bordo and Humpage, 2014).
ECB Working Paper Series No 2851
35
meeting of October 12, 1965 that: Looking ahead, I think we have a real basis for concern about
potential inflationary pressures (p.25). Chairman Martin shared similar thinking on inflation
while sensing that he did not have a majority to firm policy:
While the evidence was not clear, he thought there were many signs of inflation and
of inflationary psychology in the economy. [...] But the Committee had a tendency
to feel that it was best to wait until all the evidence was in before making a policy
change. The difficulty was that when all the evidence was in it was likely to be too
late. [...] With a divided Committee and in face of strong Administration opposition
he did not believe it would be appropriate for him to lend his support to those who
favored a change in policy now. (p.68-69)
On December 5, 1965, the discount rate was raised with a narrow majority in order to prevent
the risk of inflation. However, the tightening signal by the Fed was not enough to contain
the buildup of inflationary pressures. While this had become clear for most members, the
U.S. President had promised an anti-inflationary fiscal program and the FOMC delayed action
in support of promised fiscal restraint. On September 13, 1966, Governor James Robertson
summarized the situation as follows: Inflationary pressures are persisting, as the staff materials
have underlined. [...] To counter these inflationary pressures, we now have the promise of help
from a somewhat greater degree of fiscal restraint. (p.72).
Hoping on the legislative action to raise taxes in 1967, by the last quarter of 1966 and throughout
the first part of 1967, the FOMC eased policy, despite two large expansionary military spending
shocks hitting in 1966Q4 and 1967Q1. In the FOMC meeting of September 12, 1967, Chairman
Martin acknowledged that tightening had been delayed for too long because of the tendency
to underestimate the strains being put on economic resources by the hostilities in Vietnam. A
“guns and butter” economy was not feasible; the country’s resources were not sufficient for that.
(p.73). The FOMC decided to tighten the policy on December 12, 1967. Once again, Chairman
Martin admitted delayed action as follows:
It was his feeling that the Committee had in a sense been caught in a trap [...]
From the standpoint of economic considerations alone, it would have been desirable
to adopt a firmer monetary policy a number of months ago. (p.96)
In the period between 1965 and 1967, the FOMC is categorized as dovish on average. Both,
the dovish committee and the political pressure against tighter policy made it more difficult for
Chairman Martin to reach a consensus for firm policy within the FOMC. Indeed, we observe that
even when the expansionary effects of military spending related to the Vietnam War became
evident, the FOMC initially hesitated, then tightened modestly but soon erred toward loose
policy.
Overall, the narrative evidence from the 1960s supports the important elements that we highlight
in this paper: the Fed’s reaction to military spending and the role of the FOMC composition
for this reaction.
ECB Working Paper Series No 2851
36
7 Conclusion
This paper proposes an identification design to estimate the effects of systematic monetary
policy for the propagation of macroeconomic shocks. Our design combines the narrative classi-
fication of FOMC members’ policy preferences from Istrefi (2019) with a novel FOMC rotation
instrument for systematic monetary policy. The identification design opens up myriad research
opportunities, such as revisiting the effects of various fiscal, technology, and oil shocks and their
dependence on systematic monetary policy.
We use our identification design to study government spending shocks and find that fiscal
spending multipliers depend strongly and significantly on systematic monetary policy. We
inspect the mechanism behind our result and find consistent interest rate and inflation responses.
Our results suggest that it is critically important for fiscal policy makers to consider the stance of
monetary policy in their decision making process. However, a potentially misleading conclusion
from our results is that the government should increase spending when the FOMC is dovish.
This could be misleading because such changes in government spending are not random shocks.
Moreover, the Lucas (1976) critique applies if the conduct of fiscal policy changes structurally.
To avoid such misleading conclusions, a promising avenue for future research is to use our results
to discipline micro-founded models to study optimal fiscal stabilization policy.
Finally, while our identification design is specific to U.S. monetary policy, a promising avenue
for future research is to study other countries or currency areas in which committees decide
monetary policy. In fact, since 2015 the European Central Bank’s Governing Council allocates
voting rights to its members through a rotation mechanism.
References
Abrams, B. (2006): “How Richard Nixon Pressured Arthur Burns: Evidence from the Nixon
Tapes,” Journal of Economic Perspectives, 20, 177–188.
Abrams, B. A. and J. L. Butkiewicz (2012): “The Political Business Cycle: New Evidence
from the Nixon Tapes,” Journal of Money, Credit and Banking, 44, 385–399.
Andrews, I. (2018): “Valid Two-Step Identification-Robust Confidence Sets for GMM,” Review
of Economics and Statistics, 100, 337–348.
Andrews, I., J. H. Stock, and L. Sun (2019): “Weak Instruments in Instrumental Variables
Regression: Theory and Practice,” Annual Review of Economics, 11, 727–753.
Arias, J. E., D. Caldara, and J. F. Rubio-Ramirez (2019): “The systematic component
of monetary policy in SVARs: An agnostic identification procedure,” Journal of Monetary
Economics, 101, 1–13.
Auerbach, A. and Y. Gorodnichenko (2012): “Measuring the Output Responses to Fiscal
Policy,” American Economic Journal: Economic Policy, 4, 1–27.
Baily, M. N., C. Hulten, and D. Campbell (1992): “Productivity Dynamics in Manufac-
turing Plants,” Brookings Papers on Economic Activity, 23, 187–267.
Barnichon, R., D. Debortoli, and C. Matthes (2022): “Understanding the Size of the
Government Spending Multiplier: It’s in the Sign,” Review of Economic Studies, 89, 87–117.
ECB Working Paper Series No 2851
37
Barnichon, R. and G. Mesters (2022): “A Sufficient Statistics Approach for Macro Policy
Evaluation,” Working Paper Series 2022, Federal Reserve Bank of San Francisco.
Barro, R. J. and C. J. Redlick (2011): “Macroeconomic Effects from Government
Purchases and Taxes,” Quarterly Journal of Economics, 126, 51–102.
Barsky, R. and E. Sims (2011): “News shocks and business cycles,” Journal of Monetary
Economics, 58, 273–289.
Barthélemy, J. and M. Marx (2017): “Solving endogenous regime switching models,”
Journal of Economic Dynamics and Control, 77, 1–25.
Bauer, M. D., C. Pflueger, and A. Sunderam (2022): “Perceptions about Monetary
Policy,” NBER Working Paper 30480.
Bauer, M. D. and E. T. Swanson (2023): “An Alternative Explanation for the “Fed Infor-
mation Effect”,” American Economic Review, 113, 664–700.
Ben Zeev, N., V. A. Ramey, and S. Zubairy (2023): “Do Government Spending Multipliers
Depend on the Sign of the Shock?” AEA Papers and Proceedings, forthcoming.
Benati, L. (2021): “Leaning against house prices: A structural VAR investigation,” Journal
of Monetary Economics, 118, 399–412.
Bernanke, B. S. and A. S. Blinder (1992): “The Federal Funds Rate and the Channels of
Monetary Transmission,” American Economic Review, 82, 901–921.
Bernanke, B. S., M. Gertler, M. Watson, C. A. Sims, and B. M. Friedman (1997):
“Systematic Monetary Policy and the Effects of Oil Price Shocks,” Brookings Papers on
Economic Activity, 1997, 91–157.
Bianchi, F. (2013): “Regime Switches, Agents’ Beliefs, and post-World War II U.S. Macroe-
conomic Dynamics,” Review of Economic Studies, 80, 463–490.
Bianchi, F. and C. Ilut (2017): “Monetary/Fiscal policy mix and agents’ beliefs,” Review
of Economic Dynamics, 26, 113–139.
Blanchard, O. and R. Perotti (2002): “An Empirical Characterization of the Dynamic
Effects of Changes in Government Spending and Taxes on Output,” Quarterly Journal of
Economics, 117, 1329–1368.
Blinder, A. S. (1999): Central Banking in Theory and Practice, vol. 1 of MIT Press Books,
The MIT Press.
——— (2022): A Monetary and Fiscal History of the United States, 1961-2021, Princeton
University Press.
Bordo, M. D. and O. F. Humpage (2014): “Federal Reserve policy and Bretton Woods,”
NBER Working Paper 20656.
Bordo, M. D. and K. Istrefi (2023): “Perceived FOMC: The making of hawks, doves and
swingers,” Journal of Monetary Economics, forthcoming.
Bound, J., D. A. Jaeger, and R. M. Baker (1995): “Problems with Instrumental Variables
Estimation When the Correlation Between the Instruments and the Endogenous Explanatory
Variable is Weak,” Journal of the American Statistical Association, 90, 443–450.
Broner, F., D. Clancy, A. Erce, and A. Martin (2022): “Fiscal Multipliers and Foreign
Holdings of Public Debt,” Review of Economic Studies, 89, 1155–1204.
Carvalho, C., F. Nechio, and T. Tristão (2021): “Taylor rule estimation by OLS,” Journal
ECB Working Paper Series No 2851
38
of Monetary Economics, 124, 140–154.
Chappell, H., R. R. McGregor, and T. A. Vermilyea (2005): Committee Decisions on
Monetary Policy: Evidence from Historical Records of the Federal Open Market Committee,
vol. 1, MIT Press, 1 ed.
Chaudhuri, S. and E. Zivot (2011): “A new method of projection-based inference in GMM
with weakly identified nuisance parameters,” Journal of Econometrics, 164, 239–251.
Chernozhukov, V. and C. Hansen (2008): “The reduced form: A simple approach to
inference with weak instruments,” Economics Letters, 100, 68–71.
Christiano, L., M. Eichenbaum, and S. Rebelo (2011): “When is the Government
Spending Multiplier Large?” Journal of Political Economy, 119, 78 – 121.
Christiano, L. J., M. Eichenbaum, and C. L. Evans (1999): “Monetary policy shocks:
What have we learned and to what end?” Handbook of Macroeconomics, 1, 65–148.
Cieslak, A., S. Hansen, M. McMahon, and S. Xiao (2022): “Policymakers’ Uncertainty,”
mimeo.
Clarida, R., J. Gali, and M. Gertler (2000): “Monetary Policy Rules and Macroeconomic
Stability: Evidence and Some Theory,” Quarterly Journal of Economics, 115, 147–180.
Cloyne, J. S., Ò. Jordà, and A. M. Taylor (2021): “Decomposing the Fiscal Multiplier,”
NBER Working Paper 26939.
Cochrane, J. H. (2011): “Determinacy and Identification with Taylor Rules,” Journal of
Political Economy, 119, 565–615.
——— (2022): “The fiscal roots of inflation,” Review of Economic Dynamics, 45, 22–40.
Cochrane, J. H. and M. Piazzesi (2002): “The Fed and Interest Rates - A High-Frequency
Identification,” American Economic Review, 92, 90–95.
Coibion, O. and Y. Gorodnichenko (2011): “Monetary Policy, Trend Inflation, and the
Great Moderation: An Alternative Interpretation,” American Economic Review, 101, 341–70.
Davig, T. and E. M. Leeper (2007): “Generalizing the Taylor Principle,” American
Economic Review, 97, 607–635.
——— (2008): “Endogenous Monetary Policy Regime Change,” in NBER International
Seminar on Macroeconomics 2006, National Bureau of Economic Research, NBER Chap-
ters, 345–391.
DeLong, B. J. (1997): “America’s Peacetime Inflation: The 1970s.” in Reducing Inflation:
Motivation and Strategy, ed. by C. Romer and D. Romer, University of Chicago Press.
Ehrmann, M., R. Tietz, and B. Visser (2022): “Voting Right Rotation, Behavior of
Committee Members and Financial Market Reactions: Evidence from the U.S. Federal Open
Market Committee,” IMF Working Papers 2022/105, International Monetary Fund.
Farhi, E. and I. Werning (2016): “Fiscal Multipliers: Liquidity Traps and Currency Unions,”
in Handbook of Macroeconomics, Elsevier, vol. 2, 2417–2492.
Ferguson, N., M. Kornejew, P. Schmelzing, and M. Schularick (2023): “The Safety
Net: Central Bank Balance Sheets and Financial Crisis, 1987-2020,” Economics working
paper 23102, Hoover Institution.
Ferrière, A. and G. Navarro (2018): “The Heterogeneous Effects of Government Spending
: It’s All About Taxes,” International Finance Discussion Papers, 1237.
ECB Working Paper Series No 2851
39
Galí, J. (2015): Monetary Policy, Inflation, and the Business Cycle: An Introduction to the
New Keynesian Framework and Its Applications, Princeton University Press.
Galí, J., J. López-Salido, and J. Vallés (2003): “Technology shocks and monetary policy:
assessing the Fed’s performance,” Journal of Monetary Economics, 50, 723–743.
Ghassibe, M. and F. Zanetti (2022): “State dependence of fiscal multipliers: the source of
fluctuations matters,” Journal of Monetary Economics, 132, 1–23.
Goodfriend, M. and R. G. King (2005): “The incredible Volcker disinflation,” Journal of
Monetary Economics, 52, 981–1015.
Gordon, R. J. and R. Krenn (2010): “The End of the Great Depression: VAR Insight on
the Roles of Monetary and Fiscal Policy.” NBER Working Paper 16380.
Hack, L., K. Istrefi, and M. Meier (2023): “Identification of Systematic Monetary Policy,”
CEPR Discussion Paper 17999 (https://cepr.org/publications/dp17999).
Ilzetzki, E., E. G. Mendoza, and C. A. Végh (2013): “How big (small?) are fiscal
multipliers?” Journal of Monetary Economics, 60, 239–254.
Istrefi, K. (2019): “In Fed Watchers’ Eyes: Hawks, Doves and Monetary Policy,” Banque de
France Working Paper.
Jordà, Ò. and A. M. Taylor (2016): “The Time for Austerity: Estimating the Average
Treatment Effect of Fiscal Policy,” The Economic Journal, 126, 219–255.
Kilian, L. and L. T. Lewis (2011): “Does the Fed Respond to Oil Price Shocks?” Economic
Journal, 121, 1047–1072.
Lazarus, E., D. J. Lewis, J. H. Stock, and M. W. Watson (2018): “HAR Inference:
Recommendations for Practice,” Journal of Business & Economic Statistics, 36, 541–559.
Leeper, E. M., N. Traum, and T. B. Walker (2017): “Clearing up the Fiscal Multiplier
Morass,” American Economic Review, 107, 2409–54.
Leeper, E. M. and T. Zha (2003): “Modest policy interventions,” Journal of Monetary
Economics, 50, 1673–1700.
Lewis, D. J. and K. Mertens (2022): “A Robust Test for Weak Instruments with Multiple
Endogenous Regressors,” Staff reports, no. 1020, Federal Reserve Bank of New York.
Liu, Y. and J. C. Wu (2021): “Reconstructing the yield curve,” Journal of Financial
Economics, 142, 1395–1425.
Lucas, R. E. (1976): “Econometric policy evaluation: A critique,” Carnegie-Rochester Confer-
ence Series on Public Policy, 1, 19–46.
McKay, A. and C. K. Wolf (2022): “What Can Time-Series Regressions Tell Us About
Policy Counterfactuals?” NBER Working Paper 30358.
Meltzer, A. H. (2005): “Origins of the Great Inflation,” Federal Reserve Bank of St. Louis
Review, March/April, 145–176.
Miyamoto, W., T. L. Nguyen, and D. Sergeyev (2018): “Government Spending Multi-
pliers Under the Zero Lower Bound: Evidence from Japan,” American Economic Journal:
Macroeconomics, 10, 247–77.
Montiel Olea, J. L. and C. Pflueger (2013): “A Robust Test for Weak Instruments,”
Journal of Business & Economic Statistics, 31, 358–369.
Mountford, A. and H. Uhlig (2009): “What are the effects of fiscal policy shocks?” Journal
ECB Working Paper Series No 2851
40
of Applied Econometrics, 24, 960–992.
Nakamura, E. and J. Steinsson (2014): “Fiscal Stimulus in a Monetary Union: Evidence
from US Regions,” American Economic Review, 104, 753–92.
Orphanides, A. (2003): “The quest for prosperity without inflation,” Journal of Monetary
Economics, 50, 633–663.
——— (2004): “Monetary Policy Rules, Macroeconomic Stability, and Inflation: A View from
the Trenches,” Journal of Money, Credit and Banking, 36, 151–175.
Primiceri, G. (2006): “Why Inflation Rose and Fell: Policymakers’ Beliefs and US Postwar
Stabilization Policy,” Quarterly Journal of Economics, 867–901.
Primiceri, G. E. (2005): “Time Varying Structural Vector Autoregressions and Monetary
Policy,” Review of Economic Studies, 72, 821–852.
Ramey, V. (2016): “Macroeconomic Shocks and Their Propagation,” Handbook of Macroeco-
nomics, 2, 71 – 162.
Ramey, V. A. (2011): “Identifying Government Spending Shocks: It’s all in the Timing,”
Quarterly Journal of Economics, 126, 1–50.
Ramey, V. A. and M. D. Shapiro (1998): “Costly capital reallocation and the effects of
government spending,” Carnegie-Rochester Conference Series on Public Policy, 48, 145–194.
Ramey, V. A. and S. Zubairy (2018): “Government Spending Multipliers in Good Times
and in Bad: Evidence from US Historical Data,” Journal of Political Economy, 126, 850–901.
Riboni, A. and F. J. Ruge-Murcia (2010): “Monetary policy by Committee: Consensus,
Chairman dominance, or simple majority?” Quarterly Journal of Economics, 125, 363–416.
——— (2022): “The power of the Federal Reserve Chair,” International Economic Review.
Romer, C. and D. Romer (1989): “Does Monetary Policy Matter? A New Test in the Spirit
of Friedman and Schwartz,” in NBER Macroeconomics Annual 1989, Volume 4, National
Bureau of Economic Research, Inc, 121–184.
Romer, C. D. and D. H. Romer (2002): “The Evolution of Economic Understanding and
Postwar Stabilization Policy,” NBER Working Paper 9274.
——— (2004): “A New Measure of Monetary Shocks: Derivation and Implications,” American
Economic Review, 94, 1055–1084.
——— (2010): “The Macroeconomic Effects of Tax Changes: Estimates Based on a New
Measure of Fiscal Shocks,” American Economic Review, 100, 763–801.
Sargent, T. J. (1979): “Estimating Vector Autoregressions Using Methods not Based on
Explicit Economic Theories,” Quarterly Review, 3.
Sims, C. A. and T. Zha (2006): “Were There Regime Switches in US Monetary Policy?”
American Economic Review, 96, 54–81.
Wolf, C. K. (2023): “Fiscal Stimulus and the Systematic Response of Monetary Policy,” AEA
Papers and Proceedings, forthcoming.
Woodford, M. (2011): “Simple Analytics of the Government Expenditure Multiplier,” Amer-
ican Economic Journal: Macroeconomics, 3, 1–35.
ECB Working Paper Series No 2851
41

Appendix A New Keynesian model
A.1 Equilibrium dynamics
We derive equation (2.3). Denoting by lower case letters (log) deviations from steady state, we
obtain the following three equilibrium conditions for the model described in Section 2: A New
Keynesian Phillips Curve
π
t
= βE
t
[π
t+1
] + λ
φ +
1
1 − γ
y
t
−
λγ
1 − γ
x
s
t
− λ(1 + φ)x
a
t
, (A.1)
where λ = (1 − θ)(1 − βθ)/θ, a dynamic IS equation
y
t
= E
t
[y
t+1
] − (1 − γ)(i
t
− E
t
[π
t+1
]) + γ (1 − ρ
s
) x
s
t
, (A.2)
and the Taylor rule
i
t
=
e
ϕ
t
π
t
, (A.3)
where
e
ϕ
t
= ϕ + ϕ
t
follows
ϕ
t
= ρ
ϕ
ϕ
t−1
+ ζ
s
ε
s
t
+ ζ
a
ε
a
t
+ η
t
, |ρ
ϕ
| < 1.
We assume the macroeconomic shocks (ε
a
t
, ε
s
t
) and the exogenous shifter η
t
are mutually inde-
pendent and identically distributed over time. We first rewrite the IS equation by plugging in
the Taylor rule and Phillips Curve to obtain
y
t
=
1 − γ
1 + λ (φ(1 − γ) + 1) ϕ
t
E
t
[y
t+1
]
1 − γ
+ (1 − βϕ
t
)E
t
[π
t+1
]
+
γ
1 − γ
(ϕ
t
λ + (1 − ρ
s
)) x
s
t
+ ϕ
t
λ (φ + 1) x
a
t
(A.4)
Combining (A.1) and (A.4), the model dynamics follow Y
t
= A(ϕ
t
) E
t
[Y
t+1
] + B(ϕ
t
) X
t
, with
Y
t
= (y
t
, π
t
)
′
, X
t
= (x
s
t
, x
a
t
)
′
and A(ϕ
t
), B(ϕ
t
) depending only on model parameters. A first-
order approximation around ϕ
t
= 0 yields
Y
t
= AE
t
[Y
t+1
] + BX
t
+
∂
ϕ
t
AE
t
[Y
t+1
] + AE
t
[∂
ϕ
t
Y
t+1
] + ∂
ϕ
BX
t
ϕ
t
, (A.5)
where A ≡ A(0), B ≡ B(0), ∂
ϕ
t
(·) denotes a derivative with respect to ϕ
t
that is evaluated at
ϕ
t
= 0, and we omit the approximation error. Consider the guess for the law of motion that
reads Y
t
= A + BX
t
+ CX
t
ϕ
t
+ Dϕ
t
. It is straightforward to verify that the guess satisfies (A.5).
The coefficients of the guess depend on the deep structural parameters of the model and can be
determined via the method of undetermined coefficients. This fully describes the approximate
state-dependent model dynamics with respect to systematic monetary policy ϕ
t
and provides
equation (2.3) in the main text, where a = A
1
, b
s
= B
11
, b
a
= B
12
, and analogously for C and
D. In the special case ρ
s
= ρ
a
= ρ
ϕ
= 0, the coefficients in (2.3) are given by (2.6).
ECB Working Paper Series No 2851
42
A.2 Identification
We next describe the identification results in Section 2 in some more detail. The key step is to
determine the residual in the state-dependent local projection (2.4). Using (2.2), (2.3), and the
laws of motion for x
s
t
and x
a
t
, we obtain
v
h
t+h
= F
h
· z
h
t+h
,
where F
h
is a coefficient vector and z
h
t+h
is the following vector of variables:
z
h
t+h
=
h
x
s
t−1
, {ε
s
t+i
}
h
i=1
, x
s
t−1
ϕ
t+h
, ε
s
t
{η
t+i
}
h
i=1
, ε
s
t
{ε
s
t+i
}
h
i=1
, ε
s
t
{ε
a
t+i
}
h
i=1
,
{ε
s
t+i
ϕ
t+h
}
h
i=1
, {η
t+i
}
h
i=1
, {ε
a
t+i
}
h
i=1
, x
a
t+h
, x
a
t+h
ϕ
t+h
i
′
,
where {ε
s
t+i
}
h
i=1
denotes the vector of all ε
s
t+i
for i = 1 through i = h, and analogously for all
terms in braces. Defining the vector of regressors (excluding the intercept) in (2.4) by
X
t
=
h
ε
s
t
, ε
s
t
ϕ
t
, ϕ
t
i
′
,
a sufficient condition for the consistency of the OLS estimates of (β
h
, γ
h
, δ
h
) requires
E[X
t
(z
h
t+h
)
′
] = 0,
where 0 denotes a zero matrix with conforming dimension. In general, this orthogonality condi-
tion is satisfied if ζ
s
= ζ
a
= 0.
We next turn to the IV estimator of (β
h
, γ
h
, δ
h
). Consider an instrument ϕ
IV
t
with the following
properties:
E[ϕ
IV
t
ε
s
t+i
] = E[ϕ
IV
t
ε
a
t+i
] = 0 ∀i
E[ϕ
IV
t
η
t
] ̸= 0, E[ϕ
IV
t
η
t+i
] = 0 ∀i ̸= 0
Defining as instrument vector
Q
t
=
h
ε
s
t
, ε
s
t
ϕ
IV
t
, ϕ
IV
t
i
′
,
consistency of the IV estimator requires
E[Q
t
(z
h
t+h
)
′
] = 0.
This condition is generally satisfied in our model. Hence, the IV estimator consistently estimates
(β
h
, γ
h
, δ
h
) even in the absence of strong exogeneity assumptions for systematic monetary policy
ϕ
t
.
ECB Working Paper Series No 2851
43

Appendix B Data
This section explains the data sources and data preparation procedures used to compile the
data set used in our analysis.
B.1 Narrative account
We use Istrefi’s (2019) data set which is a panel of FOMC members where the time dimension
refers to FOMC meetings. The panel contains the policy preferences of voting members at each
FOMC meeting for 1960-2023. We code the numerical variable Hawk
iτ
∈ [−1, 1] as explained
in the main text.
Accounting for missing data. The information on some FOMC members during the first
five years of our sample is relatively sparse, leaving us with many unclassified FOMC members
in this period. For example, we observe the preferences for only 115 out of 195 member-meeting
pairs in 1960. The share of observed preferences increases gradually. From 1966 onward, we
reach an average share of 88 percent which is satisfactory. Before 1966 we employ the following
imputation scheme. We assume that the unobserved preferences coincide with the first observed
preference of the respective FOMC member. Formally, let t(i) be the first meeting for which
Hawk
iτ
is not missing for member i. Then, we assume that Hawk
iτ
= Hawk
it(i)
for all τ < t(i).
Accounting for short-term substitutes. Occasionally, voting FOMC members do not
attend the meetings but instead, get replaced by a substitute. This introduces noise in the
data under the assumption that the short-term substitutes act in the best interest of the person
that is substituted. This assumption is appropriate as the short-term substitutes are often
direct subordinates of the original voting member. Thus, we explicitly assume that short-term
substitutes act as if the original member attended the meeting if the following criteria hold:
(i) the substitution period is not longer than 6 months when the substitute is from the same
Federal Reserve bank, (ii) the substitution period is not longer than 3 months if the substitute
is not from the same Federal Reserve bank, (iii) the substitution does not take place at the
beginning or the end of a rotation cycle within a rotation group.
36
Formally, let Hawk
iτ
be
the preference of a substitute that appears in meeting τ. Then, we set Hawk
iτ
= Hawk
jτ −k
where j is the original member and we use the most recent observation of her policy preferences
from meeting τ − k. However, many times it holds that the preferences of the substitute and
the original voter coincide which implies that the procedure above does not change the data.
It turns out that we change less than 1 percent of the data points, and that our results are
insensitive to the choices made above.
36
For example, consider the rotation between the Chicago and Cleveland Federal Reserves. Suppose that
the Chicago president had the voting right until meeting τ and the Cleveland president thereafter. If Chicago
exercises the voting right in τ + 1 on behalf of Cleveland, we would not conduct any corrections because it is not
clear whether the Chicago president acts in the best interest of the Cleveland president or not.
ECB Working Paper Series No 2851
44

B.2 Macroeconomic data
All aggregate series are explained below. If applicable, we put the data identifiers of the respec-
tive data source in parentheses.
Ramey and Zubairy (2018). We take the series for potential output (rgdp_pott6 ), real
GDP (rgdp), nominal government spending (ngov), the GDP deflator (pgdp) and the military
spending news shock (news) from the replication package of Ramey and Zubairy (2018). We
follow their data preparation steps to create the aggregate series as in their paper.
37
FRED Economic Data. We use headline CPI (CPIAUCSL) and CPI core (CPILFESL)
inflation defined as the year-over-year growth rate of the respective price index, and the effective
federal funds rate (DFF). The 10-year treasury market yield (DGS10 ) starts only in 1962q1
and is therefore combined with the very same variable from Romer and Romer (2010) to obtain
a series that starts in 1960q1. Similarly, we use the 1-year market yield from Liu and Wu (2021)
and impute the first four observations (1960q1 to 1960q4) with a similar 1-year treasury market
yield from Fred (DTB1YR). Personal consumption expenditures (PCE), gross private domestic
investment (GPDI ), and federal government defense expenditures (FDEFX ) is divided by the
GDP deflator and by real potential GDP, both taken from Ramey and Zubairy (2018), see
above. We compute non-military government spending by subtracting the defense spending
from total government spending. Variables are averaged to quarterly frequency, if applicable.
Livingston survey. We use inflation expectations from the Livingston survey. Our measure
of inflation expectation is the annualized expected growth rate of CPI forecasts from 6 to 12
months ahead. Because the survey is biannual, we assume that inflation expectations remain
constant in quarters in which no new data is available. Formally, we let π
e
t
= π
e
t−1
, whenever
there is no survey conducted in quarter t. The (ex-ante) real rates are computed as i
r
t
= i
n
t
− π
e
t
where i
n
t
is a nominal rate of interest.
Additional series. The validation exercise in Appendix E is based on forecasts from the
Fed’s Greenbook. We use the average of the one- and two-quarter ahead inflation forecast,
following Coibion and Gorodnichenko (2011). We use additional series for some exercises in our
sensitivity analysis. For the Blanchard and Perotti (2002) shock, we account for anticipation
in government spending by including the one-quarter projected growth rate of government
spending from Ramey’s (2011) data.
38
As an additional control variable we use the primary
surplus (svt_q) from Cochrane (2022), seasonally adjusted via X-13 ARIMA-SEATS procedure
from the U.S. Census Bureau.
37
The fiscal shock is computed as news
t
/(pgdp
t−1
× rgdp_pott6
t−1
) × 100. Detrended real GDP is
rgdp
t
/rgdp_pott6
t
× 100 and detrended real government spending is ngov
t
/(pgdp
t
× rgdp_pott6
t
) × 100.
38
The survey of professional forecasters provides the government spending forecasts only from 1981q3 onward.
Thus, Ramey (2011) imputes the government spending forecasts with defense spending forecasts to extend the
sample until 1968q4.
ECB Working Paper Series No 2851
45

Appendix C Hawk-Dove decompositions
In this section, we propose a decomposition of fluctuations in the aggregate Hawk-Dove balance
Hawk
t
and the FOMC rotation instrument Hawk
IV
t
. We find that the FOMC rotation is a
key source of variation in Hawk
t
. Variation in the instrument Hawk
IV
t
is largely due to the
rotation of incumbent FOMC members.
Decomposition of Hawk
t
. We derive a decomposition of the aggregate Hawk-Dove balance
similar to the aggregate productivity decomposition in Baily et al. (1992). We first rewrite the
aggregate Hawk-Dove balance in equation (3.2) as
Hawk
t
=
X
i∈M
t
s
t
Hawk
it
, s
t
=
1
|M
t
|
. (C.1)
We define a decomposition over p-period changes in the balance:
∆
p
Hawk
t
= Hawk
t
− Hawk
t−p
=
X
i∈M
t
s
t
Hawk
it
−
X
i∈M
t−p
s
t−p
Hawk
it−p
(C.2)
We next partition the set M
t
into the set of “surviving” FOMC members S
t
present in t − p
and t, the set of entering FOMC members E
t
present in t but not in t − p, and the set of exiting
FOMC members X
t
present in t − p but not in t to rewrite:
∆
p
Hawk
t
=
X
i∈S
t
(s
t
Hawk
it
− s
t−p
Hawk
it−p
) +
X
i∈E
t
s
t
Hawk
it
−
X
i∈X
t
s
t−p
Hawk
it−p
=
X
i∈S
t
s
t−p
(Hawk
it
− Hawk
it−p
) +
X
i∈S
t
(s
t
− s
t−p
)Hawk
it
+
X
i∈E
t
s
t
Hawk
it
−
X
i∈X
t
s
t−p
Hawk
it−p
(C.3)
The first term captures changes in preferences of surviving FOMC members, the second term
captures changes in the number of FOMC members, the third term captures entry into the
FOMC, and the last term captures exit from the FOMC.
Finally, we further distinguish between the rotating and non-rotating FOMC members in the
set of entering and exiting FOMC members, denoted E
R
t
, E
N
t
, X
R
t
and X
N
t
to obtain our
decomposition of interest:
∆
p
Hawk
t
=
X
i∈S
t
s
t−p
(Hawk
it
− Hawk
it−p
) +
X
i∈S
t
(s
t
− s
t−p
)Hawk
it
+
X
i∈E
N
t
s
t
Hawk
it
−
X
i∈X
N
t
s
t−p
Hawk
it−p
+
X
i∈E
R
t
s
t
Hawk
it
−
X
i∈X
R
t
s
t−p
Hawk
it−p
(C.4)
The second row captures changes in the aggregate Hawk-Dove balance due to the entry and
exit of rotating FOMC members, while the third row captures the contribution of entry and
exit of non-rotating FOMC members.
ECB Working Paper Series No 2851
46

We use the decomposition of the aggregate Hawk-Dove balance in equation (C.4) to quan-
tify the statistical importance of three factors (corresponding to the three rows of the equa-
tion): intensive-margin changes in preferences, extensive margin changes of non-rotating FOMC
members, and extensive margin changes due to the rotation. We focus on the yearly changes
in the quarterly aggregate Hawk-Dove balance (i.e., we set p = 4) to capture well the changes
due to the annual rotation.
The variance in yearly changes of the aggregate Hawk-Dove balance is 0.083. The variance of
the first term in the first row of (C.4), which captures intensive margin changes of preferences,
corresponds to 9% of the total variance. Changes in the weights, the second term in the
first row, are negligible in size. The variance of the second row of (C.4), capturing extensive
margin changes of non-rotating FOMC members, corresponds to 22% of the total variance.
The variance of the third row of (C.4), capturing extensive margin changes of rotating FOMC
members, corresponds to 53% of the total variance. Finally, the covariances between these terms
account for 15% of the total variance. The results differ little for quarterly changes (p = 1).
Notably, extensive margin changes of rotating FOMC members still account for 52% of the total
variance.
Decomposition of Hawk
IV
t
. Analogously, we propose a decomposition for the FOMC rota-
tion instrument. We first rewrite Hawk
IV
t
in equation (C.7) as
Hawk
IV
t
=
X
i∈R
t
s
R
t
Hawk
it
, s
R
t
=
1
|R
t
|
. (C.5)
After a little algebra, we obtain
∆
p
Hawk
IV
t
=
X
i∈S
R
t
s
R
t−p
(Hawk
it
− Hawk
it−p
) +
X
i∈S
R
t
(s
R
t
− s
R
t−p
)Hawk
it
+
X
i∈E
R
t
s
R
t
Hawk
it
−
X
i∈X
R
t
s
R
t−p
Hawk
it−p
, (C.6)
where S
R
t
denotes the set of surviving rotating FOMC members. Finally, we further distinguish
between the rotating entering FOMC members whose appointments start or end (A), i.e., they
enter for the first time after their appointment as regional FRB president or appear the last
time as such, and incumbent (I) regional FRB presidents, denoted E
RA
t
, E
RI
t
, X
RA
t
, X
RI
t
:
∆
p
Hawk
IV
t
=
X
i∈S
R
t
s
R
t−p
(Hawk
it
− Hawk
it−p
) +
X
i∈S
R
t
(s
R
t
− s
R
t−p
)Hawk
it
+
X
i∈E
RA
t
s
R
t
Hawk
it
−
X
i∈X
RA
t
s
R
t−p
Hawk
it−p
+
X
i∈E
RI
t
s
R
t
Hawk
it
−
X
i∈X
RI
t
s
R
t−p
Hawk
it−p
(C.7)
We use the decomposition of the FOMC rotation instrument in equation (C.7) to quantify
ECB Working Paper Series No 2851
47

the statistical importance of three factors (corresponding to the three rows of the equation):
intensive-margin changes in preferences, extensive margin changes of rotating FOMC members
whose appointment starts or ends, and extensive margin changes of incumbent rotating FOMC
members.
For yearly changes in the rotation instrument, we find that 93% of the variance is due to the
rotation of incumbent members, while 7% is due to appointments starting or ending. All other
variances and covariances are negligible in size. Note that yearly changes mechanically mute the
importance of intensive margin changes, because current rotating FOMC members are typically
not still FOMC members a year later. Therefore, we also study quarterly changes (p = 1).
Intensive margin changes now explain 4% of the variance, appointments account for 23%, and
rotations of incumbent members account for 71%.
Appointments become relatively more important for p = 1 because only every fourth quarter
of ∆
1
Hawk
IV
t
features a rotation. Compared to ∆
4
Hawk
IV
t
for which the rotation affects all
quarters, we mechanically lower the importance of rotations and the overall variance for p = 1.
Appendix D Relation to monetary policy shocks
In this section, we show how empirically identified monetary policy shocks relate to changes in
systematic monetary policy. While the model in Section 2 makes a sharp distinction between
systematic monetary policy (ϕ
t
) and monetary policy shocks (that would enter the Taylor rule as
additive extra terms), empirically identified monetary policy shocks often blur this distinction.
We revisit the seminal identification strategy proposed by Romer and Romer (2004), RR hence-
forth. They identify monetary policy shocks as the residual from a regression of changes in the
target federal funds rate on various Greenbook forecasts. To interpret their regression through
the lens of our model in Section 2, we consider a stylized version of the RR regression
i
t
= ϕ
RR
π
GB
t
+ ε
RR
t
, (D.1)
in which π
GB
t
denotes the Greenbook inflation forecast before a change in monetary policy, and
ε
RR
t
is the RR monetary policy shock.
39
For simplicity, we put estimation and identification
concerns aside. We further assume the following data-generating policy rule
40
i
t
= ϕ
t
π
GB
t
+ ε
m
t
, (D.2)
where ε
m
t
is a true monetary policy shock and systematic monetary policy satisfies ϕ
t
> 1.
Combining this with the RR regression yields the RR shock
ε
RR
t
= (ϕ
t
− ϕ
RR
)π
GB
t
+ ε
m
t
. (D.3)
Hence, the empirical shock ε
RR
t
captures variation in systematic monetary policy ϕ
t
, variation
39
The stylized regression omits any lags or leads from the original regression in Romer and Romer (2004).
This is inconsequential if the DGP features iid fluctuations. We further omit unemployment and output growth
from the original regression, because they are absent from the policy rule in the model.
40
For simplicity, we define the Taylor rule over π
GB
t
, instead of π
t
as in Section 2. The insight in this section
does not change under the original rule, except that ε
RR
t
also depends on the forecast error π
GB
t
− π
t
.
ECB Working Paper Series No 2851
48

in inflation forecasts π
GB
t
, and monetary policy shocks ε
m
t
. The empirical shock captures the
model shock ε
RR
t
= ε
m
t
in the special case when systematic monetary policy is time-invariant.
In general, the empirical shock also captures joint time-variation in systematic monetary policy
ϕ
t
and inflation forecasts π
GB
t
, where the latter naturally depends on the state of the economy.
Finally, high-frequency identified monetary policy shocks may reflect changes in systematic
monetary policy in a similar fashion (Bauer and Swanson, 2023).
41
Appendix E Validation exercise
We use the Hawk-Dove balance and the FOMC rotation instrument to estimate the federal
funds rate (FFR) response to inflation forecasts as a function of the hawkishness of the FOMC.
In support of our identification design, we find that a hawkish FOMC is associated with a more
pronounced hike of the federal funds rate in the face of inflationary pressure. We estimate
a state-dependent local projection specification that is akin to a forward-looking Taylor rule.
Formally, we estimate a set of regressions
F F R
t+h
= α
h
+ β
h
ˆπ
t
+ γ
h
ˆπ
t
(Hawk
t
− Hawk) + ζ
h
Z
t
+ v
h
t+h
, (E.1)
for h = 0, 1, ..., H, and F F R
t+h
and ˆπ
t
denote the federal funds rate and the average of the one-
and two-quarter ahead Greenbook inflation forecast, respectively. The control vector includes
four lags of the federal funds rate and the inflation forecast. The data is at a quarterly frequency
and the sample runs from 1969 to 2008, due to the availability of inflation forecasts and the
reaching of the zero lower bound in 2008.
Figure E.1 presents IV estimates where we use the FOMC rotation instrument interacted with
the inflation forecast as an instrument for the interaction term in the specification above. We
show estimates that are normalized to represent the inflation forecast being one percentage
point above the sample average. The left panel displays the response under the average FOMC
(β
h
). The right panel displays the differential response (γ
h
) when there are 2 more hawks in
the FOMC relative to the average composition.
On average, the FOMC reacts with a federal funds rate hike. The response is statistically
significant at the five percent level for six quarters. The response builds up over time, consistent
with interest rate smoothing. Incidentally, it satisfies the Taylor principle for a prolonged period
of almost 2 years and peaks at 1.48 percentage points. The response turns stronger when the
FOMC is more hawkish, as indicated by the differential effects in Panel (b). The estimates
of the interaction coefficient γ
h
are hump-shaped and peak after 2 years at 0.92 percentage
points. The response is significant at five percent for almost 2 years. This result suggests that a
more hawkish FOMC is associated with a stronger and more persistent federal funds rate hike.
Conversely, a more dovish FOMC implies a substantially weaker response.
Finally, this validation exercise lends itself to assessing the relevance condition of our instrument
41
Consider the high-frequency identified monetary policy shock ε
HFI
t
= i
t
− E
t−∆
[i
t
], where E
t−∆
denotes
expectations shortly before the meeting. Combining the shock with the monetary policy rule in (D.2) yields
ε
HFI
t
= ε
m
t
+ϕ
t
π
GB
t
−E
t−∆
[ϕ
t
π
GB
t
]. Hence, ε
HFI
t
convolutes monetary policy shocks ε
m
t
with changes in systematic
monetary policy ϕ
t
and inflation forecasts π
GB
t
.
ECB Working Paper Series No 2851
49

Figure E.1: FFR response to inflation and the FOMC hawkishness
Average FFR (β
h
) Differential FFR (γ
h
)
Notes: The figure shows responses of the federal funds rate to an inflation Greenbook forecast that is one percentage point
above its sample average, conditional on systematic monetary policy (Hawk
t
). We show IV estimates based on (E.1). The
β
h
captures the responses when Hawk
t
equals its sample average. The γ
h
captures the differential responses when Hawk
t
exceeds the sample average by two hawks. The shaded areas indicate 68% and 95% confidence bands using Newey-West
standard errors.
more formally. We use the weak instruments test from Montiel Olea and Pflueger (2013).
42
We
can reject the null of weak instruments. More formally, we compute p-values for the bias
exceeding 10% percent of the benchmark, see Montiel Olea and Pflueger (2013) for details.
The p-values are bounded from above by 0.055 and are below the 0.05 level at most horizons.
Moreover, for a test of whether the bias exceeds 20%, we can reject the null at 1% for all
horizons.
Overall, we show that the federal funds rate response to inflation correlates positively with the
hawkishness of the FOMC, Hawk
t
. The responses are consistent with our measurement of the
stance of systematic monetary policy and are further in line with Bordo and Istrefi (2023). We
see this result as a validation that our measurement of systematic monetary policy, through
Hawk
t
, captures important aspects of the Federal Reserve’s monetary policy-making.
Appendix F Estimating fiscal multipliers
This section elaborates on how we obtain the fiscal multiplier estimate and on how to conduct
valid inference.
Cumulated local projection. Summing up equation (3.4) for horizon 0 to H yields
H
X
h=0
x
t+j
= ˜α
H
x
+
˜
β
H
x
s
t
+ ˜γ
H
x
s
t
(Hawk
t
− Hawk) +
˜
δ
H
x
(Hawk
t
− Hawk) +
˜
ζ
H
x
Z
t
+ ˜v
H
t+j
, (F.1)
where
˜
β
H
x
=
P
H
h=0
β
h
x
, ˜γ
H
x
=
P
H
h=0
γ
h
x
, and analogously for ˜α
H
x
,
˜
δ
H
x
,
˜
ζ
H
x
. The outcome is
either cumulated GDP or cumulated government spending (G). With this, one can estimate the
42
In our setting with a single endogenous regressor, this test is equivalent to the test by Lewis and Mertens
(2022).
ECB Working Paper Series No 2851
50

numerator and the denominator of the fiscal multiplier from equation (4.1) in one step.
One-step multiplier estimation. We employ an estimation procedure akin to seemingly
unrelated regressions to estimate equation (F.1) for GDP and G in a single step. This allows us
to conduct standard asymptotic inference with respect to the implied fiscal multipliers. First,
we define the regressor matrix w and instrument matrix q where each column is a vector of
data, i.e. w
1·
= (w
11
, .., w
1T
)
′
and T denotes the sample size.
w = (1, s, s(Hawk − Hawk), (Hawk − Hawk), Z)
′
(F.2)
q = (1, s, s(Hawk
IV
− Hawk
IV
), (Hawk
IV
− Hawk
IV
), Z)
′
(F.3)
The associated vector of coefficients is θ
h
x
= (˜α
j
x
,
˜
β
j
x
, ˜γ
j
x
,
˜
δ
j
x
,
˜
ζ
j
x
)
′
. Let us further define W = I
2
⊗w
and Q = I
2
⊗ q where I
2
∈ R
2x2
denotes the identity matrix. Finally, we define the outcome
as X
h
= (Y
h
1
, .., Y
h
T
, G
h
1
, .., G
h
T
)
′
∈ R
2T ×1
, where each entry is given by X
h
t
=
P
h
j=0
x
t+j
, and
Y, G refer to GDP and government spending respectively. The instrumental variable estimate
of Θ
h
= (θ
h
Y
′
, θ
h
G
′
)
′
follows from the standard formula,
ˆ
Θ
h
= (Q
′
W )
−1
Q
′
X
h
. (F.4)
We use Driscoll-Kraay standard errors to allow for serial correlation and cross-correlation
between cumulated GDP and cumulated government spending. The multiplier estimate is
a non-linear function of the estimate
ˆ
Θ
h
. Standard errors can be computed with the delta
method as the above estimation procedure allows to compute an estimate of the full covariance
matrix.
43
Discussion. This procedure has an important advantage compared with the one-step estima-
tion procedure used by Ramey and Zubairy (2018). It admits multiplier estimation in one step
without using the fiscal shocks as an instrument for (cumulated) government spending. This
is important as Ramey and Zubairy (2018) have to use both the military spending shock and
the Blanchard-Perotti shock to obtain a sufficiently strong instrument. Thus, their multiplier
estimates do not only hinge on the exogeneity assumption for the military shocks but also on
the exogeneity assumption for the Blanchard-Perotti shock. Our approach remains valid even
in samples in which the military spending shock has less explanatory power for government
spending. This is crucial when working with the military spending shocks in a sample that
starts after the Korean War (Ramey, 2011).
Appendix G Additional results for Section 4
This appendix contains additional findings discussed in the main text as well as the results of
our sensitivity analysis.
43
Note that the point estimates are identical to the natural plug-in estimator that one obtains when estimating
(F.1) in two-separate regressions.
ECB Working Paper Series No 2851
51

Table G.1: Responses of GDP and government spending, incl. first-stage
GDP responses G responses First-stage results
Regressors (1) (2) (3) (4) (5) (6) (7) (8) (9) (10)
ε
s
t
0.142 0.166 0.185 0.283 0.092 0.140 0.157 0.152 0.050 0.010
(0.096) (0.095) (0.085) (0.130) (0.047) (0.056) (0.051) (0.054) (0.039) (0.007)
ε
s
t
(Hawk
t
− Hawk
t
) -1.672 -3.099 -2.485 -0.873 -0.342 -0.401 -0.030 0.220
(0.775) (0.841) (1.433) (1.174) (0.209) (0.258) (0.416) (0.653)
Hawk
t
− Hawk
t
-2.770 -3.698 -4.247 -4.562 -0.593 -0.985 -1.389 -0.948
(1.220) (1.728) (2.216) (2.217) (0.322) (0.650) (1.020) (1.135)
ε
s
t
(Hawk
IV
t
− Hawk
t
IV
) 0.290 -0.019
(0.053) (0.021)
Hawk
IV
t
− Hawk
t
IV
-0.008 0.402
(0.017) (0.042)
ε
s
t−1
0.024 0.057 0.086 0.245 0.044 0.076 0.092 0.124 0.007 0.011
(0.157) (0.216) (0.221) (0.153) (0.033) (0.046) (0.043) (0.043) (0.003) (0.006)
ε
s
t−2
0.110 0.035 0.078 0.150 0.032 0.052 0.063 0.092 -0.012 0.007
(0.125) (0.185) (0.205) (0.160) (0.030) (0.030) (0.041) (0.049) (0.011) (0.008)
ε
s
t−3
0.045 0.036 0.126 0.188 0.038 0.036 0.037 0.073 -0.000 0.008
(0.149) (0.163) (0.153) (0.144) (0.018) (0.028) (0.045) (0.052) (0.006) (0.008)
ε
s
t−4
0.001 0.033 0.152 0.224 0.023 0.037 0.060 0.139 -0.018 0.004
(0.141) (0.125) (0.117) (0.144) (0.022) (0.027) (0.041) (0.038) (0.012) (0.010)
GDP
t−1
1.314 0.777 0.424 0.037 0.033 0.103 0.135 0.124 -0.000 -0.012
(0.182) (0.243) (0.252) (0.282) (0.053) (0.075) (0.100) (0.121) (0.013) (0.017)
GDP
t−2
-0.406 -0.166 -0.110 0.149 0.006 0.060 0.035 0.039 -0.016 0.013
(0.190) (0.209) (0.159) (0.197) (0.054) (0.072) (0.077) (0.094) (0.020) (0.014)
GDP
t−3
-0.240 -0.012 -0.093 0.081 0.062 0.034 0.044 0.084 0.004 -0.005
(0.203) (0.180) (0.223) (0.171) (0.055) (0.068) (0.068) (0.062) (0.016) (0.010)
GDP
t−4
-0.164 -0.440 -0.284 -0.444 -0.103 -0.218 -0.279 -0.355 0.003 -0.026
(0.183) (0.267) (0.313) (0.333) (0.051) (0.095) (0.138) (0.167) (0.007) (0.011)
G
t−1
-0.639 0.012 0.336 0.864 1.340 1.311 1.121 1.138 0.028 -0.073
(0.714) (1.012) (0.909) (0.940) (0.195) (0.241) (0.308) (0.387) (0.022) (0.055)
G
t−2
1.177 0.596 0.194 -0.223 0.008 -0.042 0.078 0.097 0.008 0.062
(0.617) (0.734) (0.602) (0.479) (0.195) (0.220) (0.277) (0.278) (0.039) (0.047)
G
t−3
-0.391 -0.347 -0.233 -0.519 -0.079 -0.106 -0.136 -0.138 0.017 -0.091
(0.651) (0.706) (0.618) (0.491) (0.203) (0.248) (0.273) (0.272) (0.054) (0.042)
G
t−4
0.022 0.020 0.018 0.162 -0.346 -0.308 -0.268 -0.343 -0.039 0.140
(0.920) (0.911) (0.888) (0.791) (0.202) (0.314) (0.437) (0.486) (0.049) (0.060)
Observations 196 196 196 196 196 196 196 196 196 196
R
2
0.577 0.347 0.201 0.138 0.934 0.843 0.730 0.646 0.452 0.547
R
2
excl. IVs 0.036 0.154
F-statistic 16.398 4.243 3.418 2.630 94.688 22.683 11.316 15.287 43.691 28.077
F-statistic excl. IVs 4.935 5.804
Notes: The table shows responses of real GDP and real government spending (G) to an expansionary military spending
shock, corresponding to one percent of GDP, conditional on systematic monetary policy (Hawk
t
). We show IV estimates
based on the local projection framework (3.4)-(3.5) as specified in Section 4.1. Columns (1) to (4) and (5) to (8) display the
one, two, three, and four-year ahead responses, respectively. Regressor ε
s
t
captures the responses when Hawk
t
equals its
sample average and ε
s
t
(Hawk
t
− Hawk
t
) captures the differential responses. Columns (9) and (10) display the first-stage
results for ε
s
t
(Hawk
t
− Hawk
t
) and (Hawk
t
− Hawk
t
), respectively. The shaded areas indicate 68% and 95% confidence
bands using Newey-West standard errors.
ECB Working Paper Series No 2851
52

Figure G.1: Responses of military spending shocks to systematic monetary policy
(a) Baseline model (δ
h
) (b) Linear model (δ
h
)
Notes: The figure shows responses of the military spending shock to systematic monetary policy (Hawk
t
). We show IV
estimates based on the local projection framework (3.4)-(3.5) as specified in Section 4.1. The δ
h
captures the differential
response when Hawk
t
exceeds the sample average by two hawks. Panel (a) shows the results for our baseline model whereas
Panel (b) shows the results when we restrict β
h
= γ
h
= 0 in the local projection (3.4). The shaded areas indicate 68% and
95% confidence bands using Newey-West standard errors.
Table G.2: Testing for differences across regimes, p-values
Outcome
+2 Hawk
vs.
Average
+1 Hawks
vs.
Average
Average
vs.
+1 Dove
Average
vs.
+2 Doves
Two-year horizon
Multiplier 0.223 0.119 0.102 0.104
GDP (cum) 0.000
G (cum) 0.080
Four-year horizon
Multiplier 0.245 0.122 0.041 0.041
GDP (cum) 0.008
G (cum) 0.448
Notes: The table shows p-values corresponding to statistical tests for whether the fiscal multiplier or its components
are significantly different across monetary regimes (Hawk
t
). The tests are based on the multiplier estimates reported in
Table 2 in Section 4.4, using Driscoll-Kraay standard errors, see Appendix F for details.
ECB Working Paper Series No 2851
53

Figure G.2: Responses of GDP and government spending, OLS
(a) Average GDP (β
h
) (b) Average G (β
h
)
(c) Differential GDP (γ
h
) (d) Differential G (γ
h
)
Notes: The figure shows responses of real GDP and real government spending (G) to an expansionary military spending
shock, corresponding to one percent of GDP, conditional on systematic monetary policy (Hawk
t
). We show OLS estimates
based on the local projection framework (3.4) as specified in Section 4.1. The β
h
captures the responses when Hawk
t
equals its sample average. The γ
h
captures the differential responses when Hawk
t
exceeds the sample average by two
hawks. The shaded areas indicate 68% and 95% confidence bands using Newey-West standard errors.
Figure G.3: Cumulated GDP responses for OLS and IV
2-year cumulated response (b) 3-year cumulated response
Notes: The figure shows the cumulative real GDP response to an expansionary military spending shock, corresponding to
one percent of GDP, conditional on systematic monetary policy (Hawk
t
). We show IV and OLS estimates based on the
local projection framework (3.4)-(3.5) as specified in Section 4.1. The displayed estimates are computed as
P
H
h=0
[β
h
+
γ
h
(Hawk
t
− Hawk
t
)] for H = 8 quarters (Panel a) and H = 12 quarters (Panel b).
ECB Working Paper Series No 2851
54

Figure G.4: Weak instrument tests
(a) Montiel Olea and Pflueger (2013) (b) Lewis and Mertens (2022)
Notes: The figure shows p-values for rejecting the null of weak instruments for the responses of real government spending
(G), based on the local projection framework (3.4)-(3.5) as specified in Section 4.1. The Montiel Olea and Pflueger (2013)
test evaluates the null of the bias in γ
h
exceeding a threshold τ. Similarly, the Lewis and Mertens (2022) test evaluates
the null of the ℓ
2
norm of the bias in γ
h
and δ
h
exceeding a threshold τ . For the former, the endogenous regressor Hawk
t
is not tested but directly replaced by its first stage fitted value. The critical values and associated p-values are based on
Newey-West standard errors.
Figure G.5: Differential responses of GDP and government spending, reduced-form
(a) Differential GDP (γ
h
) (b) Differential G (γ
h
)
Notes: The figure shows differential responses of real GDP and real government spending (G) to an expansionary military
spending shock, corresponding to one percent of GDP, conditional on systematic monetary policy (Hawk
t
). We show
reduced-form estimates based on the local projection framework (3.4)-(3.5) as specified in Section 4.1. The γ
h
captures the
differential responses when Hawk
t
exceeds the sample average by two hawks. Moreover, testing whether γ
h
is statistically
significant from zero is equivalent to testing for zero relevance of the instrument, as explained in the main text. The shaded
areas indicate 68% and 95% confidence bands using Newey-West standard errors.
ECB Working Paper Series No 2851
55

Figure G.6: Responses of GDP and government spending, robust inference
(a) Differential GDP (γ
h
) (b) Differential G (γ
h
)
Notes: The figure shows differential responses of real GDP and real government spending (G) to an expansionary military
spending shock, corresponding to one percent of GDP, conditional on systematic monetary policy (Hawk
t
). We show IV
estimates based on the local projection framework (3.4)-(3.5) as specified in Section 4.1. The γ
h
captures the differential
responses when Hawk
t
exceeds the sample average by two hawks. The shaded areas indicate 68% and 95% confidence
bands using Newey-West standard errors. The dashed bands provide 95% confidence sets, robust to weak identification
based on Andrews (2018), constructed via the refined projection method from Chaudhuri and Zivot (2011).
ECB Working Paper Series No 2851
56

Table G.3: Cumulative 4-year government spending multipliers, Robustness
Multipliers across regimes
p-values for differences
across regimes
Specification +2 Hawks Average +2 Doves
+2 Hawks
vs.
+2 Doves
+2 Hawks
vs.
Average
Average
vs.
+2 Doves
Baseline -1.790 1.308 3.095
0.122 0.245 0.041
(2.637) (0.475) (1.162)
BP shock 0.880 1.359 1.735
0.082 0.096 0.068
(1.062) (0.837) (0.698)
Aggregation schemes
Median 0.421 1.412 2.225
0.043 0.065 0.036
(0.568) (0.543) (0.811)
Chair weight -1.676 1.531 3.462
0.070 0.175 0.077
(2.223) (0.661) (1.514)
Swinger weight -1.599 1.260 3.037
0.090 0.179 0.043
(2.165) (0.551) (1.138)
Drop swingers from IV 0.227 1.590 4.069
0.113 0.531 0.380
(2.262) (0.978) (3.113)
Accounting for trends
5-year MA -10.655 1.206 3.551
0.792 0.821 0.220
(53.169) (1.177) (1.966)
10-year MA -4.799 0.779 3.049
0.452 0.556 0.092
(10.138) (0.877) (1.162)
15-year MA -2.114 0.931 2.822
0.146 0.277 0.036
(3.010) (0.426) (0.869)
Accounting for the ZLB
End sample ’08 -2.002 1.299 3.088
0.108 0.225 0.032
(2.672) (0.510) (1.133)
End sample ’07 -3.380 0.911 3.005
0.203 0.343 0.031
(4.499) (0.527) (1.132)
(Table continues on the next page)
ECB Working Paper Series No 2851
57

Table G.3 (continued): Cumulative 4-year government spending multipliers, Robustness
Multipliers across regimes
p-values for differences
across regimes
Specification +2 Hawks Average +2 Doves
+2 Hawks
vs.
+2 Doves
+2 Hawks
vs.
Average
Average
vs.
+2 Doves
Additional controls
Interest rates 0.388 1.251 1.848
0.306 0.327 0.354
(1.272) (0.688) (0.755)
Interest rates,
inflation
0.743 1.254 2.033
0.335 0.315 0.386
(0.873) (0.646) (1.038)
Interest rates,
inflation, surplus
0.661 1.317 2.188
0.379 0.335 0.467
(1.111) (0.855) (1.425)
Non-linear controls
in t -1.043 1.414 2.813
0.208 0.357 0.068
(2.657) (0.554) (1.132)
in t, ..., t − 4 0.333 2.004 3.022
0.340 0.483 0.137
(2.298) (0.637) (1.154)
Notes: The table shows IV estimates of the cumulative fiscal spending multipliers F M
H
(χ) in equation (4.1) for H = 16
quarters. The last three columns show p-values corresponding to statistical tests for whether the fiscal multiplier is
significantly different across monetary regimes (Hawk
t
). The baseline coefficients are estimated using a cumulative version
of the local projection framework (3.4)-(3.5) as specified in Section 4.1. The columns present different states of the Hawk-
Dove balance between “+2 Hawks” (χ = +2/12), “Average” (χ = 0), and “+2 Doves” (χ = −2/12). Driscoll-Kraay
standard errors are in parenthesis, see Appendix F for details. BP shock: The shock is contemporaneous G, conditional
on controls that include four lags of real GDP and real government spending, as well as the projected growth rate of real
government spending. The projected growth rate is taken from the Survey of Professional Forecasters and is available from
1969 onward, which is the start of our sample, see Appendix B. Aggregation schemes: We use three variants of Hawk
t
.
Median: We aggregate the cross-section of FOMC members by the median, instead of the arithmetic average. Chair weight:
We assign the preferences of the Fed Chair twice the weight of an ordinary member when aggregating to Hawk
t
. Swinger
weight: We do not discriminate between swingers and consistent members. Finally, we use an alternative definition of the
instrumental variable Hawk
IV
t
by setting swingers to zero before aggregating to a time series. Accounting for trends: We
use three variants of Hawk
t
where we subtract the backward-looking 5, 10, or 15-year moving average from Hawk
t
prior
estimation. Accounting for the ZLB: We use a sub-sample that ends either in 2008Q4 or 2007Q4 to exclude the ZLB, or
both the ZLB and the Great Recession. Additional controls: We augment the control vector Z
t
gradually by four lags of
treasury yields with 1-year and 10-year maturity, the fed funds rate (interest rates), CPI inflation, and the primary surplus
from Cochrane (2022). Non-linear controls: We augment the control vector Z
t
by interacting the baseline control vector
also with Hawk
t
and instrument these controls accordingly (in t). We further augment the control vector by including
and instrumenting lagged interaction terms, i.e. Hawk
t−i
× C
t−i
with i = 1, ..., 4 and C
t
referring to G, GDP, and ε
s
t
(in
t, ..., t − 4).
ECB Working Paper Series No 2851
58

Table G.4: Cumulative 4-year government spending multipliers, Discrete Hawk-Dove balance
Multipliers across regimes
p-values for differences
across regimes
Specification Hawkish Average Dovish
Hawkish
vs.
Dovish
Hawkish
vs.
Average
Average
vs.
Dovish
Quartiles -6.002 1.727 4.814
0.264 0.460 0.201
(10.343) (0.775) (2.774)
Tertiles -3.481 0.490 2.835
0.336 0.488 0.047
(6.227) (0.772) (1.083)
Notes: The table shows IV estimates of the cumulative fiscal spending multipliers F M
H
(χ) in equation (4.1) for H = 16
quarters. The last three columns show p-values corresponding to statistical tests for whether the fiscal multiplier is
significantly different across monetary regimes (Hawk
t
). The coefficients are estimated using a cumulative version of the
local projection framework (3.4)-(3.5) as specified in Section 4.1. We use two discrete variants of Hawk
t
. We define that
the discrete Hawk
t
equals -1 if Hawk
t
falls below the first quartile or tertile of the distribution of Hawk
t
over time, +1 if
above the highest quartile or tertile, and zero else. The columns present different states of the Hawk-Dove balance between
“Hawkish” (χ within the last quartile or tertile), “Average” (χ between the first and last quartile or tertile) “Dovish” (χ
within the first quartile or tertile).
Appendix H Additional results for Section 5
This appendix contains additional findings discussed in the main text.
ECB Working Paper Series No 2851
59
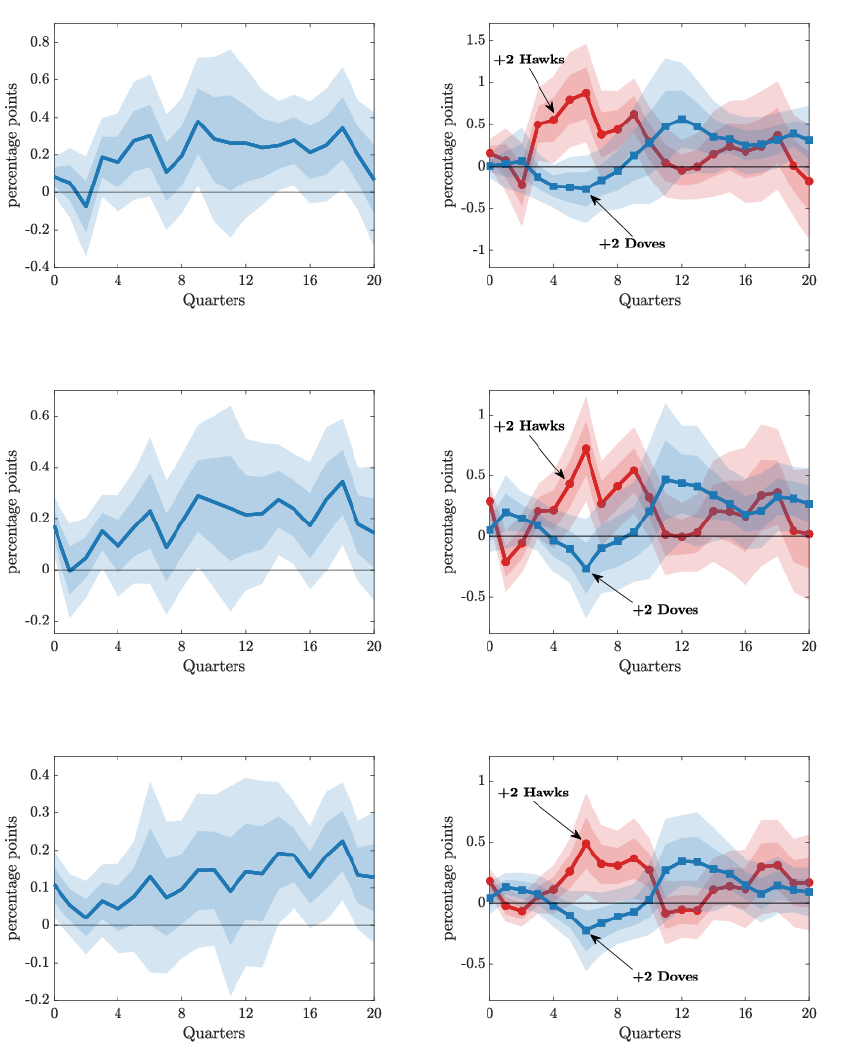
Figure H.1: Responses of nominal interest rates, omit shocks at end of rotation cycle
(a) Average FFR (β
h
) (b) State-dependent FFR (β
h
± γ
h
)
(c) Average 1-year rate (β
h
) (d) State-dependent 1-year rate (β
h
± γ
h
)
(e) Average 10-year rate (β
h
) (f) State-dependent 10-year rate (β
h
± γ
h
)
Notes: The figure shows responses of the federal funds rate (FFR), as well as the 1-year and 10-year treasury yields to an
expansionary military spending shock, corresponding to one percent of GDP, conditional on systematic monetary policy
(Hawk
t
). All outcomes are annualized interest rates. We show IV estimates based on the local projection framework
(3.4)-(3.5) as specified in Section 5.1. The β
h
captures the responses when Hawk
t
equals its sample average. The β
h
± γ
h
shows the state-dependent responses when Hawk
t
exceeds the sample average either by two hawks (+2 Hawks) or by two
doves (+2 Doves). The shaded areas indicate 68% and 95% confidence bands using Newey-West standard errors. We set
the military spending shocks occurring in Q3 or Q4 to zero.
ECB Working Paper Series No 2851
60

Figure H.2: Responses of GDP and government spending, omit shocks at end of rotation cycle
(a) Average GDP (β
h
) (b) State-dependent GDP (β
h
± γ
h
)
(c) Average G (β
h
) (d) State-dependent G (β
h
± γ
h
)
Notes: The figure shows responses of real GDP and real government spending (G) to an expansionary military spending
shock, corresponding to one percent of GDP, conditional on systematic monetary policy (Hawk
t
). We show IV estimates
based on the local projection framework (3.4)-(3.5) as specified in Section 4.1. The β
h
captures the responses when Hawk
t
equals its sample average. The β
h
± γ
h
shows the state-dependent responses when Hawk
t
exceeds the sample average
either by two hawks (+2 Hawks) or by two doves (+2 Doves). The shaded areas indicate 68% and 95% confidence bands
using Newey-West standard errors. We set the military spending shocks occurring in Q3 or Q4 to zero.
ECB Working Paper Series No 2851
61

Figure H.3: Responses of real interest rates
(a) Average real FFR (β
h
) (b) State-dependent real FFR (β
h
± γ
h
)
(c) Average real 1-year rate (β
h
) (d) State-dependent real 1-year rate (β
h
± γ
h
)
(e) Average real 10-year rate (β
h
) (f) State-dependent real 10-year rate (β
h
± γ
h
)
Notes: The figure shows responses of the real federal funds rate (FFR), as well as the 1-year and 10-year real treasury yields
to an expansionary military spending shock, corresponding to one percent of GDP, conditional on systematic monetary
policy (Hawk
t
). We show IV estimates based on the local projection framework (3.4)-(3.5) as specified in Section 5.1.
All outcomes are annualized ex-ante real interest rates which we compute as nominal rate minus one-year ahead inflation
expectations according to the Livingston Survey, see Appendix B for details. The β
h
captures the responses when Hawk
t
equals its sample average. The β
h
± γ
h
shows the state-dependent responses when Hawk
t
exceeds the sample average
either by two hawks (+2 Hawks) or by two doves (+2 Doves). The shaded areas indicate 68% and 95% confidence bands
using Newey-West standard errors.
ECB Working Paper Series No 2851
62

Figure H.4: Decomposing the GDP response, private spending
(a) Average consumption (β
h
) (b) State-dependent consumption (β
h
± γ
h
)
(c) Average investment (β
h
) (d) State-dependent investment (β
h
± γ
h
)
Notes: The figure shows responses of real private consumption and real private investment to an expansionary military
spending shock, corresponding to one percent of GDP, conditional on systematic monetary policy (Hawk
t
). We show IV
estimates based on the local projection framework (3.4)-(3.5) as specified in Section 4.1. The β
h
captures the responses
when Hawk
t
equals its sample average. The β
h
± γ
h
shows the state-dependent responses when Hawk
t
exceeds the sample
average either by two hawks (+2 Hawks) or by two doves (+2 Doves). The shaded areas indicate 68% and 95% confidence
bands using Newey-West standard errors. We modify the control vector to include four lags of consumption, investment,
and government spending, as well as the shock and a residual component of GDP, which we compute as GDP minus
consumption, investment, and government spending.
ECB Working Paper Series No 2851
63

Figure H.5: Decomposing the GDP response, government spending
(a) Average non-military G (β
h
) (b) State-dependent non-military G (β
h
± γ
h
)
(c) Average military G (β
h
) (d) State-dependent military G (β
h
± γ
h
)
Notes: The figure shows responses of real government spending (for military and non-military purposes) to an expansionary
military spending shock, corresponding to one percent of GDP, conditional on systematic monetary policy (Hawk
t
). We
show IV estimates based on the local projection framework (3.4)-(3.5) as specified in Section 4.1. The β
h
captures the
responses when Hawk
t
equals its sample average. The β
h
± γ
h
shows the state-dependent responses when Hawk
t
exceeds
the sample average either by two hawks (+2 Hawks) or by two doves (+2 Doves). The shaded areas indicate 68% and
95% confidence bands using Newey-West standard errors. We modify the control vector to include four lags of military and
non-military government spending as well as the shock and real GDP.
ECB Working Paper Series No 2851
64

Acknowledgements
An earlier version of this paper was titled “Systematic Monetary Policy and the Effects of Government Spending.”
We thank Francesco Fusari, Karel Mertens, Alexander Meyer-Gohde, and Filippo Palotti for insightful discussions, and Klaus Adam,
Regis Barnichon, Antoine Camous, Antonio Ciccone, John Cochrane, Davide Debortoli, Refet Gürkaynak, Peter Karadi, Michael
McMahon, Evi Pappa, Morten Ravn, Jon Steinsson and Christian Wolf, as well as participants at various seminars and conferences for
helpful comments. Lukas Hack and Matthias Meier acknowledge financial support from the German Research Foundation (DFG)
through CRC TR 224 (Project C05). Matthias Meier acknowledges financial support from the UniCredit & Universities Foundation.
The views expressed in this article are solely the responsibility of the authors, and should not be interpreted as reflecting the views of
the Banque de France or the Eurosystem.
Lukas Hack
University of Mannheim, Mannheim, Germany; email: lukas.hack@uni-mannheim.de
Klodiana Istrefi
European Central Bank, Frankfurt am Main, Germany; Centre for Economic Policy Research, London, United Kingdom;
email: klodiana.i[email protected]pa.eu
Matthias Meier
University of Mannheim, Mannheim, Germany; email: m.meier@uni-mannheim.de
© European Central Bank, 2023
Postal address 60640 Frankfurt am Main, Germany
Telephone +49 69 1344 0
Website www.ecb.europa.eu
All rights reserved. Any reproduction, publication and reprint in the form of a different publication, whether printed or produced
electronically, in whole or in part, is permitted only with the explicit written authorisation of the ECB or the authors.
This paper can be downloaded without charge from www.ecb.europa.eu, from the Social Science Research Network electronic library or
from RePEc: Research Papers in Economics. Information on all of the papers published in the ECB Working Paper Series can be found
on the ECB’s website.
PDF ISBN 978-92-899-6216-2 ISSN 1725-2806 doi:10.2866/34644 QB-AR-23-088-EN-N
