
The Coalition’s Record on Housing: Policy,
Spending and Outcomes 2010-2015
Rebecca Tunstall
Working Paper 18
January 2015

2
WP18 The Coalition’s Record on Housing: Policy, Spending and Outcomes 2010-2015.
Acknowledgements
The author would like to thank Kathleen Kelly, Stuart Lowe, Ruth Lupton, Bert Provan, Rachael Takens-
Milne, David Utting, Sharon Witherspoon and staff at the Centre for Housing Policy at the University of
York for their comments on drafts of this paper.
The paper draws on Office for National Statistics (ONS) statistics which are subject to Crown copyright
and are reproduced under the Open Government Licence v.3.0.

3
WP18 The Coalition’s Record on Housing: Policy, Spending and Outcomes 2010-2015.
Contents
Summary .................................................................................................................................................... 5
1. Introduction .......................................................................................................................................... 8
2. The Coalition’s housing policy goals.................................................................................................. 13
The Coalition Agreement ................................................................................................................... 13
The Localism Act 2011 ...................................................................................................................... 15
Laying the Foundations 2011 ............................................................................................................ 16
The Welfare Reform Act 2012 ........................................................................................................... 17
Other policies .................................................................................................................................... 19
Summary: The Coalition’s orientation towards housing .................................................................... 20
3. Spending on housing ......................................................................................................................... 24
How national spending changes affected UK nations, regions and local government ...................... 30
UK government spending on housing benefit, 2009/10-2013/14....................................................... 32
Summary ........................................................................................................................................... 34
4. Outputs .............................................................................................................................................. 35
Impacts on “Increasing the number of available homes” ................................................................... 36
Impact on “helping people to buy a home” ........................................................................................ 38
Results on “Improving the rented sector”........................................................................................... 39
Impact on “Simplifying the welfare system and making sure work pays” .......................................... 40
Impact on “Providing housing support for older and vulnerable people” ........................................... 41
Summary ........................................................................................................................................... 42
5. Policy outcomes ................................................................................................................................ 43
Housing affordability .......................................................................................................................... 43
Homelessness ................................................................................................................................... 45
The effect of policy on different social groups ................................................................................... 46
6. Conclusions ....................................................................................................................................... 48
References ............................................................................................................................................... 51
List of Boxes
Box 1: Housing and housing-linked policy goals in the Coalition Agreement ........................................... 14
Box 2: Housing and housing-linked policy goals in the Localism Act 2011 .............................................. 15
Box 3: Additional policy in the Laying the Foundations housing strategy document, 2011 ...................... 16
Box 4: Housing-linked policy in the Welfare Reform Act 2012 ................................................................. 18
Box 5: Summary of Coalition housing and housing-linked policy goals and the departments responsible
for achieving them .................................................................................................................................... 22
Box 6: Key DCLG business plan indicators for housing policy in England ............................................... 22

4
WP18 The Coalition’s Record on Housing: Policy, Spending and Outcomes 2010-2015.
List of Figures
Figure 1: UK ‘housing and community amenities’ expenditure (including housebuilding) grew rapidly
under Labour, 1997/98-2009/10 in real terms (2009/10 prices), £bn ....................................................... 10
Figure 2: UK government housing and community amenities expenditure dropped by 35% under the
Coalition 2009/10-2013/14 in real terms (at 2009/2010 prices), £bn…………………………………..25
Figure 3: DCLG’s capital budgets for England dropped by 54% 2009/10-2014/15 in real terms (2009/10
prices), £bn ............................................................................................................................................... 27
Figure 4:UK government ‘housing and community amenities’ expenditure dropped by 35% 2009/10-
2013/14 in real terms (at 2009/2010 prices), £bn ..................................................................................... 28
Figure 5:UK ‘housing development’ expenditure (mainly for building social housing) dropped by 44%
2009/10-2012/13 in real terms (at 2009/10 prices), £bn ........................................................................... 29
Figure 6: UK ‘Housing and community amenities’ expenditure cuts were concentrated on England
(expenditure in the nations of the UK, 2007/08-2011/12, real terms, (2009/10 prices), £ per head) ........ 30
Figure 7: ‘Housing and community amenities’ expenditure per person fell particular sharply in the North
East and London (expenditure in the regions of England the UK, 2007/08-2011/12, real terms (2009/10
prices), £ per head) .................................................................................................................................. 31
Figure 8: UK housing benefit spending grew by 9% in real terms 2009/10-2012/13 (at 2009/10 prices),
£bn ............................................................................................................................................................ 32
Figure 9: UK housing spending continued to switch from housing development to housing benefit
(spending on sub-categories within ‘housing and community amenities’ and ‘housing: social protection’),
UK, 2008/09-2012/13, in real terms (2009/10 prices), £bn ....................................................................... 33
Figure 10: UK house building completions fell by 8% 2009/10-2013/14, although house building starts
increased (see below), suggesting a new trend ....................................................................................... 36
Figure 11: Affordability for home buyers did not improve in England 2010-2013 (ratios between median
house prices and median income and between lower quartile prices and lower quartile income) ........... 43
Figure 12: The number of households accepted as unintentionally homeless and in priority need in
England grew by 26% 2010-2014 ............................................................................................................ 46
Figure 13: The number of households accepted as homeless and now living in temporary
accommodation in England grew by 14% 2010-2014 .............................................................................. 46
Table
Table 1: Progress on DCLG business plan indicators for housing policy in England under the
Coalition……………………………...…………………………………………………………………………….35

5
WP18 The Coalition’s Record on Housing: Policy, Spending and Outcomes 2010-2015.
Summary
Coalition housing policy changes have all further reduced the extent of UK central government involvement
in housing, the ‘wobbly pillar’ of the welfare state, and some have reduced the extent of contributions by
the public sector in general. However they have certainly affected the ability of the Coalition both to achieve
its immediate housing policy goals and to address structural issues, including insufficient supply and
systemic risks.
The Coaltion has set some important precedents including devolution in the planning system, setting
housing association rents above traditional ‘social rent’ levels, undertaking social housing development
without public subsidy, ending the assumption of security of tenure for council tenants, and setting housing
benefit at sub-cost levels, leaving tenants with ‘shortfalls’.
Athough there have been no major changes in homelessness policy, Coalition changes have weakened
the two main housing elements of the UK’s welfare state ‘safety net’, social housing and housing benefit,
transferring risk to individual households and to some extent to social landlords.
In spend terms, helping tenants in existing homes and their landlords via housing benefit, rather than
supporting new house building, already dominated total government expenditure on housing when the
Coalition took power (unless tax concessions to owners and landlords are taken into account). The
Coalition continued the trend of shifting government expenditure from new development to housing benefit.
Despite attempts to reduce housing benefit eligibility, and some savings from individual reforms, total
housing benefit expenditure increased by 9% 2009/10-2012/13.
In contrast:
All other forms of government spending on housing in the UK were cut by 35% in real terms
2009/10-2012/13
Expenditure on new house building was cut by 44% in real terms 2009/10-2012/13
DCLG’s revenue budgets (which support spending by English local authorities on housing, such
as services to homeless people, housing-linked support for vulnerable people and regulation of
the private rented sector, as well as other services) for England dropped by at least 41%
2009/10-2014/15 in real terms
DCLG capital budgets for England were cut by 54% 2009/10-2014/15 in real terms, reducing the
options for local authorities to devote capital resources to housing provision.
Thus housing has contributed more than ‘its share’ to deficit reduction which the Coalition’s first housing
minister required. These particularly sharp cuts were another very marked break with the Labour era. In
fact budget cuts for DCLG and for housing and local government in England 2010-2014 under the
Coalition were equivalent in scale to the budgetary transitions immediately after 1945, when the UK
government was withdrawing at speed from its war footing (Taylor-Gooby 2012).
The one major exception to the spending cuts on housing was the boost given to housing purchase,
development and lending from 2012 through Help to Buy, although this still left spending below historic
levels.
Cuts were concentrated in England, and felt much less in the nations of the UK, most of which already
had higher funding per head than England.

6
WP18 The Coalition’s Record on Housing: Policy, Spending and Outcomes 2010-2015.
Despite the cuts, looking at the seven specific housing indicators for England set out in the DCLG business
plan (detailed in Appendix 2) the Coalition government was able to show progress on five: The first four
relate to house building starts and completions:
In relation to completions although the number of home completions fell, the number of new home
starts increased very slightly 2009/10-2012/13, by 3% across the UK and by 8% in England. There
was then a big jump which meant an overall 40% increase in England 2009/10-2013/14. This
appeared to be linked to the “Help to Buy” programme providing subsidy to first time buyers
(described more below) and to improving economic conditions generally.
the number of affordable housing starts also jumped, although not as much (23%). This was the
opposite effect to what might be expected from reduced government support, although it was a
very short term effect and in an improving economic climate.
Turning to the other indicators:
The average SAP energy efficiency rating of homes improved slightly, through the effects of
government schemes but also the activities of owners.
There was a slight increase in the already high proportion of planning applications receiving assent,
although the numbers of applications actually made were low compared to historic patterns.
Finally, the number of households in temporary accommodation grew by 14%, despite the DCLG
business plan intention to see a reduction. The number of households accepted by local authorities
as homeless and in priority need also grew (26%), as did the number of people counted as street
homeless (37%).
Nevertheless, considering the Coalition's broader housing policy goals, it has had no significant and
unambiguous successes.
The Coalition’s average new home production is still below that of the previous government, and
does not constitute a major advance on structural undersupply. Questions remain: can this recent
increase in development be significantly accelerated, because absolute numbers of additional
homes are still well below acknowledged needs, and can this increasebe sustained over several
years, to meet the backlog of need.
In addition, it is not evident that this increase is being achieved in a cost-effective way and one that
does not increase systemic risks. Help to Buy is intended to be temporary, and, arguably, runs the
risk of exacerbating long-term structural issues like affordability problems and high and potentially
volatile prices. In addition, the nation’s social landlords have finite supplies of capital and borrowing
ability to use to build homes without government support, and beyond that would put themselves
and their tenants at risk. These measures indicate that the new house building achieved was not
sufficient alone to prevent the most serious implications of weak supply and unaffordability
problems getting worse. In terms of the affordability of house purchase, price to income ratios for
home buyers have not improved, although Help to Buy and the actions of lenders have eased
access for some by reducing deposit requirements.
More generally, the proportion of households spending more than a third of their income on
housing, a standard measure of affordability, has been stable at about 14%, or one in seven. The

7
WP18 The Coalition’s Record on Housing: Policy, Spending and Outcomes 2010-2015.
amount of ‘affordable’ housing available is steady, but Coalition precedents mean it is becoming
less ‘affordable’. Home ownership has continued to decline in relation to other tenures.
With reduced regulation and reduced funding, the Coalition did not have the policy tools to
improve the quality of the rental sector. Social housing reforms have created precedents which
markedly reduced the housing element of the welfare state safety net.
The overall impact of welfare reform, rising social housing rents and increased use of the private
rented sector on work incentives and employment rates is ambiguous. However, housing benefit
reforms have also reduced the housing element of the welfare safety net.
Older people have been protected from welfare reform. Otherwise it appears that older and
more vulnerable people are less rather than more like to receive housing related support they
need under the Coalition, due to budget cuts, although relevant data sources have been
cancelled.
The Coalition undertook to ensure that richer people would make a greater contribution to
deficit reduction than poorer people (HM Treasury. 2010). However, most of the effects of
Coalition housing policy appear to be at best neutral between income groups, and at worst
markedly regressive. Some groups have gained including people with flexible rate mortgages,
those in areas where housing prices have recovered and grown, some of those taking up Help
to Buy and larger developers.
By 2014, towards the end of the Coalition government term, the structural problems problems in
the housing system, acknowledged by the Coalition, remained unresolved.
Given continued plans for fiscal constraint by all major parties, and housing’s continuing vulnerable
position, it would be difficult for future governments to fully reverse Coalition budget reductions and
consequent policy changes.

8
WP18 The Coalition’s Record on Housing: Policy, Spending and Outcomes 2010-2015.
1. Introduction
This is one of a series of papers examining aspects of the social policy record of the Conservative/Liberal
Democrat Coalition in England from 2010-15, with a particular focus on poverty, inequality and the
distribution of social and economic outcomes. The papers follow a similar but smaller set covering
Labour’s record from 1997-2010, published in 2013. The current series follows the same format as the
earlier papers. Starting with a brief assessment of the situation the Coalition inherited from Labour, the
papers move to a description of the Coalition’s aims (as discerned from manifestos, the Coalition
Agreement and subsequent policy statements) and the policies enacted. The papers then describe trends
in spending on the area under consideration, and an account of what was bought with the money expended
(inputs and outputs). Finally, they turn to outcomes, and a discussion of the relationship between policies,
spending and outcomes, so far as this can be determined.
Housing differs in some ways from the other policy areas examined by the series. Housing has been
described as “the wobbly pillar” under the welfare state (Torgerson 1987), because of the partial extent to
which it has ever been taken over as a responsibility of government and of social policy. The private and
voluntary sectors play a substantial role in all aspects of housing policy, including finance raising, decision-
making and even in regulation (through self-regulation). Further, housing devolution and privatisation have
played a substantial role in moves to roll back the role of the state (eg Harloe 1995, Kemeny 2001,
Hodkinson and Robbins 2013). Thus a full examination of housing policy may incorporate reviewing the
policies affecting local government, private and voluntary sector organisations (Lupton et al. 2013a).
Housing is also ‘wobbly’ in the sense that as a capital-intensive and non-statutory area of expenditure, it
is at particular risk of cuts of central and local budgets in times of fiscal withdrawal.
In addition, housing is unusual because of the way in which it was implicated as amongst the causes of
the Global Financial Crisis, through securitised mortgages in the USA. Peoples’ behaviour toward their
housing assets played a role in the shape of the on-going downturn in the UK. From 2007, prices fell and
the number of sales transactions reduced: “The depressed housing market is, of course, one of the
contributors to the downturn in household consumption” (Pawson and Wilcox 2013 p47). From 2009, home
owners with mortgages were ‘saving’ by paying down their mortgages, rather than withdrawing equity from
their homes to fund consumption, as they had been doing in the early 2000s, which amounted to “a huge
retraction of economic stimulus” (Pawson and Wilcox 2013 p47).
The boundaries of ‘housing policy’ are also particularly blurred: policy on new housing development
extended into planning policy more broadly; policy on housing finance and encouragement of home
ownership extends into financial services and macroeconomic policy; policy on housing affordability and
low cost rental housing extends via housing benefit into welfare policy more broadly; housing is subject to
taxation and forms part of fiscal policy. This paper covers policy towards private housing for those on a
wide range of incomes, as well as social housing.
Housing policy is devolved to the Scottish government, Welsh Government and Northern Irish Government,
and macroeconomic policy and benefits policy are retained at UK level (Wong et al. 2011). The Welsh and
Northern Irish governments have weaker legislative powers, although devolution continued to evolve. In
fact one of the early policy goals stated in the Coalition Agreement was to resolve disagreement between
the UK and Wales over a Welsh request for additional housing powers (Twinch 2010). In England, policies
and financial decisions which affect housing outcomes and are made by the UK government, while in

9
WP18 The Coalition’s Record on Housing: Policy, Spending and Outcomes 2010-2015.
Scotland, Wales and Northern Ireland they are made by both the UK and national governments. This paper
focusses on English housing policy, inputs, outputs and outcomes. Key points of similarity and difference
between England and the other UK nations are highlighted, but a full four country comparison is beyond
its scope.
The Coalition’s inheritance from the 1997-2010 Labour government
Progress and structural problems
An assessment of English housing policy 1975-2000, commissioned by Communities and Local
Government, noted successes in narrow terms, alongside trade-offs, unintended consequences; and
strategic weaknesses. Housing quality, choice and wealth had increased markedly over the period, but
demand ran ahead of supply, there were affordability problems, tenure and spatial polarisation, and
fragmentation of governance. Individual and systemic risk meant that the market was unstable, with
potential knock-on effects for the economy (Stephens et al. 2005). Under Labour, the Government itself
continued to agree, “The housing market has structural problems” (DETR 2000 p7).
Labour housing policy until the Global Financial Crisis
For the 1997-2010 Labour governments, as for the Thatcher and Major governments before them, the
position of housing within social policy was ambiguous at best. On the one hand, social housing was a
key area for efforts to ’roll back’ the state (through the Right to Buy and the switch from council housing to
housing associations). On the other hand, there was active government support for growth of home
ownership, and latterly for the private rented sector as well (Hodkinson and Robbins 2013). There were
tensions between the state’s desire for retrenchment and its ambition to govern the housing system,
particularly over restructuring social housing and encouraging new development.
At the start of the series of Labour governments from 1997, Hills argued,
“‘Housing policy’ per se hardly exists any more: it survives within the welfare state mainly as an
adjunct of social security (through Housing Benefit) or as part of wider city regeneration policies”
(Hills 1998 p13).
However, housing policy enjoyed something of a revival under Labour, playing a moderately prominent
role in the government’s programmes and activities, with continuation of many earlier policies, some
attempt to address the acknowledged structural issues, an interest in social exclusion and neighbourhood
regeneration, and substantial spending.
From 1999, the Decent Homes programme set a new housing quality standard and funding aimed to
ensure all social housing reached the ‘decent’ standard by 2010. The programme had a budget of £50bn
over ten years (at year 2009/10 prices) which amounted to about £13,000 for every social rented home in
England. This paid for 1m new central heating systems, rewiring in 740,000 homes, 700,000 new kitchens
and 525,000 new bathrooms (House of Commons Communities and Local Government Committee 2010).
By 2008, 73% of social rented homes met the standard, behind target but ahead of private sector housing
at 64% (Tunstall 2011). There was also an ambitious and fairly successful programme of neighbourhood
renewal, which included improvements to social and private housing and residential environments (Lupton
et al. 2013b).

10
WP18 The Coalition’s Record on Housing: Policy, Spending and Outcomes 2010-2015.
Despite this, problems remained linked to concentrations of poverty in some social housing estates,
echoing the wider polarisation in the social make-up of different tenures, and the fact that restrictions
remained on local government autonomy over housing expenditure as government finance was tightly
controlled from the centre (Hills 2007). By the early 2000s, insufficient new housing supply against
household projections had become a relatively high profile policy issue. The Sustainable Communities
Plan promised 2m new homes by 2016, or 150,000 per year (ODPM 2003). The government encouraged
new housing development through Regional Spatial Strategies with targets for new house building by
region and local authority, through a target for the reuse of previously developed (‘brownfield’) land, and
continuing capital subsidies for the development of social housing. Investigations into low supply and rising
prices identified the planning system as a major culprit (Barker 2004), alongside problems in the structure
of the development industry and wealth inequality. Low tax, lack of alternative investments and the
development of Buy to Let mortgages were pointed to by other commentators (Dorling 2014).
As in other policy areas, there was dramatic growth in government expenditure on ‘housing’ across the
UK, from the second Labour term starting in 2001. UN regulations define a ‘housing and community
amenities’ spending category, including housing development and repairs by local authorities and other
social landlords, community development and housing-linked infrastructure
1
. The majority of expenditure
on housing and community amenities is on housing development by local authorities and other social
landlords. UK government housing and community amenities spending in peaked in 2009/10 at £16.3bn
(Figure 1).
Figure 1: UK ‘housing and community amenities’ expenditure (including housebuilding) grew
rapidly under Labour, 1997/98-2009/10 in real terms (2009/10 prices), £bn
Source: PESA 2012 Table 4.3
As we will explore below, ‘housing and community amenities’ expenditure does not include the cost of
housing benefit. There are also other government contributions to housing through the more notional cost
of net tax advantages to owner occupiers (concessions on capital gains and inheritance and the fact they
1
Water supply, street lighting and research and development on housing and community amenities. The category
excludes broader regeneration funding.
£0
£2
£4
£6
£8
£10
£12
£14
£16
£18

11
WP18 The Coalition’s Record on Housing: Policy, Spending and Outcomes 2010-2015.
are not taxed on ‘imputed rents’, the flow of benefits from housing). By the mid-1990s, both housing benefit
and tax concessions each significantly outweighed expenditure labelled as ‘housing and community
amenities’ (Hills 2007).
A series of incremental changes affected housing for disadvantaged people. Some Conservative
limitations to rights for homelessness people were partially reversed. A substantial effort to reduce rough
sleeping resulting in a reduction in official counts from 1,850 people in England in 1997/8 to 440 in
2009/10
2
, although official counts were disputed
3
. On the other hand, social housing landlords were given
new powers to address anti-social behaviour, including ‘introductory’ (temporary, initial) tenancies. The
growing cost of Housing Benefit was addressed through limitations on the ability of non-working tenants
in the private rented sector to claim 100% of their rent, with a cap set at a ‘Local Housing Allowance’
pegged to local median rents according to household size. Meanwhile, the average price of a home rose
from £75,000 in 1997 to £189,000 in 2007. Social housing waiting lists grew, and the number of homeless
households in temporary accommodation in England grew from about 50,000 in 1997 to almost double
that by 2006
4
.
Labour housing policy during the Global Financial Crisis
By the mid-2000s, given the unprecedented period of economic growth, unprecedented housing price
growth, and the identification of systematic risks, change in the housing market was not unpredicted or
unpredictable (Hall 2011). For example, in 2005 a housing association executive said,
“’The market is changing faster than ever before… it has changed in one way over the last three
to four years, but it could change in another way in the future’” (quoted in Tunstall and Coulter
2006 p62).
Housing was directly implicated in the ‘credit crunch’ and the recession which followed it, as Stephens et
al. had warned (2005), and was in turn directly affected by them. From 2007, the earliest signs of recession
began to show in the UK. There was a drop in new housing development and in house prices, both leading
indicators of economic problems. In themselves, these lead to reduced employment, consumption,
demand, and GDP.
From 2008, lenders began to be increasingly cautious, in particular demanding higher deposits. This added
to existing affordability problems due to big price increases over the 2000s. In 2009, the Bank of England
commenced a low interest rate policy, with bank base rates dropping from 4.7% to 0.6% in 2009 and then
0.5% in 2010 (Wilcox et al. 2014). This protected existing borrowers who benefited by £20bn (FSA 2010)
and maintained access for new buyers, but meant that any future rate rises posed potential risks. From
2008, the Labour government began to alter its housing policies in response to the credit crunch, banking
crisis and housing market downturn. Hall noted, “Treasury and Bank of England intervention and support
for the UK housing market were both substantial and unprecedented” (Hall 2011 p74). A Special Liquidity
Scheme and a Credit Guarantee Scheme lent lenders £312bn, to be repaid by 2014 (Hall 2011).
2
CLG (2010) Total of street counts in England; Previous published figures on the street count of people sleeping
rough in England, by local authority, 1998-2009 [online] Last accessed November 2014,
https://www.gov.uk/government/statistics/rough-sleeping-in-england-total-street-count-and-estimates-2010
3
Voluntary sector counts produced estimates ten times higher. [online] Last accessed December 2014
http://www.londonspovertyprofile.org.uk/indicators/topics/housing-and-homelessness/rough-sleeping-in-london/
4
DCLG Livetable 777 Statutory homelessness: households in temporary accommodation in London and England,
at the end of each quarter, 1998 to 2014 [online] Last accessed November 2014,
www.gov.uk/government/statistical-data-sets/live-tables-on-homelessnesstistical

12
WP18 The Coalition’s Record on Housing: Policy, Spending and Outcomes 2010-2015.
Government temporarily raised the threshold for stamp duty from £125,000 to £250,000 for first time
buyers and those in disadvantaged areas, and provided bridging funding to help development schemes
which had stalled due to uncertainty about sales.

13
WP18 The Coalition’s Record on Housing: Policy, Spending and Outcomes 2010-2015.
2. The Coalition’s housing policy goals
Unlike in some other policy areas, the Coalition Agreement in May 2010 cannot be treated as the principal
source of Coalition housing policy goals. The most important Coalition housing goals have to be identified
from a range of sources
5
. They also have to be identified partly from evidence on the policies themselves,
as well as from resources devoted to them and their impact: as Lupton et al. warned, “statements of policy
goals are only statements” (Lupton et al. 2013a p4). Budget decisions have been among the main tools
for and constraints on Coalition housing policy.
The Coalition Agreement
The Coalition Agreement contained a number of specific pledges linked to housing policy (Box 1). It also
contained a substantial number of pledges on the planning system, which have implications for the
development of new housing. However, there were fewer than half as many references to housing and
homes as to health, and education and schools. In addition, some of the housing pledges were very minor
(eg ‘Home on the Farm’). This partly reflects the limited attention given to housing in both Conservative
and Liberal Democrat manifestos (Conservative Party 2010, Liberal Democrat Party 2010). In addition, a
majority of the housing items in the Agreement had not been in either Coalition party manifesto
(Conservative Party 2010, Liberal Democrat Party 2010).
A number of items in the Conservative manifesto did not appear in the Agreement but did appear in
subsequent policies, particularly a pledge to cancel the introduction of Home Information Packs (also in
the Liberal Democrat manifesto), and series of changes to the planning system.
The Conservative manifesto pledge to retain the raised threshold for stamp duty was modified in the
Agreement, and the pledge to give equity stakes to ‘good’ social tenants, and creating a ‘Right to Move’
did not appear in the agreement (or subsequent policy) (Conservative Party 2010). The pledge to ‘respect
the tenure and rents’ of social housing tenants, repeated by the Prime Minister in a speech as late as 2012
(Hodkinson and Robbins 2013), was only kept for existing tenants, given the introduction of fixed-term
tenancies and ‘Affordable Rents’ (Conservative Party 2010).
The two Liberal Democrat manifesto pledges that were most distinctive and ideologically distant to those
of the Conservatives, the pledge to investigate changing public sector borrowing requirement accounting
rules to allow local authorities to borrow more, and pledge to scale back the HomeBuy scheme, did not
make it into the Agreement (Liberal Democrat Party 2010). Rather than scaling back support to home
owners, the Coalition subsequently introduced the Help to Buy scheme which was much larger than
HomeBuy.
5
The sources used to identify the Coalition’s housing policy goals were the Coalition Agreement (HM Govt 2010),
The ‘Emergency’ (June 2010) budget and other budgets, the Comprehensive Spending Review, the Localism Act
2011, Welfare Reform Act 2012 and regulations and orders, Laying the Foundations: A housing strategy for
England, 2011, statements on www.gov.uk, ministerial speeches and departmental announcements including some
pre-2010 shadow speeches, and some pre- and post-2010 think tank papers.

14
WP18 The Coalition’s Record on Housing: Policy, Spending and Outcomes 2010-2015.
Overall, the Coalition Agreement was a less useful guide to housing policy than to policy in other areas.
No mention was made in the Coalition Agreement of some policies which subsequently proved significant,
including changes to Housing Benefit rules, or the level of investment in social housing, and precedents
set.
Box 1: Housing and housing-linked policy goals in the Coalition Agreement
Helping people to buy homes
1. We will promote shared ownership schemes and help social tenants and others to
own or part-own their home.
2. We will review the effectiveness of the raising of the stamp duty threshold for first-
time buyers (amended from promise to sustain the raise in the Conservative
manifesto).
3. We will provide more protection against aggressive bailiffs and unreasonable
charging orders, ensure that courts have the power to insist that repossession is
always a last resort, and ban orders for sale on unsecured debts of less than £25,000
(mentioned in the Conservative manifesto; similar policy in the Liberal Democrat
manifesto).
Improving the rented sector (council housing)
4. We will… review the unfair Housing Revenue Account (a partial alternative to
exploring opportunities to enable local authorities to borrow more, mentioned in the
Liberal Democrat manifesto).
Planning (affecting new house building and supply)
5. We will rapidly abolish Regional Spatial Strategies and return decision-making
powers on housing and planning to local councils, including giving councils new
powers to stop ‘garden grabbing’.
6. We will create new trusts that will make it simpler for communities to provide homes
for local people (mentioned in the Conservative manifesto).
7. We will promote ‘Home on the Farm’ schemes that encourage farmers to convert
existing buildings into affordable housing.
8. We will provide incentives for local authorities to deliver sustainable development,
including for new homes and businesses.
9. We will explore a range of measures to bring empty homes into use (mentioned in
the Liberal Democrat manifesto).
Providing housing support for older and vulnerable people
10. We will help elderly people live at home for longer through solutions such as home
adaptations and community support programmes.
Other
11. We will require continuous improvements to the energy efficiency of new housing.
12. Through our ‘Green Deal’, we will encourage home energy efficiency improvements
paid for by savings from energy bills (mentioned in the Conservative manifesto;
similar ideas mentioned in the Liberal Democrat manifesto).
13. We will take forward the Sustainable Homes Legislative Competence Order.
14. We will end the ban on social tenants starting businesses in their own homes.
Source: HM Government 2010

15
WP18 The Coalition’s Record on Housing: Policy, Spending and Outcomes 2010-2015.
The Localism Act 2011
The Localism Act was passed in March 2011. As part of its attempts to reduce bureaucracy, and devolve
decision-making, it introduced important changes for social housing and planning, with implications for
two of the main goals (Box 2).
Box 2: Housing and housing-linked policy goals in the Localism Act 2011
“Improving the rented sector” (mainly social housing)
Option for local authorities and registered providers to set 5-year ‘standard’ rather than indefinite or
lifetime ‘secure’ tenancies
Options for local authorities on access to and allocation of social housing
Option for local authorities to satisfy their duty towards homeless households with an offer of private
rented accommodation (and no offer of social rented housing)
“Increasing the number of available homes”
Abolition of Regional Spatial Strategies and regional and local authority house building targets
Introduction of a new National Planning Framework
Introduction of neighbourhood plans, powers to stop ‘garden grabbing’, other use ‘use class’ changes,
and the re-reissue of Planning Policy Guidance note 3 (planning advice to local authorities on
housing).
Source: Localism Act 2011
The Act contained what was described as “a radical programme of reform” for social housing (HM
Government 2011 p.ix), giving local authorities and ‘registered providers’
6
new options on the length of
tenancies, and local authorities new options on access to and allocation of social housing. Social housing
“must provide the support that people need, when they need it, but also be a springboard for social mobility”
(HM Government 2011 pix). The idea was to more closely target tenancies on the periods of greatest
need (particularly when on low incomes) and through this to discourage indefinite long term occupancy
of of social housing.
Social housing allocation by local authorities reformed, with the entitlement to a social home no longer
being less strictly determined by housing need, and at the same time greater priority being permitted for
economically active households, and other groups such as ex-service personnel. The automatic long term
security of tenure for new social housing tenants was abolished. Previously a household was given a
council home for life (with slightly weaker rights for housing association tenants). Under Labour there had
been what in hindsight appeared a relatively modest reform, allowing landlords to offer an initial temporary
‘probationary’ tenancy to new tenants for the first year, with conversion dependent on good behaviour.
The vast majority of landlords were using this power by 2010, although the vast majority of tenancies were
successfully converted into secure ones after the first year. Under the Coalition, landlords were now
allowed to offer fixed term tenancies of only five years as standard if they chose to do so, with extension
dependent not only on good behaviour but on evidence of continuing housing need, a very marked change.
A large minority of landlords began to experiment with the new power and in 2012/13 9% of new lettings
6
Other officially-recognised providers of social housing, mainly housing associations

16
WP18 The Coalition’s Record on Housing: Policy, Spending and Outcomes 2010-2015.
were fixed term tenancies (Chartered Institute of Housing 2014). Hodkinson and Robbins described the
reforms as “reframing of social housing as a privilege for the deserving poor” (2013 p70).
The Act also allowed local authorities to ‘discharge’ (fulfil) their duty to homeless households by helping
to organise tenancies in the private rented sector, rather than by providing them with tenancies in social
housing. Again, this built on but markedly extended a Labour change. The previous Labour government
had allowed local authorities to discharge their duty in the private rented sector but only if the homeless
household agreed to it.
The Localism Act also introduced significant changes to the planning system. A number of them appeared
to make getting planning permission easier or more predictable, if at the expense of housing or
environmental quality, such as the general presumption in favour of development, and the re-reissue of
Planning Policy Guidance note 3 (planning advice to local authorities on housing). However, others had
unpredictable or potentially negative effects, such as the abolition of Regional Spatial Strategies and
regional and local authority house building targets, and neighbourhood planning. Wong et al referred to
the widespread independent assessment that,
“Spatial planning in England has gone through major change and uncertainty since the formation
of the coalition government” (Wong et al. 2011p45).
Laying the Foundations 2011
In 2011 the Government published a “comprehensive” housing strategy for England (Prisk 2012a). This
was described as a “perfect example” of the Coalition approach to policy more generally (HM Government
2011 pv). Its most important elements were expenditure on getting the housing market moving and helping
people to buy homes, and deregulation of development (Box 3).
Box 3: Additional policy in the Laying the Foundations housing strategy document, 2011
“Increasing the number of available homes”
Funding and permission for various schemes to bring empty homes into use
Allowing renegotiation of pre-2010 ‘section 106’ planning agreements between local authorities and
housing developers (through which developers contribute to infrastructure and affordable housing)
Community Infrastructure Levy charges to replace negotiated ‘Section 106’ money and in-kind
contributions from developers to compensate local authorities and communities for the costs of
development with a proportion made available to communities to spend; potential for business rate
retention in addition
‘Growing places’ fund to pay for infrastructure associated with new housing
‘Get Britain Building’ fund to lend to developers with stalled schemes
‘Build now, pay later’ schemes allowing developers temporary free access to public land
Bridging finance for households developing ‘custom homes’
“Helping people to buy a home”
Help to Buy
Extension of discounts available under the Right to Buy
Source: HM Government 2011

17
WP18 The Coalition’s Record on Housing: Policy, Spending and Outcomes 2010-2015.
From 2011, policy towards home ownership appeared to shift from policies mainly aimed at managing the
effects of the recession to those with longer term goals on supply and restructuring (Hall 2011). 95%
mortgages, which had made up the majority of products available before 2008, had become rare and more
costly, and high prices after the growth of the 2000s meant that a 5% deposit was on average a potentially
prohibitive £10,000. The Coalition introduced a major new policy, Help to Buy, to bridge the gap between
what lenders were demanding and what aspirant buyers could afford. This built on previous policies but
was on a much larger scale (NAO 2014b). Help to Buy had two forms: firstly, government equity loans to
buyers of up to 20% and secondly, near-full government mortgage guarantees to lenders of up to 30%.
Both enabled 95% mortgages for all buyers of homes priced up to £600,000. The NewBuy scheme, the
only element linked to additional supply, enabled 95% mortgages for first time buyers to buy newly-built
homes priced up to £500,000. The equity loans involved a total of £3.5bn in loans and the mortgage
guarantee involved a total of £12bn in guarantees over the life of the schemes (Chandler and Disney 2014,
HM Treasury 2014 a, b). These large sums are not grants or simple government spending but in effect
forms of loans, which government expects will be paid back. However, they carry an opportunity cost and
risk: payback depends on the extent of default, changes in house prices, interest rates and inflation.
The Right to Buy, introduced by Margaret Thatcher in 1980, is probably the best known of all British
housing policies, and has been seen as an emblem of welfare state restructuring (Hodkinson et al. 2013).
Annual sales peaked at 167,000 in 1982/83; by 2010 they had fallen to 6,000 per year (Wilcox et al. 2014).
The most attractive homes were no longer available, discounts had not kept pace with prices, and the
recession had affected all types of sales. The Coalition wanted to ‘reinvigorate’ the policy, as a symbolic
act, and as a means to advance low cost home ownership (DCLG 2012a). In April 2012, the maximum
discount was extended to £75,000 in England and to £100,000 in London. This would cost £45m a year
at the rate of sales seen in 2010, or more if rates increased. Meanwhile, in Scotland the Scottish
Government went in the opposite direction, effectively ending the Right to Buy on the grounds that it
depleted the stock of affordable housing (Wilcox 2014).
The Welfare Reform Act 2012
Spending on housing benefit constitutes a major element of total government expenditure on housing
policy across the UK (Hills 2007), although it does not directly build, maintain or improve any actual housing
stock. Rather than being an investment in housing stock, it is paid to landlords for existing homes. It
subsidises households to meet the costs of renting accommodation in the social or private rented sectors,
where household income from work or benefits is too low to meet rent demands. Thus in effect it may
subsidise low pay. As set out above this expenditure had by the mid-1990s become greater than “housing
and community amenities” spending. Both the Labour governments and Coalition government sought to
reduce expenditure, as well as to avoid work disincentives.
The Coalition built directly on Labour changes affecting private renters. Labour had set a maximum
payment at the median local market rent, regardless of the actual rent charged – so that private renters
would either have to find accommodation at a cost below this level, or fund higher rents themselves. From
2011, the cap or ‘Local Housing Allowance’ (LHA) was set at the 30
th
percentile of local market rents (in
other words, so only rents for the cheapest third of homes would be fully funded). In addition, weekly LHA
was capped at £400, regardless of household size or actual rent asked and paid. From 2013, LHA caps
increased in line with a new, generally less generous measure of inflation (the consumer price index rather

18
WP18 The Coalition’s Record on Housing: Policy, Spending and Outcomes 2010-2015.
than the retail price index) (Hodkinson and Robbins 2013) - meaning that the number of properties at rents
where housing benefit would cover all the cost was progressively reduced.
The Welfare Reform Act 2012 contained important additional changes to the benefit for social tenants,
each of which aimed to reduce the overall cost to the Treasury, and to create particular forms of ‘fairness’
between claimants and others, alongside other policy goals (Box 4).
Box 4: Housing-linked policy in the Welfare Reform Act 2012
“Simplifying the welfare system and making sure work pays”
Housing Benefit changes for social rented tenants including reduced benefit where there was a
“spare” bedroom (widely known as the ‘bedroom tax’)
As part of the Universal Credit provisions, ‘direct payments’ of housing benefit to social rented
tenants, who would then pay landlords (rather than payments straight to landlords)
Benefits Cap setting maximum benefit of £500/week for couples and £350 /week for single people,
including Housing Benefit, regardless of eligibility
Extension of Discretionary Housing Payment budgets for local authorities to mitigate impact of change
on a temporary and discretionary basis
Source: Welfare Reform Act 2012
The social rented sector size criterion (widely known as the ‘bedroom tax’) aimed to level eligibility for
housing space for social rented tenants claiming housing benefit down to that of private rented tenants.
However, this was levelling down rather than up. In addition, while the 559,000 households were affected
when the policy started, they made up just 4% of those ‘under occupying’ in total (Wilcox 2014). Unlike the
policy for private renters, it was introduced for all tenancies, not just new ones, and in a tenure which much
higher portions of tenants had made their lifelong home and of whom much higher proportions had
disabilities or other special needs. The policy also aimed to improve mobility, with the idea of ‘freeing up’
larger homes (DWP 2012). In effect the aims of savings for government and fairness or efficiency were in
conflict: either people did not move, leading to savings for the government, or other goals related to better
use of the stock were achieved. In practice, by far the biggest effect has been savings for the government,
although the policy contributed just 2% of all cuts by 2014/15 (Wilcox 2014) and did not prevent an overall
increase in housing benefit expenditure.
The main overarching policy intended to ‘simplify’ the welfare system was Universal Credit. This was
intended to provide a combined replacement for Housing Benefit, Job Seekers’ Allowance, Employment
Support Allowance and some tax credits. The single benefit would be easier to understand and would
mean that claimants were not subject to varied and multiple clawbacks as their incomes rose.
As part of this, overall change, Direct Payments of housing benefit were intended to make tenants take
responsibility for budgeting, and, potentially, to create a level playing field between social and private
landlords, who generally already had to get rent from tenants and manage the risk of arrears. Social
landlords were concerned about the potential for arrears and bad debts and increased cuts and risks of
collecting income from tenants, rather than from the Department of Work and Pensions.
Local authorities already had Discretionary Housing Payments (DHP) budgets to support residents facing
short-term problems meeting housing costs. In response to welfare reform, DHP budgets for local
authorities were increased to £60m in 2012/13, £180m in 2013/14 and £165m in 2014/15 (Wilson 2014).
Some local authorities did not spend all their budgets, and there were some questions about interpretation
of Department of Work and Pensions rules on eligibility (Wilcox 2014, Clarke et al. 2014a). The key point

19
WP18 The Coalition’s Record on Housing: Policy, Spending and Outcomes 2010-2015.
is, however, that total DHP budgets, even including additional funds local authorities were permitted to
contribute, were only a small fraction of savings intended: “it was never the intention that DHPs would
mitigate the full impact of reductions in HB [Housing Benefit] entitlement” (Wilson 2014 p2). In addition,
future rounds of funding were uncertain. Local authority contributions were capped. The greater use of
DHPs was a marked development of the nations’ and English local authorities’ roles in the welfare system,
hitherto run almost entirely at UK level. The Scottish Government successfully requested permission to
make its own contributions to DHP budgets, sufficient to ensure that all those affected by the ‘bedroom
tax’ would be fully compensated, effectively ending the ‘tax’ in Scotland for 2014/15 (Wilson 2014).
Alongside the devolution of Council Tax benefit, the expansion of DHPs substantially increased local
variation and discretion in the welfare system.
Other policies
The ‘New Homes Bonus’ gave an incentive to local authorities to grant permission for development by
providing them with funds matching the council tax to be charged on new homes for the first six years of
their life. It was also to be paid when empty homes were brought back into use. It was hoped this would
support 140,000 extra homes 2011-2014. £1bn was set aside for payments over the period, although the
policy was intended to be revenue neutral overall and was taken from other local authority budgets (Wilson
2014b). The first payments were made in 2011.
The Coalition Agreement promised to review the temporary increase in the stamp duty threshold for first
time buyers and buyers in disadvantaged areas, a tax concession (HM Government 2010). There is no
evidence of a formal published review, but first ‘holiday’ ended in April 2012, as had been planned by New
Labour, and the second in April 2013.
As planned in the Coalition Agreement, Housing Revenue Account regulations were reviewed and local
authorities in England were required to refinance their housing accounts, in a once-off settlement involving
write-offs for some authorities before central government ceased involvement. This ended the historic role
of national government in the finance of council housing building and improvement and historic debt. It
represented a contribution to ‘localism’. It was of net benefit to most local authority housing departments
(Wilcox et al. 2014), but meant that henceforth, central government saw the finance of council housing
improvement as a matter for local authorities alone.
Policies also included the promotion of private renting, with one minister saying “we need a bigger and
better private rented sector” (Prisk 2013e). Since the 1980s, commentators on the UK housing system had
raised concerns about private rented housing supply (e.g. Rugg and Rhodes 2008). These were at least
partially superseded from 1988 when the sector began to increase as a proportion of the whole system.
By 2010 there were more households renting privately than in social housing. In addition, the purchase of
new build homes by those intending to rent them out (often termed “buy to rent”) had become widespread
and was causing concern in some markets from the mid-2000s. However, attempts to encourage
institutional investment and new build specifically for private renting persisted. Alongside the arguable ‘end’
of new social housing, (the move to minimal capital subsidy and higher rents), the 2011 budget announced
funding for pilots to encourage private landlords and investors to invest in new build for private renting at
full market rents (HM Government 2011). It also reduced stamp duty tax for large-scale purchase of homes.
The 2012 Finance Act altered the existing Real Estate Investment Trusts that provide tax breaks for
institutional investment in the housing market, particularly the private rented sector (Hodkinson and
Robbins 2013).

20
WP18 The Coalition’s Record on Housing: Policy, Spending and Outcomes 2010-2015.
Summary: The Coalition’s orientation towards housing
There was considerable continuity between the broad goals of Labour and Coalition governments (eg
Crisp et al. 2009, Hodkinson and Robbins 2013, Archer and Cole 2014). However, there were clear
differences in the means to be used to achieve goals, and the new Government set a number of precedents.
The Coalition reduced many of the traditional sources of funding for housing (particularly in England) to a
dramatic extent. It ceased to provide capital subsidy to enable new development at rent levels traditional
for ‘social’ housing; removed the assumption that revenue payments of housing benefit to individuals
should cover all the rent for people living on out-of work benefits or similar incomes, at sub-cost levels –
and in doing this left thousands of tenants (including many working households) with ‘shortfalls’. It removed
the assumption of lifetime security of tenure for social housing tenants which had been introduced for
council tenants by Margaret Thatcher in 1980. The Coalition appeared to abandon the ambition to ‘govern’
the housing system, which had created tensions between goals for earlier governments. In turn, however,
this affected the ability of the Coalition to address structural issues, including insufficient supply and
systemic risks.
Conservative-linked think tanks, particularly Policy Exchange and the Centre for Social Justice, had carried
out substantial housing policy development during the period of opposition, with a particular focus on the
planning system (e.g. Centre for Social Justice Housing and Dependency Working Group 2008). The new
housing front bench also had considerable experience of housing policy. Thus the Coalition government
was able to commence rapidly on some quite substantial housing-linked projects, particularly in changing
the planning system, to reduce the role of government.
In opposition, the Conservative party had supported the argument that there were structural problems in
the housing system (Conservative Party 2010). A housing ‘bubble’ had been part of the cause of the
financial crisis as manifested in the UK (Conservative Party 2010). Coalition and Conservative ministers
stated that the housing system was “dysfunctional”, and suffered from “persistent market failure” (e.g.
Cameron and Clegg in HM Government 2011, Prisk 2012a, 2013b). This was shown, they felt, not only in
the slowdown since 2007, in which the housing system was both part cause and victim, but in at least
fifteen years’ undersupply of new homes, which it was argued had resulted in growing social housing
waiting lists, rising private rents and problems for younger people getting into home ownership. The
Coalition argued that by 2011, systematic problems had combined with the effects of the credit crunch and
recession, so that:
“buyers can’t buy… lenders aren’t lending enough… builders are not building… investors are not
investing… affordable housing can do more… tenants are struggling” (HM Government 2011 p.vi;
see also Shapps 2011d, Boles 2013).
Independent commentators also agreed that the housing system faced structural problems which
predated the recession, and had been evident possibly since the 1970s (e.g. Barker 2004. Stephens et
al. 2005, Wong et al. 2011, Whitehead and Williams 2011, Hall 2011). However, in a pre-election
assessment of developing policy, Crisp et al said, “‘it is currently difficult to discern anything resembling a
coherent Conservative policy on housing” (Crisp et al. 2009 p61).
Under the Coalition, the lead department for England, the Department of Communities and Local
Government, aimed to “meet people’s housing aspirations”, but had other goals too: “supporting

21
WP18 The Coalition’s Record on Housing: Policy, Spending and Outcomes 2010-2015.
sustainable growth”, and “devolving as far as possible”
7
. In addition, DCLG was subordinate to the
Treasury. This had been the pattern under preceding governments. Hall argued,
“The importance of the UK housing market cuts across the political spectrum… Nonetheless, the
new coalition… has not given any priority to the housing market over other spending areas…
priority is given to deficit reduction” (2011 p78).
For the Coalition, housing policy and particular systemic issues were more clearly either subordinate to or
a means to achieve economic policy goals for growth and deficit reduction: “We need to get the housing
market… moving again. This is central for our plans for economic growth” (HM Government 2011 pvii).
Housing development itself would create jobs and economic demand.
By improving access to home ownership, housing policy might contribute to social mobility, health and
wellbeing (HM Government 2011), and to some extent, economic policy could be used as a means to
achieve housing policy goals. For example, the first Coalition housing minister said, “The best thing we
can do for the all-important First Time Buyer is to get the economy back onto a sound footing” (Shapps
2010a npn). However, the first time buyer was ‘all important’ because of their role in indicating and
stimulating macroeconomic demand. However, housing policy goals were clearly subsidiary to, and
constrained by, economic policy goals. Shapps also said, “Housing must take its share of the burden. If
we don’t there is a real threat to the economic future of this country” (2010b npn).
The Coalition did not explicitly considered whether and how long term goals such as increased home
ownership and reduced fluctuations in house prices could be achieved, and whether and institutions such
as the mortgage market and housing development market should be reformed.
In addition, the Coalition government also intended changes in the way that policy would be developed
and implemented. From their very first official statement, in May 2010, it declared that it wanted to build
the ‘Big Society’, in which state responsibilities for governance of all policy areas would be reduced:
“We want to give citizens, communities and local government the power and information they
need to come together, solve the problems they face and build the Britain they want” (Cabinet
Office 2010 p1).
The idea of ‘Big Society’ overlaps with the Coalition’s promotion of ‘localism’, encouraging more local
decision-making and responsibility within the state and outside. In this context, Eric Pickles, Secretary of
State for Communities and Local Government, said, “housing is the most market-oriented of all my
Department’s responsibilities. Policy should go with the grain of the market” (Pickles 2011 npn). In
speeches in their first years in government, ministers repeatedly told commercial and voluntary sector
audiences that they were doing and would continue to do the main work, and government role was to
assist: “when I say ‘we’, I really mean you. You are the ones who will do all the hard work” (Shapps 2011c).
Government’s policy tools would be incentives rather than targets and sanctions, alongside further
devolution in decision making (Shapps 2010a npn, HM Government 2011). It is worth noting that incentives
have direct fiscal costs, whereas targets may not. The previous Labour government’s use of new housing
targets was described as unproductive or even counterproductive (e.g. HM Govt 2011). In planning, local
opposition to new homes was to be overcome through direct financial incentives to local authorities and
7
DCLG Business Plan 2012-2015, [online] Last accessed November 2014
https://www.gov.uk/government/uploads/system/uploads/attachment_data/file/7527/2154390.pdf

22
WP18 The Coalition’s Record on Housing: Policy, Spending and Outcomes 2010-2015.
community groups. This approach also acknowledges the substantially reduced funding the Coalition
would put into housing compared with the previous government (see inputs, below).
In this context, the main policies introduced are set out in the boxes below. Box 5 indicates the broad
housing policy goals the Coalition government itself identified by 2014, amongst its 224 overall stated
policy aims, mainly to be devolved through the Department for Communities and Local Government (Box
5). These policies apply to England; in the nations devolved governments would make and deliver their
own.
Box 5: Summary of Coalition housing and housing-linked policy goals and the departments
responsible for achieving them
“Increasing the number of available homes (Department of Communities and Local Government
(DCLG)
Helping people to buy a home (DCLG, HM Treasury and Homes and Communities Agency)
Improving the rented sector (DCLG)
Providing housing support for older and vulnerable people (DCLG)
Simplifying the welfare system and making sure work pays (Department of Work and Pensions)
Achieving strong and sustainable economic growth” (Department of Business, Industry and Skills, HM
Treasury and UK Export Finance)
Source: https://www.gov.uk/government/policies [online] Last accessed November 2014
It should be noted that these goals are framed in broad terms. To achieve some of them requires no more
than only some maintenance of outputs, such as some new homes, rather than maintenance of the same
volume or rate of production, let alone acceleration.
The government has adopted a set of key indicators to monitor its performance in policy delivery. It calls
these ‘impact indicators’, although a minority of them are indicators of spending or quality. DCLG set itself
seven key indicators for housing elements of its business plan for England (Box 6).
Box 6: Key DCLG business plan indicators for housing policy in England
New home starts
New home completions
Affordable housing starts
Affordable housing completions
Households in temporary accommodation
Average energy efficiency of new homes
Percentage of major and minor planning applications granted permission
Source: DCLG 2012b

23
WP18 The Coalition’s Record on Housing: Policy, Spending and Outcomes 2010-2015.
Reviewing these policies, we can see that some familiar and some new contradictions and limitations
made their way into Coalition housing policy. Policies included the promotion of home ownership, despite
an acknowledgment that the tenure had declined over the 2000s, and that high and rising prices were at
least implicated in the overall downturn. Hall noted, “reluctance among policymakers to state that… future
price corrections are either unavoidable or UK residential property is too expensive to buy” (2011 p75).
Policies also included the promotion of private renting, despite an acknowledgement that part of the growth
of the sector represented delayed or frustrated home ownership. It was acknowledged that the housing
system was not providing sufficient supply, but there were new policies which were likely to make
development more difficult, when compared to trends or other things being equal, if not in absolute terms.
Similarly, policy intended to simplifying the welfare system and make work pay included new complications,
some administrative transitional costs, disrupted savings and potential long-term costs. Here, housing
policy goals were losing out to competing interests in deregulation, ‘localism’, a fairer or more popular
approach to welfare, or electoral politics.

24
WP18 The Coalition’s Record on Housing: Policy, Spending and Outcomes 2010-2015.
3. Spending on housing
As long ago as the mid-1990s, it was recognised that the benefits to homeowners of tax concessions on
property ownership significantly outweighed wider government social policy expenditure on housing and
community amenities (Hills 2007). Given a government deficit, housing is a potential area where additional
taxation might have been introduced. Overall, however, the Coalition decided that the majority of its attack
on the UK budget deficit would be made up of spending cuts rather than extra taxes (or in this case,
reducing tax concessions). In addition, there was very little change to the tax position of housing. Some of
the small number of changes introduced actually increased concessions. Thus the vast majority of the
government’s economic policies for housing took the form of spending cuts (Lupton et al 2015).
In June 2010, just weeks after writing the Coalition Agreement, the Coalition agreed a special Emergency
Budget, to start work on the deficit and on reshaping the role of government in the economy. The next
sections report data on resources expended and planned budgets from the Public Expenditure Statistics
(PESA) for the UK, where available, and for England
8
,
9
.
Department of Communities and Local Government budgets for England 2009/10-2014/15
Budgets available for housing policy in England, for both capital investment and day to day (revenue)
spending, fell sharply under the Coalition government, Revenue budgets fell by at least 41% and capital
budgets by 54% 2009/10-2014/15,although there was a modest increase in capital budgeting from 2013/14
to pay for new housing policies.
The next sections cover:
Overall Department for Communities and Local Government revenue expenditure for England,
broken down into ‘communities’ and ‘local government’ categories, both of which include spending
on housing and on other items (Figure 2);
Overall Department for Communities and Local Government capital expenditure for England,
including spending on housing and on other items (Figure 3);
8
PESA data does not fully separate out housing budgets or expenditure. Many reported figures do not contain all
UK government housing budgets or spending; many include non-housing items. They do not include the more
notional costs of net tax advantages to owner occupiers (concessions on capital gains and inheritance and the fact
they were not taxed on ‘imputed rents’, the flow of benefits from housing). Nonetheless, PESA data provide a good
guide to budgets and expenditure. Data are available for the eight years 2008/09-2015/16. These are ‘outturn’
(actual expenditure) for the first five years, including the first three years of the Coalition, and planned budgets for
the last three years of the period.
9
PESA data distinguish between planned budgets and ‘outturn expenditure’ (actual expenditure), which may be
different to planned budgets. Within data on budgets, there is a further distinction between Departmental
Expenditure Limits (DEL) which departments must keep to, and Departmental Annual Managed Expenditure
(AME), which can fluctuate according to programme rules, demand or events. Together DEL and AME make up
Total Managed Expenditure (TME), defined in National Accounts terms as public sector current expenditure plus
public sector gross investment (measured net of sales but gross of depreciation) (HMT 2013a p16). These DEL
and AME budgets contain part but not all of UK central government budgets for housing in England, including
money due to be passed on to local government and public corporations for spending. DEL and AME also include
moneywhich will not be spent on housing. Each contains both ‘resource’ (revenue) and capital elements. The main
budgets of interest are those due to be sent by the Department of Communities and Local Government (DCLG).
These are in turn divided between budgets for the two ‘communities’ and ‘local government’ functions of DCLG.
Both of these include some housing expenditure.
25
WP18 The Coalition’s Record on Housing: Policy, Spending and Outcomes 2010-2015.
UK government spending on ‘Housing and Community Amenities’, comprising housing
development, community development and housing-linked infrastructure (Figure 4), and
breakdowns for the countries of the UK and English regions (Figures 6, 7);
UK housing development expenditure (a sub-set of the above), mainly for building social housing
(Figure 5).
UK housing benefit expenditure (Figure 8).
Figure 2 reports DCLG’s fixed annual budgets for revenue expenditure (officially termed ‘Resource
Departmental Expenditure Limits’). These cover both ‘local government’ sub-department, including funds
local authorities spend on housing
10
, and a small contribution to the ‘communities’ sub-department,
including some spending on housing-linked activities provided by central government programmes such
as projects for rough sleepers and neighbourhood regeneration
11
. ‘‘Local Government’ expenditure
predominates. The budget total shows a dramatic downward trend in DCLG budgets from a peak at £37bn
(in 2012/13 prices) in the last full Labour government year 2009/2010, with a marked drop from 2012/13
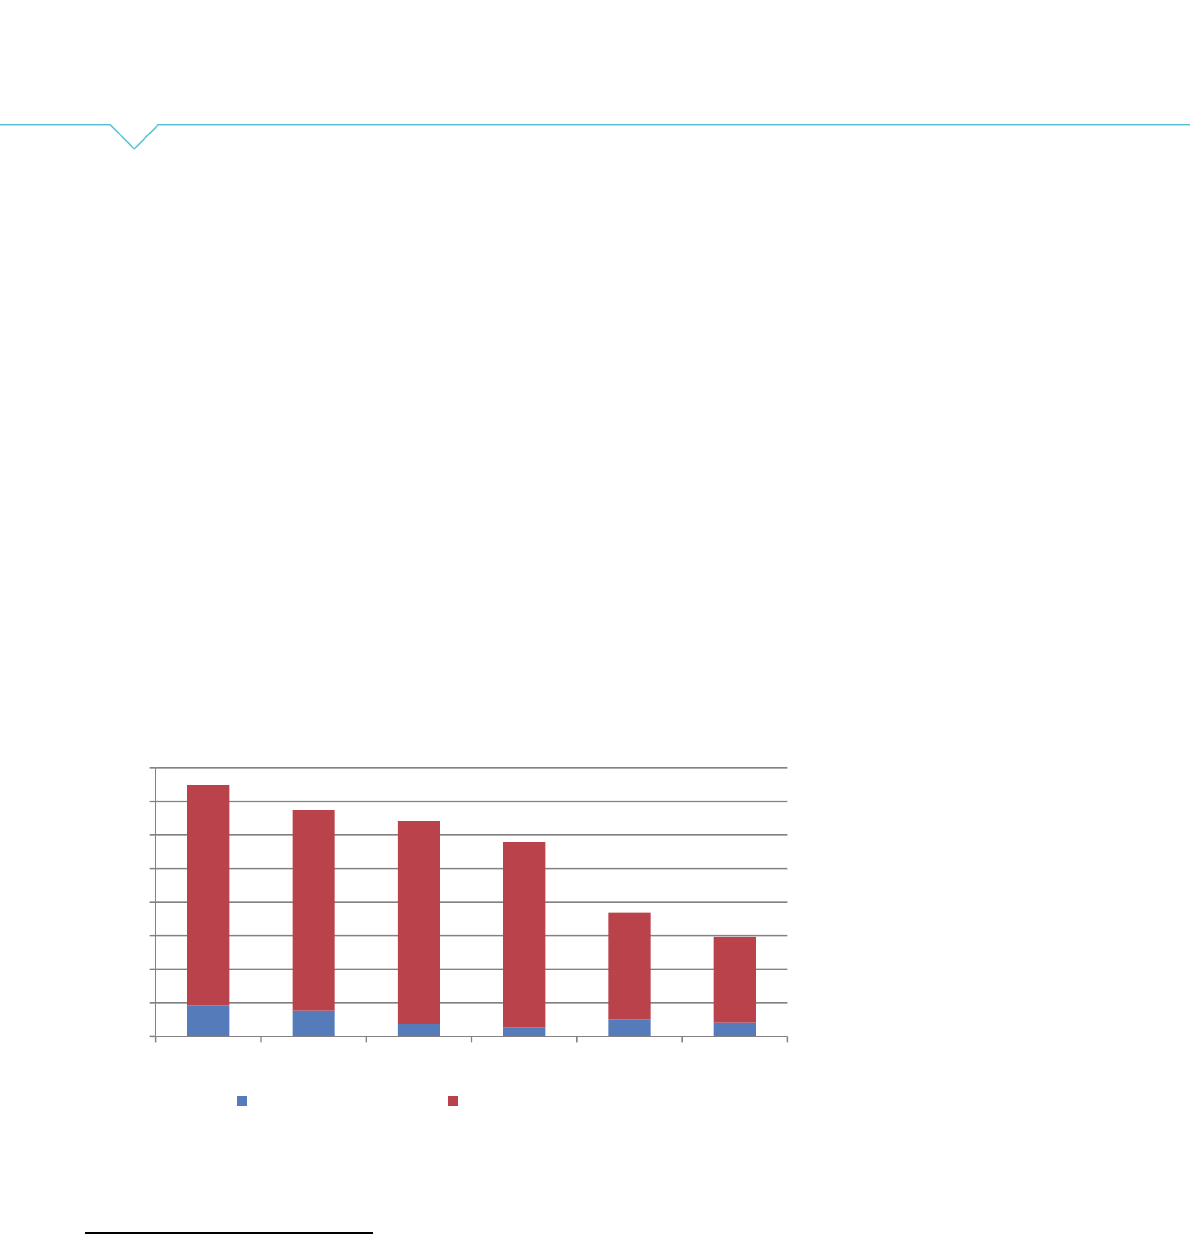
to £18bn in 2013/14, with further reductions planned to £12bn in 2015/16.
Figure 2: After rapid growth under Labour, UK government housing and community amenities
expenditure dropped by 35% under the Coalition 2009/10-2013/14 in real terms (at 2009/2010
prices), £bn
Source: PESA 2013 Table 1.4
10
This covers “Financial support to Local Authorities, including revenue support grant and business rates retention;
transitional relief; council tax freeze, localising council tax support, council tax benefit - new burdens, emergency
assistance, elected mayors; improvement, transformation and efficiency; intervention action and capacity building
in local authorities; local government reviews” (HM Government 2013 p156).
11
This covers “responsibility for the fire and rescue services… decentralising power to citizens and communities
and promoting the Big Society… promoting race, gender and faith equality; tackling extremism and promoting
sustainable, cohesive and integrated communities… tenant empowerment… rough sleepers and supporting people
to stay in their homes; building standards; support for homeowners; planning; Planning Inspectorate; encouraging
action at neighbourhood level… regeneration… zero carbon and climate change… Troubled Families… general
support for Local Authorities; supporting the implementation of the new rights included within the Localism Act
2011… research, monitoring, statistics… Non-Departmental Bodes including the Homes and Communities Agency”
(HM Government 2013 p154).
£0
£5
£10
£15
£20
£25
£30
£35
£40
2009/10 2010/11 2011/12 2012/13 2013/14 2014/15
CLG Communities CLG Local Government

26
WP18 The Coalition’s Record on Housing: Policy, Spending and Outcomes 2010-2015.
Nominally, DCLG had the biggest percentage reduction of real terms revenue budgets (Departmental
Expenditure Limits) 2009/10-2014/15 of all government departments. It lost 61% from its local government
and 56% from communities budgets
12
. However, we need to take into account the fact that departmental
responsibilities have changed over this period
13
. The reductions in DCLG budget include up to £8bn due
to transfers of responsibilities to other bodies, rather than cuts in budgets relating to existing
responsibilities
14
. Thus the reduction in budget for the continuing roles was slightly less than Figure 2
suggests, but still dramatic.
The best figure for the cut to DCLG budgets for continuing ‘local government’ and ‘communities’
responsibilities was at least 41% 2009/10-2014/15. Thus budget cuts for DCLG in England 2010-2014
under the Coalition were equivalent in scale to the budgetary transitions immediately after 1945, when the
UK government was withdrawing at speed from its war footing (Taylor-Gooby 2012).
Hastings et al. said, “local government is one of the foremost casualties of austerity in the UK” (2013 p5).
Wong et al. said,
“the devolved government budgets and local government settlements… create unprecedented
policy challenges for all of those involved in housing and neighbourhood policy-making” (Wong et
al. 2011 p44).
DCLG funds make up only part of the funding of local authorities in England, as they raise their own funds
through council tax and charges. However, DCG cuts translated into marked reductions in local
government budgets and spending. Hastings et al. calculated that the overall cuts in core local authority
budgets in England 2008/09 to 2014/15 totaled 29% in real terms (2013). Local authorities’ income and
expenditure on their own (council) housing is treated separately to other activities through the ‘ring fence’
on their Housing Revenue Accounts. However, given that most local authorities prioritised social care for
protection, other local government housing activities were among the areas most affected (NAO 2014b).
Reductions in local authority housing expenditure 2010/11-2014/15 averaged 34% for unitary authorities
and 17% for districts (NAO 2014b)
15
. Local authority expenditure on homelessness, housing advice,
private sector regulation and renewal, housing-linked support and new building were reduced (Wilcox et
al. 2014). In addition, “reductions in spending tell only part of the story as authorities also have to cope
with rising costs and demands” (Hastings et al. 2013 p5).
These changes had implications for the achievability of most of the main housing policy goals in Box 5
and the characteristics of policy outcomes.
12
It was followed by the Foreign and Commonwealth Office at 46%, Transport at 37%, DEFRA at 31%, Justice at
27%, Culture Media and Sport at 26% and DWP at 22%.
13
The Coalition also changed the name of the department, from ‘CLG’ to ‘DCLG’.
14
This change is made up of: reduced budget of £15.3bn from 2013/14 to cover: allowing local authorities to retain
a proportion of their business rates, linked to a commensurate reduction in grant to local authorities from central
government via DCLG (£11.3bn) (HMT 2013a p46); the transfer of police grants from DCLG to the Home Office
(£3.1bn); the transfer of Local Authority Central Spend Equivalent Grant from DCLG to Department for Education
(£1.0bn) (HMT 2013a p15) and additional budget of up to £7.3bn (depending on transfers to Scotland and Wales)
from 2013/14 to cover the transfer of responsibility for Council Tax Benefits from DWP AME into the resource DEL
of the DCLG, the Scottish Government and the Welsh Assembly Government (totalling £4.3bn); the transfer of
Public Health grants from Department of Health to DCLG (£1.3bn); the transfer of transport grants from Department
for Transport to DCLG (£0.8bn) and the transfer of Early Intervention Grant from Department for Education to
DCLG (£1.7bn) (HMT 2013a p15).
15
Reductions would have been greater for the period 2009/10-2014/15.

27
WP18 The Coalition’s Record on Housing: Policy, Spending and Outcomes 2010-2015.
Figure 3 reports DCLG capital budgets (Departmental Expenditure Limits). This time ‘Communities’
budgets predominate. Capital expenditure on ‘communities’ mainly comprises funding for the Homes and
Communities Agency to support new building for social housing and low cost home ownership by housing
associations.
Figure 3: DCLG’s capital budgets for England dropped by 54% 2009/10-2014/15 in real terms
(2009/10 prices), £bn
Source: PESA 2013 Table 1.9
DCLG capital expenditure fell even more dramatically than resource expenditure, from a peak of £10bn in
2009/10 under the Labour government for each of the Coalition’s first three years, to a low of £2.5bn in
2012/13. This represents an overall decline of 54% 2009/10-2014/15, the largest fall amongst departments
with significant capital budgets.
In the Autumn Statement 2012, for 2013/14, DCLG (Communities) received amongst the largest absolute
increases in capital DEL for 2013/14 and 2014/15 of any departments, of £0.7bn and £0.8bn respectively,
to pay for new policies to support home ownership (HMT 2013a p47). Budget 2013 announced £1.3bn in
2013-14 and £1.9bn in 2014-15 to underwrite Help to Buy and the smaller Build to Rent scheme (HMT
2013b p47). The NAO commented on Help to Buy: “The scheme’s size and design matches the
Department’s intention to make a substantial impact on the housing market” (NAO 2014b p7).
However, this still left capital expenditure in 2014/15 at just £4.5bn, less than half its peak.
UK government spending on ‘Housing and Community Amenities’, 2009/10-2013/14
In addition to reporting planned budgets, PESA reports actual government spending for past years, for
government as a whole and for individual functions. Unlike DCLG spending, above, this covers the whole
UK. These figures include spending by central government, national governments, local government and
public corporations. Following United Nations conventions, the ‘housing and community amenities’
£0
£1
£2
£3
£4
£5
£6
£7
£8
£9
£10
2009/10 2010/11 2011/12 2012/13 2013/14 2014/15
CLG Communities CLG Local Government

28
WP18 The Coalition’s Record on Housing: Policy, Spending and Outcomes 2010-2015.
category includes housing development, community development and housing-linked infrastructure
16
. The
majority of expenditure on housing and community amenities is on housing development (home building)
by local authorities and other social landlords, at 65% of the total in 2012/13. Community development
makes up the next largest piece, at 25% of the total in 2012/13 followed by housing linked infrastructure.
Figure 4 reports housing and community amenities expenditure for the UK for the long run period 1989/90-
2013/14.
Figure 4:UK government ‘housing and community amenities’ expenditure dropped by 35%
2009/10-2013/14 in real terms (at 2009/2010 prices), £bn
Source: PESA 2014 Table 4.3
This Figure illustrates the dramatic growth in housing and community amenities expenditure in real terms
from the second Labour term starting in 2001. Like DCLG expenditure, UK housing and community
amenities expenditure peaked in 2009/10 at £16.3bn in 2009/10 prices. It then fell sharply in each of the
first two years of the Coalition government to £9.4bn in 2011/12, a total drop of £6.9bn, before stabilising
and then slightly increasing.
The reduction over the first two years of the Coalition government (2009/10-2011/12) was £6.9bn at
2009/10 prices, or a very substantial 43%, one of the biggest cuts seen in any government budget. The
reduction across the whole of the Coalition period 2009/10-2013/14 was slightly less, £5.7bn at 2009/10
prices, or 35%. The longer run data allows us to see that despite the dramatic recent fall, levels of
expenditure remain at or above the level seen for the 1990s and early 2000s.
Total Managed Expenditure (TME) has also changed over the period 1989/90-2013/14, and spending on
housing and community amenities occupy a changing percentage of total budgets. The recent peak year
for housing and community amenities expenditure as a percentage of TME was in 2009/10, at 2.4% of the
total. TME was higher in real terms in the 2000s than in the 1990s. This peak was thus lower than the
16
Water supply, street lighting and research and development on housing and community amenities.
£0
£2
£4
£6
£8
£10
£12
£14
£16
£18
1989-90
1990-91
1991-92
1992-93
1993-94
1994-95
1995-96
1996-97
1997-98
1998-99
1999-00
2000-01
2001-02
2002-03
2003-04
2004-05
2005-06
2006-07
2007-08
2008-09
2009-10
2010-11
2011-12
2012-13
2013-14

29
WP18 The Coalition’s Record on Housing: Policy, Spending and Outcomes 2010-2015.
earlier peak of 2.6% in 1991/92. Expenditure for 2012/13 on housing and community amenities was 1.5%
of TME, lower than almost any other year in the series. This means that housing was disproportionately
affected by cuts, and carried more than its ‘share of the burden’.
PESA data are also reported for sub-categories of housing and community amenities, including ‘housing
development’. This includes new home building expenditure by local authorities and other social landlords,
and made up 65% of the total ‘housing and community amenities’ expenditure in 2012/13.
Figure 5:UK ‘housing development’ expenditure (mainly for building social housing) dropped by
44% 2009/10-2012/13 in real terms (at 2009/10 prices), £bn
Source: PESA 2014 Tables 10.1, 10.2, 10.3, 10.4
Housing development expenditure peaked in 2009/10 at £10.8bn, and then fell by 47% or £5.1bn to £5.8bn
in 2011/12, recovering slightly in 2012/13 to result in an overall fall across the Coalition period of £4.8bn
or 44% (at 2009/10 prices), This was again one of the biggest percentage cuts made to any budget
17
.
The new Affordable Housing Programme 2010/11-2013/14 announced in the 2011 Budget provided one
sixth of the public subsidy for new social housing and low cost home ownership housing development
seen in the previous programme. The average grant per new home ‘well under’ half of that in the previous
programme, at an average of £20,000 per home or 14% of its cost: “strikingly low figures compared with
historic norms” (Pawson and Wilcox 2013 p73). The shift to ‘affordable rents’ at up to 80% of market rates
was required to fill the gap. Arguably, this could be described as the end of the development of new social
housing. Government thus intended that the gap in finance would be filled by charging higher rents, to be
paid by tenants (or for those on low incomes, by Housing Benefit). Social landlords were allowed to rent
new homes built under this programme as a new category of ‘Affordable Rent’ properties, charging up to
80% of market rents, well above standard social rents for most homes in most parts of the country.
17
This pattern closely matches the pattern for DCLG Capital Departmental Expenditure Limits for England in real
terms over the same period (Figure 3).
£0
£2
£4
£6
£8
£10
£12
2008-09 2009-10 2010-11 2011-12 2012-13

30
WP18 The Coalition’s Record on Housing: Policy, Spending and Outcomes 2010-2015.
How national spending changes affected UK nations, regions and local government
Cuts made at UK level were mediated at nations level through the Barnett formula. Cuts made in England
were passed on to departments, to the Homes and Communities Agency, responsible for funding new
social housing in England, and to local authorities via national funding formulae. The Scottish government
protected housing and local authority expenditure to some extent (Hastings et al. 2013).
In 2009/10, annual spending per head on housing and community amenities was markedly higher in
Northern Ireland (£624 per person per year) than in Scotland (£379), England (£243) or Wales (£204).
This scale of variation is unlikely to reflect differences in the costs of activities, for example, building new
homes.
In addition to receiving lower funding initially, England was disproportionately affected by cuts to housing
expenditure. Spending per head in real terms fell 2009/10-2012/13 by 47% in England, by 28% in Northern
Ireland, and by 24% in Scotland, and actually rose by 3% in Wales (Figure 6). In 2012/13, annual spending
per head on housing and community amenities in real terms at 2009/10 prices was down to £447 per
person per year in Northern Ireland, £289 in Scotland, £129 in England and £210 in Wales.
Figure 6: UK ‘Housing and community amenities’ expenditure cuts were concentrated on England
(expenditure in the nations of the UK, 2007/08-2011/12, real terms, (2009/10 prices), £ per head)
Source: PESA 2014 Table 9.15
£0
£100
£200
£300
£400
£500
£600
£700
£800
2007-08 2008-09 2009-10 2010-11 2011-12
Northern Ireland Scotland England Wales

31
WP18 The Coalition’s Record on Housing: Policy, Spending and Outcomes 2010-2015.
There were also differences in spending on housing and community amenities within England (Figure 7).
Figure 7: ‘Housing and community amenities’ expenditure per person fell particular sharply in
the North East and London (expenditure in the regions of England the UK, 2007/08-2011/12, real
terms (2009/10 prices), £ per head)
Source: PESA 2014 Table 9.15
In 2009/10 spending per head on housing and community amenities was markedly higher in London (£485)
and, to a lesser extent in the North West and North East (£321) and the North West (£219), than in other
regions. The South East, South West, East and the East Midlands all received less than £200 per person
per year. Higher spending in London is likely to reflect the higher costs (for example of land and labour) of
housing development in the capital, as well as high needs. However, costs in the north are likely to be
lower than average for England.
£0
£50
£100
£150
£200
£250
£300
£350
£400
£450
£500
2007-08 2008-09 2009-10 2010-11 2011-12 2012-13
London North West
North East Yorkshire and the Humber
West Midlands South West
South East East Midlands
East

32
WP18 The Coalition’s Record on Housing: Policy, Spending and Outcomes 2010-2015.
The reductions are very different across the English regions in percentage terms during 2009/10-2012/13.
The biggest losers in percentage terms were the North East with a massive 63% cut, London with a 50%
cut and Yorkshire and Humberside which lost 39%. Overall the cuts reduced the regional disparities in per
person spending, with only London and the North East receiving over £200 per person per year, and the
South East, South West and East receiving less than £100 per head per year (at 2009/10 prices). However
the final pattern may not have matched costs or needs.
UK government spending on housing benefit, 2009/10-2013/14
PESA reports on government housing benefit spending
18
. Housing Benefit is paid to private and social
tenants on low incomes, and ultimately received by landlords. Expenditure on housing benefit dwarfs that
on housing and community amenities, and when it is included, it dominates overall expenditure on housing,
at 72% of the total in 2012/13.
Both Labour and Coalition governments had been concerned about the total cost of housing benefit and
both had changed eligibility rules to try to reduce the cost. However, unlike all previous forms of housing
spending, which were subject to dramatic cuts from 2010, spending on tenants and landlords via housing
benefit rose under the Labour government - then continued to rise under the Coalition government. Total
spending in real terms rose 2009/10-2012/13 by £2.0bn (at 2009/10 prices) or by 9% (Figure 8). Total
spending increased to a similar extent in each of the nations of the UK 2009/10-2012/13.
Figure 8: UK housing benefit spending grew by 9% in real terms 2009/10-2012/13 (at 2009/10
prices), £bn
Source: PESA 2014 Tables 10.1, 10.2, 10.3, 10.4
Although the total expenditure continued to grow, the rate of growth of housing benefit expenditure slowed
under the Coalition.
18
The relevant United Nations expenditure category is ‘Social protection: Housing’. These data are used in
preference to the very similar Department for Work and Pensions data on Housing Benefit to enable the fullest
comparison with other PESA government expenditure data.
£0
£5
£10
£15
£20
£25
2008-09 2009-10 2010-11 2011-12 2012-13

33
WP18 The Coalition’s Record on Housing: Policy, Spending and Outcomes 2010-2015.
The £2.0bn increase in spending on housing benefit under the Coalition was considerably less than, and
no compensation for, the total £10.5bn Coalition cuts in other housing budgets over the same period
(£5.7bn from ‘housing and community amenities’ and £4.8bn from ‘housing development’ at 2009/10
prices). As a rent subsidy it also was paid to landlords, rather than being a capital investment into housing
assets.
The cost of housing benefit did not change significantly as a percentage of all welfare benefits and tax
credits for most of the period. It made up 14.4% of the Great Britain total in 2009/10, 14.8% in 2010/11,
15.0% in 2011/12, and 14.9% in 2012/13. However, a drop to 12.7% was projected for 2013/14, due to
projected additional effects of welfare reform and employment growth (Wilcox et al. 2014).
Housing benefit expenditure made up an increasing proportion of all expenditure on housing. In 2009/10,
UK housing benefit expenditure was £22.8bn or 58% of the total. All housing development, including
expenditure by local authorities
19
and spending by other agencies (mainly housing associations building
new homes) on social housing was £11.0bn or 28% of the total. The spending by housing associations
alone was £5.2bn or 13% (Figure 9). By 2012/13, housing benefit expenditure had grown to £24.8bn or
71% of the total. Housing development had fallen to £6.1bn or 17% of the total. Spending by other agencies
alone was just £1.3bn or 4% of the total.
This represents a continuation of a trend seen since the beginning of the recession, under the Labour
government, as well as a long-term trend since the decision in the late 1980s to introduce more private
finance into social housing development. Nonetheless, it represents a further marked shift in the form of
government expenditure on housing.
Figure 9: UK housing spending continued to switch from housing development to housing
benefit (spending on sub-categories within ‘housing and community amenities’ and ‘housing:
social protection’), UK, 2008/09-2012/13, in real terms (2009/10 prices), £bn
Source: PESA 2013 Table 5.2
19
Repairing existing homes and supporting development by others.
£0
£5
£10
£15
£20
£25
£30
£35
£40
2008-09 2009-10 2010-11 2011-12 2012-13
Housing social protection Local authority housing devt
Other social housing devt Other

34
WP18 The Coalition’s Record on Housing: Policy, Spending and Outcomes 2010-2015.
The shift between types of housing expenditure was more marked in England than in the other nations of
the UK
.
Summary
In terms of finance, total housing expenditure, capital expenditure, housing repairs and housing
development took much more than “its share of the burden” (Shapps 2010b npn) of deficit reduction. This
was particularly true in England. There was a shift to slightly increased spending in the last two years of
the Coalition, focusing on housing supply for home ownership and access to home ownership, although
this still left spending below historic levels.
The only exception was expenditure on housing benefit. Expenditure on housing benefit cannot be planned
ahead in budgets. It depends on eligibility, and is linked to the numbers of households with no or low work
income, as well as to rent levels. The recession contributed making more people eligible due to
unemployment and low pay. A policy of raising social rents faster than inflation in place since the 1980s,
and allowing and encouraging private renting to provide a greater proportion of all lettings was the other
driver. Coalition changes to tighten eligibility rules via the Welfare Reform Act were not enough to affect
expenditure overall.

35
WP18 The Coalition’s Record on Housing: Policy, Spending and Outcomes 2010-2015.
4. Outputs
Papers in this series monitors two kinds of policy results: outputs, in terms of quantity; and outcomes for
members of the public. This paper focusses on outcomes in the next sections by looking at the
distributional and structural effects of policy.
This section reports policy implementation and impacts judged against the main goals of policy and key
DCLG business plan indicators (Box 5, 6). Business plan indicators are listed in Table 1 along with the
latest available data. We include all the government’s indicators but also report on a wider range.
Table 1: Progress on DCLG business plan indicators for housing policy in England under the
Coalition
Progress? Change from
2009/10 or
2010
Latest data Area covered
by data
Source
1) Number of new home
starts
20
Yes 96,000 134,000
in 2013/14
(+40%); 96,000
to 104,000 in
2012/13 (+8%)
2013/14 England DCLG live
table 208
Yes 124,000 to
128,000 (+3%)
2012/13 UK DCLG live
table 208
No 15,000 to
13,000 (-13%)
2012/13 Scotland DCLG live
table 208
Yes 5,000 to 6,000
(+20%)
2013/14 Wales DCLG live
table 208
No 8,000 to 5,000
(-38%)
2013/14 Northern
Ireland
DCLG live
table 208
2) Number of affordable
housing starts
21
Yes 22,000 to
27,000 (+23%)
2013/14 England DCLG live
table 208
3) Number of new home
completions
No 120,000 to
112,000 (-7%)
2013/14 England DCLG live
table 209
4) Number of affordable
home completions
No 27,000 to
23,000 (-15%)
2013/14 England DCLG live
table 209
4) Number of affordable
housing starts
22
Yes 22,000 to
27,000 (+23%)
2013/14 England DCLG live
table 208
5) Households in
temporary
accommodation
No 51,000 to
58,000 (+14%)
2014 England DCLG live
table 777
6) Average energy
efficiency of new homes
(‘SAP’ rating)
23
Yes 55 to 59
24
2012 England DCLG 2014a
7) Percentage of major
and minor planning
applications granted
permission
Yes 85% to 88%
(+3%)
25
2013/14 England DCLG live
table P120
20
Indicators also include housing completions.
21
These data are for all homes completed by local authorities and housing associations, including homes for low-
cost home ownership, social rent and Affordable rent. Indicators also include housing completions.
22
These data are for all homes completed by local authorities and housing associations, including homes for low-
cost home ownership, social rent and Affordable rent. Indicators also include housing completions.
23
Higher figures denote greater energy efficiency.
24
Higher figures denote greater energy efficiency. These figures are for all homes, not just new ones. SAP ratings
are likely to be higher and to have improved more for new homes.
25
The number of applications also increased.

36
WP18 The Coalition’s Record on Housing: Policy, Spending and Outcomes 2010-2015.
Impacts on “Increasing the number of available homes”
The Coalition has overseen a net increase in the number of homes in the UK, from 27.3m in 2009 to 27.8m
in 2012, meeting the literal goal set out in Box 5
26
, by making more homes available and by building new
homes
27
.
The number of empty homes in England has reduced from 737,000 in 2010/11 to 635,000 in 2012/13,
falling from 3.2% of the total stock to 2.8%. Most of the homes no longer empty were likely to have become
available for occupation, at a rate of about 30,000 a year
28
. The imposition of council tax on empty homes
in 2013, and other Coalition schemes encouraging owners to bring empty homes back into use, have built
on those of earlier governments, and appear to have contributed to supply, alongside rises in rents and
stabilisation of prices.
The number of new housing starts and completions, and the number of ‘affordable’ starts, were selected
by DCLG as indicators to be used in measuring its progress on its business plan (DCLG 2012b). The
number of new home completions fell slightly 2009/10- 2013/14 (by 8%) (Figure 10).
Figure 10: UK house building completions fell by 8% 2009/10-2013/14, although house building
starts increased (see below), suggesting a new trend
Source: DCLG Live table 211 [online] Last accessed November 2014
26
Department of Communities and Local Government live tables Table 17c Dwellings by tenure in Great Britain,
Northern Ireland and the United Kingdom [online] Last accessed November 2014
27
The total number of homes includes homes which are uninhabitable or otherwise not available, such as second
homes.
28
Empty homes numbers exclude those which are uninhabitable, scheduled for demolition and some flats above
shops (http://www.emptyhomes.com/statistics-2/empty-homes-statistice-201112, [online] Last accessed November
2014
0
20,000
40,000
60,000
80,000
100,000
120,000
140,000
160,000
180,000
200,000
220,000
Private enterprise Housing associations Local authorities

37
WP18 The Coalition’s Record on Housing: Policy, Spending and Outcomes 2010-2015.
In contrast, the number of new home starts increased very slightly 2009/10- 2012/13, by 3% across the
UK and by 8% in England. There was then a big jump in 2013/14 which meant an overall 40% increase in
starts in England 2009/10-2013/14, which appeared to be linked to Help to Buy and improving economic
conditions generally (Appendix 2). This change should feed through to completions figures in 2014/15.The
number of affordable housing starts also jumped, although not as much (23%).
Not all were net additions, as some homes were also demolished, converted or sold under the Right to
Buy or other schemes over the period. In addition, only those built in 2010/11 under the final phase of the
last government’s programme were traditional ‘social housing’ let at rents significantly lower than market
levels. From 2011/12, only ‘affordable’ homes with rents of up to 80% of market levels would be started,
with some again built for shared ownership, and full market sale. In practice, in 2011/12 social landlords
set rents for new homes built under the programme on average somewhat under 80% of market rents,
because of concerns about affordability for tenants, particularly in high cost areas, and given the impact
of the benefit cap (Pawson and Wilcox 2013). They have however, made use of the power to rent existing
homes at higher rents, and in fact in 2011/12 a majority homes being let at ‘Affordable Rent’ were existing
homes, rather than new ones.
It might be expected that reduced government support for DCLG capital budgets would result in a marked
slow-down in affordable housing development, but this has not occurred.
However, these figures alone cannot constitute a vindication of the policy. The increase in affordable
housing development was from a low base, and over the very short term. The nation’s social landlords
have finite supplies of capital and borrowing ability to use to build homes without government support, and
beyond that would put themselves and their tenants at risk. Continuing the Affordable housing model may
place tenants and landlords under financial strain. In fact Housing Minister Mark Prisk has said he
expected the programme would be altered after 2013/14.
In addition, the average SAP rating of homes, another DCLG key business plan indicator, improved slightly
from 55 in 2010 to 59 in 2012 in England, through activities of owners, government schemes and new
build. This was an unambiguous positive, although progress was modest when considered in term of the
UK’s climate change obligations.
In summary, while achieving its limited goals to add to available homes and see completions rise, the
Coalition has not seen a significant increase in the rate of new development, which is the real policy and
structural issue. The rate of development has been described as “depressingly low” (Wilcox et al. 2014
p3). Meanwhile, the population and numbers of households have continued to grow. Under the Labour
government (quarter 1 1997-quarter 1 2010), an average of 190,000 new homes were completed per
year
29
. In the Coalition period quarter 1 2010- quarter 1 2013, an average of 139,000 homes were
completed per year (Figure 10). New supply remained well below both the 2007 peak and the necessary
to satisfy needs of the estimated 180,000–240,000 new households formed per year (Whitehead and
Williams 2011, HM Government 2013
30
).
Since the Barker Review under Labour (Barker 2004), diagnoses of the causes of systematic undersupply
have focused on the restrictions and other problems caused by the planning system (Barker 2004).
29
Numbers of net additions to the stock would be lower, as some homes were also demolished or converted over
the period.
30
DCLG Live tables, Household interim projections, 2011-2021, England [online] Last accessed November 2014.

38
WP18 The Coalition’s Record on Housing: Policy, Spending and Outcomes 2010-2015.
Another of the DCLG ‘transparency indicators’, to be used in measuring Coalition progress, was the
percentage success rate of major and minor planning applications in receiving permission (DCLG 2012b).
This grew from 85% in 2009/10 to 88% in 2013, not only a positive trend from the point of view of
government policy but high absolute numbers
31
. This measure does not take into account the quality or
complexity of applications but is a measure of speed and predictability for developers.
However, Barker acknowledged other factors in addition to delay and unpredictability in planning decisions,
and several commentators have focused on them.
Some Coalition changes to the planning system may have had adverse effects on the overall numbers of
projects being brought forward for planning permission. After regional house building targets were
abolished by the Coalition to further localism, local authorities reduced their own targets (Wilson 2014b,
Tetlow King 2012). The reduction in local authority house building targets after the end of regional planning
targets shows that the New Homes Bonus was not enough to incentivise building in the context of
uncertainty and problems for both developers and local authorities in financing new homes (Wilson 2014b).
Pawson and Wilcox (2014) concluded that the policy had had little overall impact.
Other diagnoses concentrate on the structure of and incentives within the building industry. The house
building industry was dominated by a few large companies and was further consolidated after the shock
of the recession. UK developers can increase revenues and margins without necessarily increasing
numbers of homes supplied, by focusing on their most profitable sites (Archer and Cole 2014). Wilcox et
al. argued that for business reasons builders were unlikely to want to increase supply by more than 10-
15% per year (Wilcox et al. 2014), meaning a target 200,000 new homes per year would not be met until
2019 (Wilson et al. 2014).
Another alternative diagnosis focusses on the organisations involved (Archer and Cole 2013). The
historical record shows that the private sector alone has rarely reached 200,000 homes per year, and that
new building has been highest when contractors have been most actively supported by government
funding (Wilcox et al. 2014), including a substantial social housing programme.
Impact on “helping people to buy a home”
People’s ability to buy a home depends on market prices, which depend on supply and demand, policies
providing sub-market price homes, the ability to secure and repay mortgages (which in turn depends on
prevailing interest rates, lenders’ policies, buyers’ income and capital), and any policies providing loans
outside the market. The supply of new build homes is only one factor amongst many; the decisions of
existing owners to sell are more important in terms of scale. Whitehead and Williams commented,
“Lower prices and interest rates [since 2008] have done little to improve access and affordability
because the higher deposits faced by first-time buyers more than offset any reduction in prices
and mortgage payments” (Whitehead and Williams 2011 pp1172).
By 2013 mortgage costs to income indexes of housing affordability (as opposed to price to income ratios)
showed that on average things were getting slightly easier for buyers, with continued low interest rates
32
.
31
DCLG business plan quarterly indicators [online] Last accessed November 2014
https://www.gov.uk/government/publications/dclg-business-plan-quarterly-indicators-january-2013
32
Wilcox et al. pointed out that house price indices have become more complex to interpret and affordability is
becoming more difficult to assess, as many sales involve substantial cash sums (2014).

39
WP18 The Coalition’s Record on Housing: Policy, Spending and Outcomes 2010-2015.
Mortgage availability increased after the most severe parts of the credit crunch. However, in 2014 the
Mortgage Market Review led the Financial Conduct Authority to require lenders to add to tests on
applicants to ensure loans would be repayable. In addition and prices were rising in most parts of the UK
(Chandler and Disney 2014), which would make access to home ownership more difficult.
By 2014, 32,000 homes had been bought through Help to Buy mortgage guarantee after 17 months of
implementation, and 48,000 had been bought through Help to Buy equity loan after nine months of
implementation (HM Treasury 2014 a, b). The majority of buyers were first time buyers, and the prices of
homes involved were close to average. However, the NAO commented that it was difficult to assess
whether the scheme had led to more or different purchase than would have occurred without it
33
.
However, a large proportion of academic and practitioner commentators thought Help to Buy had the
potential to cause self-defeating house price inflation or even a ‘bubble’, and only the NewBuy element
was linked to additional supply (eg Chandler and Disney 2014, Wilcox et al. 2014). These commentators
included the International Monetary Fund and National Audit Office (IMF 2013, NAO 2014b). The Bank of
England was concerned about the potential for rapid house price increases to damage the economy
34
.
Thus the schemes could be seen as government-initiated contributions to the structural problems in the
UK housing system which Coalition had acknowledged. By 2014, Chandler and Disney noted an “upturn
in the housing market” which “has coincided with the announcement and (partial) introduction of [the]…
schemes” (2014 p91), although they didn’t attribute causation. Most major house builders were reporting
record profits which they attributed partly to the growth in demand due to Help to Buy. However, this may
have been linked to further consolidation in the market, and to development of the most profitable sites
ahead of others (Archer and Cole 2014).
In addition, Right to Buy sales increased from 3,000 per year in England in 2009/10 to 6,000 in 2010/11
and 10,000 in 2011/12, probably in response both to the increase in discounts and to the improvement in
the overall market
35
. However, the end to the stamp duty ‘holiday’ for first time buyers and disadvantaged
areas made it less easy for this group to buy homes priced between £125,000 and £250,000, and in these
areas.
Results on “Improving the rented sector”
Improvements in quality and affordability in both the private and social rented sectors require government
expenditure and regulation or both (or strong economic growth to enable landlords to act spontaneously).
Coalition policy has reduced expenditure and regulation. Just 6,000 private rented homes received
improvements via local authority funding in 2012/13. The number of homes available for private rent has
increased, but at the expense of home ownership and social renting, and due to the continued easier
access for would-be landlords to interest-only mortgages rather than government policy (Wilcox et al.
2014) (as well as continuing tax concessions). The Decent Homes programme for council housing has
continued. However, it has been substantially reduced (Pawson and Wilcox 2013), with about £0.5bn for
each of the three years 2011/12-2014/15, compared to over a billion pounds in each year of the programme
33
https://www.gov.uk/government/news/help-to-buy-helping-first-time-buyers-onto-the-housing-ladder [online] Last
accessed November 2014.
34
Governor of the Bank of England, Mark Carney, in an interview with Sky News, 18
th
May 2014 [online] Last
accessed November 2014, http://news.sky.com/story/1263732/carney-house-prices-biggest-risk-to-economy
35
DCLG live tables Table 678: Social Housing Sales: Annual Sales by Scheme for England: 1980-81 to 2013-14
[online] Last accessed November 2014.

40
WP18 The Coalition’s Record on Housing: Policy, Spending and Outcomes 2010-2015.
under the Labour government. Following Housing Revenue Account reform, there will be no further support
from central government of this kind.
Changes to social renters’ tenancy and housing benefit eligibility were intended to improve ‘fairness’
between tenures but reduced rather than improved what social tenure itself offers.
Impact on “Simplifying the welfare system and making sure work pays”
Reductions in the numbers of households and amount of rent eligible for Housing Benefit support
contributed to financial work incentives and ‘making work pay’.
This is because the value of additional income from employment is considerably reduced (by about three
quarters) if it simply reduces the amount of housing benefit the household receives. Higher rents therefore
increase work disincentives (and create an “employment trap” (Tunstall et al. 2013)). The social rented
sector size criterion (bedroom tax) and the benefit cap have led to reductions in payments for many
households. For example, the shortage of small homes has meant the vast majority of tenants affected by
the ‘bedroom tax’ tenants have not been able to move to avoid the penalty, even if they wanted to. 4.5%
(Clarke et al. 2014b) or 6% moved in the first six months (Tunstall 2013, Wilcox 2014). Thus 94% or more,
close to half a million households, were left with a shortfall between rent charged and benefit available,
resulting in savings for government and an increased financial work incentive (to make up the missing
benefit). However, there are complex interactions between work income, housing benefit and other
benefits. In addition, people will only take up work if they can find a job and one that gives them a net gain
after the costs of work including travel and childcare are taken into account. There is some evidence that
employment rates for people affected by housing benefit changes have increased, but it is hard to
determine whether or not benefit changes were responsible (Clarke et al. 2014a, Hickman et al. 2014).
In addition, other things being equal, higher rents increase the depth and breadth of the ‘employment trap’
for those claiming housing benefit (Tunstall et al. 2013). The fact that social sector rents continue to rise
faster than inflation (and further above wages), the introduction of ‘Affordable Rents’ and the increased
use of private renting to house homeless people and people on low incomes in general would contribute
to rising rents for those eligible for housing benefit.
The overall consequence was that the cost of Housing Benefit increased under the Coalition. The number
of claimants increased each year from 2002/03 onwards, and increased slightly in each year of the
Coalition government from 4.7m to 5.0m in total in Great Britain, and the gross average annual payments
per household also increased every year
36
. A policy of raising social rents faster than inflation in place
since the 1980s decisively advanced by the Coalition with its Affordable Rent model and allowing and
encouraging private renting to provide a greater proportion of all lettings, contributed to the rise in per
household payments.
We can put this another way. As a consequence of reducing the capital grant per new home from £60,000
to £20,000, over the last 20 years, and relying on increased rents has been an increase in costs to
government of approximately £17,500 per home or £1.4bn over 20 years (at 2012/13 prices) (NAO 2012).
36
DCLG live tables Table 113 Housing Benefit – numbers of claimants and average claim in Great Britain [online]
Last accessed November 2014.

41
WP18 The Coalition’s Record on Housing: Policy, Spending and Outcomes 2010-2015.
The increased use of Discretionary Housing Payments made a contribution to localism but not to simplicity
(as variation between areas became more significant) or to making work pay. In addition, the social rented
sector size criterion, direct payment pilots, and the benefit cap have led to increased rent collection costs,
increased arrears, and reduced capacity for other activity by landlords including borrowing and new
development (Clarke et al. 2014a, Hickman et al. 2014).
Impact on “Providing housing support for older and vulnerable people”
The Supporting People programme was launched by the Labour government in 2003 to support local
authorities and housing associations across the UK in providing housing related support such as hostels,
supported housing and ‘floating support’ for people in general needs housing to groups including homeless
people, people at risk of domestic violence, people with mental health problems, ex-offenders, drug users
and young people at risk (Jarrett 2012). It was partly funded by bringing together other similar funding
sources including housing benefit, probation grants, and Housing Corporation grants. The annual budget
was cut each year under the Labour government from an initial £1.8bn in 2003, with the aim of encouraging
efficiency and discouraging local authorities using the funding for health and long terms social care
purposes. In 2009 the funding allocation ringfence was removed. Cuts to allocations continued under the
Coalition, from £1.64bn in 2010/11 to £1.59bn in 2011/12. In 2010/11 and preceding years about 1m
people had been receiving support at any one time across the UK (Centre for Housing Research 2010).
Under the Coalition centralised data collection on Supporting People stopped in 2011 (Centre for Housing
Research 2014), so it is not possible to track client number trends directly. The number of providers has
reduced, with some organisations losing funding and consequent service cuts.
Under the previous government, the total value of grants paid by local authorities to home owners to install
facilities for disabled people rose from under £100m to £360m in 2010 in Great Britain (in gross terms)
37
.
Under the Coalition, DCLG stopped collecting data on these grants, so it is not possible to track trends.
However, local authority funds have been cut and it seems likely that the total value of expenditure will
have reduced, eligibility criteria will have tightened, and this form of support will have reduced.
People over pension age have been exempted from many reforms which restrict housing benefit and other
welfare benefits. The so-called ‘demographic time bomb’ and its implications for pensioner income and
the NHS have not been widely linked to housing policy or to the potential value of support services in
helping people maintain independence at home. There has been some discussion of the spare capacity
in many older peoples’ homes, and the extent to which housing wealth can provide welfare.
Meanwhile, budget cuts for local authorities via cuts to DCLG ‘local government’ budgets have meant a
concentration on child protection at the expense of adult services.
37
DCLG Live tables Table 28 Private sector improvement and disabled facilities grants [online] Last accessed
November 2014

42
WP18 The Coalition’s Record on Housing: Policy, Spending and Outcomes 2010-2015.
Summary
Considering the Coalition's broad housing policy goals, it has had no significant and unambiguous
successes. It has overseen a net increase in the number of homes in the UK. The number of new home
completions fell 2009/10-2013/14, although the number of starts increased by 40% in England. However,
the Coalition has not seen a significant and sustained increase in the rate of new development, which is
the real policy and structural issue. Changes to the planning system may have both helped and hindered
progress in different ways.
Most indicators of housing affordability remained fairly static under the Coalition. Help to Buy has
certainly helped some, but the degree to which it has made a difference and its long-term costs remain
uncertain. Home ownership has continued to decline.
With reduced regulation and reduced funding, the Coalition did not have the policy tools to improve the
quality of the rental sector. Social housing reforms have created precedents which markedly reduced the
housing element of the welfare state safety net.
Housing benefit reforms have also reduced the housing element of the welfare safety net. The overall
impact of welfare reform, rising social housing rents and increased use of the private rented sector on
work incentives and employment rates is ambiguous.
Older people have been protected from welfare reform. Otherwise it appears that older and more
vulnerable people are less rather than more like to receive housing related support they need, due to
budget cuts, although relevant data sources have been cancelled.

43
WP18 The Coalition’s Record on Housing: Policy, Spending and Outcomes 2010-2015.
5. Policy outcomes
Separating policy outputs from outcomes is difficult for housing. The issue of housing supply has already
been addressed, through Coalition policy goals. Here we look at homelessness as another basic
measure of housing system success, at housing affordability, at the impacts of policy on different groups
and on structural problems.
Other potential policy outcomes which are not looked at here include housing quality, environmental
sustainability, and the contribution of the housing system to sustainable economic growth.
Housing affordability
Housing affordability affects the ability of people to change and to improve their housing situation, and for
those in housing, gives an indication of the income available for other consumption after paying for housing.
Broadly, reducing affordability implies increasing disadvantage for those on low incomes, for those with
poor access to credit, and for new households. In contrast, higher rents and prices, generally associated
with reducing affordability, reflects increasing advantage for existing owners, outright owners, those
wishing to release equity, or to downsize, who will tend to be wealthier and older, although this will be
mediated by the factors such as nature of mortgages, equity held and the ability to sell.
Housing costs rose dramatically over the 2000s, peaking in 2008/09, and then fell back until 2009/10,
against a long trend of slowly rising gross income (Gardiner 2014). Under the Coalition, policy has focused
on affordability for home owners and at the point of access. Affordability for potential new buyers increased
very slightly, when measured via price to income ratios, and over the period for 2010-2013 (Figure 11).
However, affordability ratios did not improve when measured 2009-2013, illustrating the hazards of trying
to identify short-run trends. More importantly, ratios are still much higher than in the late 1990s.
Figure 11: Affordability for home buyers did not improve in England 2010-2013 (ratios between
median house prices and median income and between lower quartile prices and lower quartile
income)
Source: CLG live tables 576, 577 [online] Last accessed November 2014
0
1
2
3
4
5
6
7
8
Median Lower quartile

44
WP18 The Coalition’s Record on Housing: Policy, Spending and Outcomes 2010-2015.
By 2013 mortgage costs to income indices of housing affordability (as opposed to price to income ratios)
showed that on average things were getting slightly easier for buyers, with continued low interest rates
38
.
Mortgage availability increased after the most severe parts of the credit crunch. However, in 2014 the
Mortgage Market Review lead to the Financial Conduct Authority requiring lenders to subject applicants
to additional tests to ensure loans would be repayable, and prices were rising in most parts of the UK
(Chandler and Disney 2014), which would make access to home ownership more difficult.
The proportion of households spending more than a third of their income on housing costs rose from 8%
at the start of the 2000s to 18% in 2008/09, and then fell, largely due to the falls in costs for home owners
with a mortgages. Under the Coalition it has been stable at about 14%.
The marked reductions in interest rates, introduced before the Coalition government by the Bank of
England in response to the financial crisis, favoured existing home owners with tracker mortgages. In
addition to any ‘windfall’ gain they might make from capital gain as owners, this group benefited from an
ongoing harvest of increased disposable income after housing costs estimated at £20bn (FSA 2010). This
gain to a certain group of the population is almost as much as an entire annual house benefit budget.
While this group is unlikely to include many who are very disadvantaged, it is likely to include households
with a broad range of incomes.
The extended discounts for the Right to Buy increased affordability of home ownership for eligible tenants
who want to buy their own homes. However, relatively small numbers were affected enough to take up the
discounts.
The Help to Buy will be more significant in terms of numbers. It benefits those who take it up, at an
opportunity cost and at the expense of all those who buy homes in future if Help to Buy has an upward
effect on prices. In contrast, those want to sell (likely to be more advantaged) may feel this effect as a gain.
To date, Help to Buy has been benefitting those around the middle of the income scale. Thus the policy
will increase inequality in housing advantage. The average house price of homes bought through Help to
Buy in its first nine months was close to the national average, the average income of buyers was close to
the national average, and 89% were first time buyers (NAO 2014b). Thus the scheme was helping those
who were at some disadvantage in the housing market, but were not on poverty incomes, and it did so at
some opportunity cost (NAO 2014d).
The situation for private renters has remained largely unchanged. In 2011/12, 5.9% of households in Great
Britain were spending more than 50% of their income on housing, an indicator of extreme affordability
problems. Private renters, younger people, single people without children and Londoners were all
overrepresented (Gardiner 2014). On a median income, and using 35% of income as a measure of
affordability, a couple with one child could not afford to buy a two-bed home in 22% of local authorities in
2010/11, including most London boroughs, and could not afford to rent privately in 18% of local authorities
(Alekeson and Cory 2013).
The absolute and relative supply of social rented housing increased slightly under the Coalition 2009/10
to 2010/11. The total number of local authority and housing association homes in the UK rose very slightly
2010-2012, from 4.91m to 4.94m, although as a proportion of the total, social housing fell slightly from
38
Wilcox et al. pointed out that house price indices have become more complex to interpret and affordability is
becoming more difficult to assess, as many sales involve substantial cash sums (2014).

45
WP18 The Coalition’s Record on Housing: Policy, Spending and Outcomes 2010-2015.
17.9% to 17.8%
39
. However, social housing rents continued to increase above inflation, and the new
‘Affordable Rent’ model meant rents closer to market rates, making the system less affordable (in the literal
sense), and coverage of housing benefit reduced, making the system somewhat less affordable for low
income households and somewhat more market oriented over all. Private rents have fluctuated over time,
with considerable variation in trends between areas. However, they have become increasingly
unaffordable in certain areas, particularly for those whose budget is restricted either by low income or by
reliance on housing benefit which has been restricted by welfare reforms. Housing affordability is
problematic both in areas with high housing costs and those with low incomes, including high cost and
high deprivation areas such as London, but also lower cost but high deprivation areas.
Homelessness
Homelessness is a key indicator of housing system problems of supply, affordability and distribution. There
are several administrative measuring approaches, each subject to some methodological caveats. Counts
of rough sleepers in England had increased from 1,768 in 2010
40
to 2,414 in 2013 (DCLG 2014b). The
number of households accepted as ‘homeless’ by local authorities (unintentionally homeless and in priority
need) in England rose from 42,000 in 2010 to 53,000 in 2013, an increase of 26%
41
,
42
(Figure 12). Another
of DCLG’s own business plan indicators was the number of households in temporary accommodation
(after being accepted as homeless) (DCLG 2012b). The number of these households grew from 51,000
at the start of 2010 to 58,000 at the start of 2014, an increase of 14% (Figure 13)
43
. The number of
households becoming homeless reflects wider conditions in the housing market as well policy. Fewer
households became homeless as a result of repossession of mortgaged property than in previous
recessions, due to a combination of lower unemployment, lower interest rates, and different behaviour on
the part of lenders.
39
DCLG live table Table 101: Dwelling stock by tenure, United Kingdom (historical series) [online] Last accessed
November 2014
40
This figure was based on a new method introduced in 2010.
41
DCLG Live tables Table 770 Statutory homelessness [online] Last accessed November 2014.
https://www.gov.uk/government/statistical-data-sets/live-tables-on-homelessness
42
This rate and this increase should be seen in context. It followed a long rise in the number of homeless
households, from 105,000 in 1998 to 136,000 in 2003, followed by a fall during the late 2000s and into the
recession.
43
There had been a long rise in the number of households in temporary accommodation, from under 50,000 in 1998
to over 100,000 in 2006, followed by a fall during the late 2000s and into the recession. Again, the number of
households in temporary accommodation reflects wider conditions in the housing market.

46
WP18 The Coalition’s Record on Housing: Policy, Spending and Outcomes 2010-2015.
Figure 12: The number of households accepted as unintentionally homeless and in priority need
in England grew by 26% 2010-2014
Source: DCLG Live table 770 Statutory homelessness [online] Last accessed November 2014.
https://www.gov.uk/government/statistical-data-sets/live-tables-on-homelessness
Figure 13: The number of households accepted as homeless and now living in temporary
accommodation in England grew by 14% 2010-2014
Source: DCLG Live tables Table 777 Statutory homelessness: households in temporary accommodation in London
and England, at the end of each quarter, 1998 to 2014 [online] Last accessed November 2014,
www.gov.uk/government/statistical-data-sets/live-tables-on-homelessnesstistical-data-sets.
The effect of policy on different social groups
The Coalition pledged that when it acted to reduce the deficit, it would ensure that “fairness is at the
heart of those decisions so that those most in need are most protected”. The rich, it said, would “pay
more than the poorest, not just in terms of cash, but as a proportion of income as well” (HM Government
2010).
It is somewhat harder to track the distributional impacts of housing changes and housing policy than for
some other areas of policy
44
. However, most of the effects of Coalition housing policy appear to be at
44
Most housing output data are not available linked to individual or household income data, so it is difficult to tell
how much the risk of, for example, poor housing conditions, homelessness, affordability or access to new homes,
0
10000
20000
30000
40000
50000
60000
2010 2011 2012 2013
0
10,000
20,000
30,000
40,000
50,000
60,000
2010 2011 2012 2013 2014

47
WP18 The Coalition’s Record on Housing: Policy, Spending and Outcomes 2010-2015.
best neutral between income groups and at worst markedly unfavourable to poorer or more
disadvantaged people
Local authority housing expenditure generally addressed the housing needs of less advantaged people,
so the marked reductions in budgets available to councils are likely to have a regressive effect. Some
services for particular vulnerable people have been cut particularly hard. For example, local authorities
report 45% reductions in Supporting People budgets and 43% reductions in housing welfare budgets
2010/11-2014/15 (NAP 2014b). Budgets for managing homelessness have been largely protected with a
3% cut, although demand has risen (NAO 2014b).
In addition, these budget reductions have had different impacts in different areas, largely as a result of
changes to the funding formula (NAO 2014b). In general, more deprived areas with greater numbers and
proportions of disadvantaged residents have been worst affected. Finally, increased reliance on private
sector funding and markets in housing policy also have a worse effect on areas with greater deprivation
and more disadvantaged residents. For example, the use of New Homes Bonus tended to favour those
local authorities with higher house prices and more opportunities for development (Wilson 2014b). Overall
these three processes are likely to have increased housing disadvantage of those already disadvantaged,
and to have increased housing inequality.
Recipients of Housing Benefit and Local Housing Allowance are on low incomes. 70% of Housing Benefit
claimants fall into the lowest three income deciles, with the others concentrated in high cost areas (Alekson
and Cory 2013), and almost all fall below the poverty line after housing costs are taken into account.
Reductions in their benefit entitlement and income through welfare reform and sanctions will have the
effect of increasing income inequality both before and after housing costs. Looking at the case of Local
Housing Allowance reforms, Brewer et al. found that average entitlements reduced and that this was
almost entirely due to lower benefit payments rather than lower rents charged or paid, meaning that the
impact was largely on tenants rather than on landlords (Brewer et al. 2014). Total Discretionary Housing
Payments Budgets are only a small fraction of total shortfalls. There is emerging evidence of links between
welfare reform and hardship. For example, 6-19% of users of case study food banks said the main reason
they needed food was due to the ‘bedroom tax’, while 3-9% said it was due to the benefits cap (Perry et
al. 2014). However, this impact remains contested.
In summary, most of the effects of Coalition housing policy appear to be at best neutral between income
groups and at worst markedly unfavourable to poorer or more disadvantaged people. There is evidence
of disadvantage for those needing supported housing, increased disadvantage for younger people and
new households, for tenants, housing benefit claimants, and increased inequality between areas. Some
groups have gained in absolute and relative position, although attributing these improvements to policy
rather than markets alone is difficult. These include people with flexible rate mortgages already in place
who have not needed to move, who may include those on relatively low incomes, those in areas where
housing prices have recovered and grown (especially London and the South East), some of those taking
up Help to Buy and larger developers. There is very little evidence of cuts to services affecting more
advantaged people.
varies by income. It is also difficult to attribute some distributional changes to the effects of housing policy,
independently of housing markets which have distributional effects via changes in housing prices and rents, which
affect the relative position of owners, buyers, tenants and landlords, and which operate partly be independent of
housing policy. Housing markets processes affect not only those in market tenures, but those in social renting and
those with no independent households or homes.

48
WP18 The Coalition’s Record on Housing: Policy, Spending and Outcomes 2010-2015.
6. Conclusions
In line with its ‘localism’ policy, the Coalition did not aim to ‘govern’ the diverse housing system, which had
created contradiction and tensions for earlier governments, and in fact renounced powers to do so,
particular over planning and via budget cuts. This may result in revived democracy, and more locally-
appropriate policy. However, it has certainly affected the ability of the Coalition both to achieve its
immediate housing policy goals and to address structural issues, including insufficient supply and systemic
risks.
Coalition policy changes have all further reduced the extent of UK central government involvement in
housing, the ‘wobbly pillar’ of the welfare state, and some have reduced the extent of contributions by the
public sector in general. Important precedents included housing association rents above traditional ‘social
rent’ levels; social housing development by social landlords without public subsidy; the end of the
assumption of security of tenure for council tenants which had been introduced by Margaret Thatcher in
1980; and housing benefit at sub-cost levels leaving tenants with ‘shortfalls’. Although there have been no
major changes in homelessness policy, these changes have weakened the other two main housing
elements of the UK’s welfare state ‘safety net’, social housing and housing benefit, transferring risk to
individual households and to some extent to social landlords.
Helping tenants in existing homes and their landlords via housing benefit, rather than supporting new
house building, already dominated total government expenditure on housing when the Coalition took
power (unless tax concessions to owners and landlords are taken into account). The Coalition continued
the trend of shifting government expenditure from new development to housing benefit.
Despite attempts to reduce housing benefit eligibility, and some savings from individual reforms, total
housing benefit expenditure increased by 9% 2009/10-2012/13. In contrast, all other forms of spending
on housing reduced by 35%, with expenditure on new house building falling dramatically, by 44% across
the UK over the same period. DCLG’s revenue budgets for England dropped by at least 41% 2009/10-
2014/15 in real terms, and its capital bugets dropped by 54%. These particularly sharp cuts were
another very marked break with the Labour era. Thus housing has contributed more than ‘its share’ to
deficit reduction which the Coalition’s first housing minister required. The one major exception to the
spending cuts on housing was the boost given to housing purchase, development and lending from 2012
through Help to Buy although this still left spending below historic levels. Cuts was concentrated in
England, and felt much less in the nations of the UK, most of which already had higher funding per head
than England.
Despite reduced means of control of the housing system and reduced funding, the Coalition government
was able to show progress on five of the seven key business plan indicators set for DCLG (see Appendix
2). Firstly, although the number of home completions fell, the number of new home starts increased very
slightly 2009/10- 2012/13, by 3% across the UK and by 8% in England. There was then a big jump which
meant an overall 40% increase in England 2009/10-2013/14, which appeared to be linked to Help to Buy
and improving economic conditions generally. Secondly, the number of affordable housing starts also
jumped, although not as much (23%). This was the opposite effect to what might be expected from reduced
government support, although this effect was seen over the very short term and in an improving economic
climate. However, the Coalition’s average new home production is still below that of the previous
government, and dos not constitute a major advance on structural undersupply. The question is whether
this recent increase in development can be significantly accelerated, because absolute numbers of
additional homes are still well below acknowledged needs, and whether it can be sustained over several

49
WP18 The Coalition’s Record on Housing: Policy, Spending and Outcomes 2010-2015.
years, to meet the backlog of need. In addition, we want to be reassured that this increase is being
achieved in a cost-effective way and one that does not increase systemic risks. Help to Buy is intended to
be temporary, and, arguably, runs the risk of exacerbating long-term structural issues like affordability
problems and high and potentially volatile prices. In addition, the nation’s social landlords have finite
supplies of capital and borrowing ability to use to build homes without government support, and beyond
that would put themselves and their tenants at risk.
Returning to the key DCLG business plan indicators, thirdly, the average SAP rating of homes improved
slightly from 55 in 2010 to 59 in 2012, through activities of owners, government schemes and new build.
Fourthly, there was a slight increase in the already high proportion of planning applications receiving
assent, although numbers of applications were low compared to historic patterns. Finally, the number of
households in temporary accommodation grew by 14%, despite the DCLG business plan intention to see
a reduction. Although these were not selected as key DCLG business plan indicators, the related measure
of the number of households accepted by local authorities as homeless and in priority needs also grew
(26%), as did the number of people counted as street homeless (37%).
These measures indicate that the new house building achieved was not sufficient alone to prevent the
most serious implications of weak supply and unaffordability problems getting worsen. In addition, under
the Coalition price to income ratios for home buyers have not improved, although Help to Buy and the
actions of lenders have eased access for some by reducing deposit requirements. The proportion of
households spending more than a third of their income on housing, standard measure of affordability, has
been stable at about 14% or one in seven. The amount of ‘Affordable’ housing available is steady, but
Coalition precedents mean it is becoming less (literally) affordable.
Considering the Coalition's broad housing policy goals, it has had no significant and unambiguous
successes. The goal of increasing the number of available homes has been discussed.
In terms of helping people to buy a home, most indicators of housing affordability remained fairly static
under the Coalition. Help to Buy has certainly helped some, but the degree to which it has made a
difference and its long-term costs remain uncertain. Home ownership has continued to decline.
With reduced regulation and reduced funding, the Coalition did not have the policy tools to improve the
quality of the rental sector. Social housing reforms have created precedents which markedly reduced the
housing element of the welfare state safety net.
The overall impact of welfare reform, rising social housing rents and increased use of the private rented
sector on work incentives and employment rates is ambiguous. However, housing benefit reforms have
also reduced the housing element of the welfare safety net.
Older people have been protected from welfare reform. Otherwise it appears that older and more
vulnerable people are less rather than more like to receive housing related support they need under the
Coalition, due to budget cuts, although relevant data sources have been cancelled.
The Coalition declared that richer people would make a greater contribution to deficit reduction than poorer
people. However, most of the effects of Coalition housing policy appear to be at best neutral between
income groups, and at worst markedly worse effects on poorer or more disadvantaged people. There is
evidence of disadvantage for those needing supported housing, increased disadvantage for younger
people and new households, for tenants, housing benefit claimants, and increased inequality between
areas. Some groups have gained in absolute and relative position, including people with flexible rate
mortgages already in place who have not needed to move, who may include those on relatively low

50
WP18 The Coalition’s Record on Housing: Policy, Spending and Outcomes 2010-2015.
incomes, those in areas where housing prices have recovered and grown, some of those taking up Help
to Buy and larger developers.
Despite being implicated in as well as affected by the Global Economic Crisis, the UK housing system did
not experience structural change as a result of the crisis, or due to Labour or Coalition policy in response
to it. The Coalition’s policy restructured the planning system and set precedents in social housing and
housing benefit, and was largely successful against its own key business plan indicators.
Nonetheless, by 2014, towards the end of the Coalition government term, the problems identified by
Stephens et al. ten years earlier (Stephens et al. 2005) and acknowledged by the Coalition, remained
unresolved. The Governor of the Bank of England said that he felt that the housing market still had “deep,
deep structural problems”
45
. In 2014, demand ran even further ahead of supply, there were still affordability
problems, and tenure and spatial polarisation. The fragmentation of governance of new housing
development and fraying of welfare safety net had been increased intentionally by the Coalition in the
name of localism, economic goals and restructuring. Lenders had reduced their risks through demanding
larger deposits, but this created knock-on problems of access to housing. The individual and systemic risk
relating to home ownership remained, and additional risk had been transferred to households and social
landlords.
Given continued plans for fiscal constraint by all major parties, and housing’s continuing vulnerable
position, it seems unlikely that future governments could easily reverse Coalition budget reductions and
consequent policy changes.
45
Governor of the Bank of England, Mark Carney, in an interview with Sky News, 18
th
May 2014 [online] Last
accessed November 2014, http://news.sky.com/story/1263732/carney-house-prices-biggest-risk-to-economy

51
WP18 The Coalition’s Record on Housing: Policy, Spending and Outcomes 2010-2015.
References
Adam, S and Brown, J (2013) Do the UK government’s welfare reforms make work pay? IFS Working
Paper W13/26 London: Institute for Fiscal Studies
Alakeson, V and Cory, G (2013) Home Truths: How affordable is housing for Britain’s ordinary working
families? London: Resolution Foundation
Archer, T and Cole, I (2014) ‘Still not plannable? Housing supply and the changing structure of the
housebuilding industry in ‘austere’ times People, Place and Policy, 8(2) pp97-112
Barker, K (2004) Review of housing supply, London: HMT
Boles, N (2013) ‘Housing the next generation’, speech at The Ideas Space, London, 10
th
January
Brewer, M; Emmerson, C; Hood, A and Joyce, R (2014) Econometric analysis of the impacts of Local
Housing Allowance reforms on existing claimants Research report 871 London: DWP
Cabinet Office (2010) Building the Big Society 18
th
May London: The Cabinet Office
Centre for Housing Research (2010) Client records and outcomes report 2009/10 St. Andrews:
University of St. Andrews
Centre for Housing Research (2014) Client records and outcomes report 2013/14 St. Andrews:
University of St. Andrews
Centre for Social Justice Housing and Dependency Working Group (2008) Housing poverty: from social
breakdown to social mobility London: Centre for Social Justice
Chandler, D and Disney, R (2014) Housing market trends and recent policies, chapter 5 in eds.
Emmerson, C; Johnson, P and Miller, H, The IFS Green Budget: February 2014 London: IFS
Chartered Institute of Housing (2010) Running a business from home Coventry: CIH
Chartered Institute of Housing (2014) New approaches to fixed term tenancies Coventry: CIH
Clarke, A; Hill, L; Marshall, B; Monk, S; Pereira, I; Thomson, E; Whitehead, C and Williams, C (2014b)
Evaluation of Removal of the Spare Room Subsidy Interim report London: DWP
Clarke, A; Williams, P and Whitehead, C (2014a) Housing associations and welfare reform: Facing up to
the realities Cambridge: CCHPR
Conservative Party (2010) Invitation to join the Government of Britain: The Conservative Party manifesto
London: The Conservative Party
Conway, L (2013) The current regulation of bailiffs Housing of Commons Library Standard Note
SN/HA/413 26
th
March London: The Stationery Office
Crisp, R; Macmillan, R; Robinson, D and Wells, P (2009) ‘Continuity or change: Considering the policy
implications of a Conservative government’, People, Place and Policy, 3(1), pp58-71
Department for Energy and Climate Change (2014b) Green Deal Assessments Research London: ECC
Department for the Environment, Transport and the Regions (DETR) (2000) Quality and Choice - A
Decent Home for All: The Housing Green Paper London: DETR
Department of Communities and Local Government (2010a) ‘New powers to prevent unwanted ‘garden
grabbing’’ Announcement 9
th
June https://www.gov.uk/government/news/new-powers-to-prevent-
unwanted-garden-grabbing
Department of Communities and Local Government (2010b) ‘Government wants new generation of
social housing entrepreneurs’ Announcement 1
st
November,
https://www.gov.uk/government/news/government-wants-new-generation-of-social-housing-
entrepreneurs
Department of Communities and Local Government (2012a) Reinvigorating the Right to Buy and One for
One Replacement. London: DCLG

52
WP18 The Coalition’s Record on Housing: Policy, Spending and Outcomes 2010-2015.
Department of Communities and Local Government (2012b) DCLG Business plan 2012-2015 London:
DCLG
Department of Communities and Local Government (2014a) English Housing Survey 2012-13 Headline
report London: DCLG
Department of Communities and Local Government (2014b) Rough sleeping statistics England Autumn
2014 Official Statistics Homelessness Statistical Release 14
th
February London: DCLG
Department of Work and Pensions (2011) Underoccupation of social housing: Impact assessment,
February, London: DWP
Dorling, D (2014) All that is solid: The great housing disaster Harmondsworth: Penguin
Department of Work and Pensions (2012) Households below Average Income: An analysis of the
income distribution 1994/95 – 2010/11 July 2012 (United Kingdom) London: DWP
Department of Work and Pensions (2013) Households below Average Income: An analysis of the
income distribution 1994/95 – 2011/12 July 2013 (United Kingdom) London: DWP
Department of Work and Pensions (2014) Households below Average Income: An analysis of the
income distribution 1994/95 – 2012/13 July 2014 (United Kingdom) London: DWP
Financial Services Authority (2010) ‘Financial Risk Outlook 2010’, 10 March London: FSA
Foster, M (2012) Speech at National Empty homes conference 2012, The Building Centre, London, 26
th
November
Gardiner, L (2014) The housing pinched: Understanding which households spend the most on housing
costs London: The Resolution Foundation
Hall, I (2011) ‘The Coalition and the UK Housing Market’, Politics, 31, pp72–81
Hanham, Baroness (2012) Abolition of regional spatial strategies, Written statement to Parliament, 25
th
July https://www.gov.uk/government/speeches/abolition-of-regional-strategies
Harloe, M (1995) The people’s home?, Oxford: Wiley-Blackwell
Hastings, A., Bailey, N., Besemer, K., Bramley, G., Gannon, M., and Watkins, D. (2013) Coping with the
Cuts: Local Authorities and Poorer Communities. York: Joseph Rowntree Foundation
Hickman, P; Reeve, K; Wilson, I; Green, S; Dayson, C and Kemp, P (2014) Direct Payment
Demonstration Projects: 12 month stage reports, London: DWP
Hills, J (1990) in Glennerster, H and Hills, J (eds) The state of welfare: The economics of social
spending, Oxford: Oxford University Press
Hills, J (2007) Ends and means? The future roles of social housing in England, CaseReport34 London:
CASE, LSE
HM Government (2010) The Coalition: our programme for government (‘The Coalition agreement’)
London: HM Government
HM Government (2011) Laying the Foundations: A housing strategy for England London: Stationery
Office
HM Treasury (2010). ‘Budget Statement by the Chancellor of the Exchequer, the Rt Hon George
Osborne MP’. June 22
nd
HM Treasury (2013a) Public Expenditure Statistical Analyses 2013 Cmnd. 8663 July 2013 London: HMT
HM Treasury (2013b) Help to Buy: Mortgage guarantee scheme 13
th
December 2013 Amended scheme
rules London: HMT
HM Treasury (2014a) Help to Buy scheme: mortgage guarantees: Quarterly Statistics September 2
nd
London: HMT
HM Treasury (2014b) Help to Buy scheme: equity loan: Quarterly Statistics September 2
nd
London: HMT
Hodkinson, S and Robbins, G (2013) The return of class war Conservatism? Housing under the
Coalition Government, Critical Social Policy 33(1) pp57-77

53
WP18 The Coalition’s Record on Housing: Policy, Spending and Outcomes 2010-2015.
Hodkinson, S; Watt, P and Mooney, G (2013) Neoliberal housing policy: Time for a critical reappraisal?
Critical Social Policy, 33(3) npn
House of Commons Communities and Local Government Committee (2000) Beyond Decent Homes
Fourth report of session 2009-10 Volume 1 Report, together with formal minutes HC 60-1
London: The Stationery Office Limited
International Monetary Fund (2013) United Kingdom – 2013 Article IV consultation: Concluding
statement of the mission Washington DC:
Jarrett, T (2012) The Supporting People programme Housing of Commons Library Research Paper
12/40 16 July 2012 London: House of Commons Library
Kemeny, J (2001) ‘Comparative housing and welfare: Theorising the relationship’, Journal of Housing
and the Built Environment, 16, pp53-70
Liberal Democrat Party (2010) Liberal Democrat Manifesto 2010 London: The Liberal Democrat Party
Lupton, R with Burchardt, T; Hills, J; Stewart, K and Vizard, P (2013a) A Framework for Analysing the
Effects of Social Policy Social Policy in a Cold Climate Research Note series RN001 London:
CASE, LSE
Lupton, R; Fenton, A and Fitzgerald, A (2013b) Labour’s Record on Neighbourhood Renewal in
England: Policy, Spending and Outcomes 1997-2010, Social Policy in a Cold Climate Working
Paper, London: CASE, LSE
Ministry of Justice (2012) Transforming bailiff action. How we will provide more protection against
aggressive bailiffs and encourage more flexibility in bailiff collections Paper 5/2012 London:
Ministry of Justice
National Audit Office (2014a) Universe Credit: Progress update London: NAO
National Audit Office (2014b) Impact of funding reductions in local authorities London: NAO
National Audit Office (2014c) The Help to buy equity scheme London: NAO
National Audit Office (2010) The Decent Homes Programme London: The Stationery Office
National Audit Office (2012) Financial viability of the social housing sector: The launch of the Affordable
Housing Programme London: The Stationery Office
Office for Budget Responsibility (2012) Economic and fiscal outlook. Cm 8036. London: The Stationery
Office.
Office of the Deputy Prime Minister (2003) Sustainable communities plan, London: ODPM
Pawson, H and Wilcox, S (2013) UK housing review 2013 Coventry: Chartered Institute of Housing
Perry, J; Williams, M; Sefton, T and Haddad, M (2014) Emergency use only: Understanding and
reducing the use of food banks in the UK London: Child Poverty Action Group/Church of
England/Oxfam UK/Trussell Trust
Pickles, E (2011) Home Builders Federation 'one year on' conference, Home Builders’ Federation, Savoy
Place, London, 31
st
October https://www.gov.uk/government/speeches/home-builders-federation-
one-year-on-conference
Prisk, M (2012a) Speech at the Council of Mortgage Lenders Conference, QEII Conference Centre,
London, 7
th
November [link]
Prisk, M (2012b) Speech at national summit to end rough sleeping, Arlington House, 11
th
December
Prisk, M (2013a) Speech to the British Property Federation, Deloitte Real Estate office, London, 27
th
February
Prisk, M (2013b) Speech to Home Builder’ Federation Conference 2013, Wimpole Street, London, 12
th
March
Prisk, M (2013c) Speech to Estates Gazette residential Summit 2013, The Law Society, 16
th
April
Prisk, M (2013d) Speech on housing, 27
th
June

54
WP18 The Coalition’s Record on Housing: Policy, Spending and Outcomes 2010-2015.
Rugg, J and Rhodes, D (2008) The private rented sector: Its contribution and potential, York: CHP,
University of York
Shapps, G (2010a) ‘Age of aspiration’ Speech delivered at Royal Institution of Chartered Surveyors,
London, 8
th
June https://www.gov.uk/government/speeches/age-of-aspiration
Shapps, G (2010b) Speech delivered at the National Housing Federation annual conference 2010,
Birmingham, 22
nd
September https://www.gov.uk/government/speeches/national-housing-
federation-annual-conference-2010
Shapps, G (2011b) Speech to Home Builders’ Federation Annual Lunch 2011, Marriott Grosvenor
Square Hotel, London, 10
th
May https://www.gov.uk/government/speeches/home-builders-
federation-annual-lunch-2011
Shapps, G (2011c) Speech to ‘No second night out’ homeless link conference 12
th
October
Shapps, G (2011d) ‘Role of building societies’, Speech at Savoy Place, London, 20
th
October
Stephens, M; Whitehead, C; Munro, M (2005) Lessons from the past, challenges for the future for
housing policy London: ODPM
Taylor-Gooby, P (2012) Root and Branch Restructuring to Achieve Major Cuts: The Social Policy
Programme of the 2010 UK Coalition Government Social Policy and Administration, 46(1) pp 61–
82spol_797 61., Social Policy and Administration
Tetlow King Planning (2012) Research on the Impact of the Impending Revocation of Regional
Strategies on Proposed and Adopted Local Housing Targets across England, December London:
Tetlow King Planning
Torgersen, U (1987) ‘Housing: The wobbly pillar under the welfare state’, pp. 116-126 in Between State
and Market: Housing in the Post-industrial Era, eds. Turner, B. Kemeny, J. and Lundqvist, L.,
Stockholm: Almqvist and Wicksell International
Tunstall, R (2013) Testing DWP assessment of social rented sector size criterion on housing benefit
costs York: Centre for Housing Policy, University of York/Riverside Housing Group
Tunstall, R. (2011) 'Social housing and social exclusion 2000-2011', CASE Paper, no. 153, London:
CASE, LSE
Tunstall, R., Bevan, M., Bradshaw, J., Croucher, K., Duffy, S., Hunter, C., Jones, A., Rugg, J., Wallace,
A., Wilcox, S (2013) The Links Between Housing and Poverty, York: Joseph Rowntree
Foundation
Tunstall, R; and Coulter, A (2006) Turning the tide? 25 years on 20 unpopular council estates in
England Bristol: Policy Press
Twinch, E (2010) ‘U-turn over Wesh housing powers’ Inside Housing 2
nd
July, [online] Last accessed
November 2014, http://www.insidehousing.co.uk/u-turn-over-welsh-housing-
powers/6510521.article
Whitehead, C and Williams, P (2011) ‘Causes and consequences? Exploring the shape and direction of
the housing system in the UK post the financial crisis’ Housing Studies 26(7-8), pp1157-1169
Wilcox, S (2010) UK Housing Review 2009/10 Coventry: Chartered Institute of Housing
Wilcox, S (2014) Housing benefit size criteria: Impacts for social sector tenants and options for reform
York: Joseph Rowntree Foundation
Wilcox, S; Perry, J and Williams, P (2014) UK Housing review briefing 2014 Coventry: Chartered
Institute of Housing
Wilson, W (2013) Under-occupation of social housing: Housing benefit entitlement Standard note
SN/SP/6272 30
th
July London: House of Commons Library
Wilson, W (2014) Housing Benefit: Discretionary Housing Payments (DHPs) - Commons Library
Standard Note Standard notes SN06899 22
nd
September London: House of Commons Library

55
WP18 The Coalition’s Record on Housing: Policy, Spending and Outcomes 2010-2015.
Wilson, W (2014a) Housing Benefit: Shared Accommodation Rate Standard Note: SN/SP/5889 26
November London: House of Commons Library
Wilson, W (2014b) The New Homes Bonus Scheme - Commons Library Standard Note 26 November
2014 Standard notes SN05724 London: House of Commons Library
Wilson, W (2014c) Housing mobility schemes - Commons Library Standard Note Standard note:
SN04696 17 November London: House of Commons Library
Wilson, W (2014d) The impact of the under-occupation deduction from Housing Benefit (social rented
housing) - Commons Library Standard Note Standard notes SN06896 6 October London: House
of Commons Library
Wilson, W (2014e) Extending home ownership: Government initiatives - Commons Library Standard
Note 8 April Standard notes SN03668 London: Housing of Commons Library
Wilson, W (2014e) Housing Benefit: Discretionary Housing Payments (DHPs) - Commons Library
Standard Note 22 September 2014 Standard notes SN06899 London: House of Commons
Library
Wilson, W and Heath, S (2014) Self-build and custom build housing sector Standard Note: SN06784 7
November London: House of Commons Library
Wong, C; Gibb, K; McGreal, S; Webb, B; Leishman, C; Blair, N; Hincks, S and MacIntyre, S (2011)
Housing and neighbourhoods monitor 2011: Fragility and recovery York: JRF
