
Pareto Securities’ 28
th
Annual Energy Conference
Noble Corporation
15 September 2021

Forward Looking Statement
This presentation contains “forward-looking statements” about Noble’s business, financial performance and position, contracts and prospects. Words such as "anticipate,"
"believe," "could," "estimate," "expect," "intend," "may," "might," "plan," "project," "should," "shall," and "will" and similar expressions are intended to be among the statements
that identify forward-looking statements. Statements regarding the effect, impact, the global novel strain of coronavirus ("COVID-19") pandemic, and agreements regarding
production levels among members of the Organization of Petroleum Exporting Countries and other oil and gas producing nations ("OPEC+"), and any expectations we may have with
respect thereto, and those regarding contract backlog, costs, benefits, opportunities, financial performance, financial position, capital structure, debt, fleet strategy, bidding activity,
rig demand, contract commencements, dayrates, impact of future regulations, contract duration, fleet condition, capabilities or performance, industry fundamentals, shareholder
value, as well as any other statements that are not historical facts in this release, are forward-looking statements that involve certain risks, uncertainties and assumptions. These
include but are not limited to actions by regulatory authorities or other third parties, market conditions, factors affecting the level of activity in the oil and gas industry, supply and
demand of drilling rigs, factors affecting the duration of contracts, the actual amount of downtime, factors that reduce applicable dayrates, violations of anti-corruption laws,
hurricanes and other weather conditions, the future price of oil and gas and other factors detailed in the Company’s most recent Form 10-K, Form 10-Q’s and other filings with the
Securities and Exchange Commission. Should one or more of these risks or uncertainties materialize, or should underlying assumptions prove incorrect, actual results may vary
materially from those indicated. The Company disclaims any duty to update the information presented here.

3
“Since 1921 Noble has been the trusted partner of our
customers, our communities, and our employees.
Our relationship-centered approach, unwavering
commitment to our values, and passionate pursuit of
operational excellence consistently delivers safe and
efficient results.”
Noble – At a Glance
100-year history
Committed to core values
High-spec & rationalized fleet
Conservative balance sheet
Strong backlog
Capacity for growth
Trusted Partner
Highlights
(1) As of June 30
th
, 2021; Pro Forma for jackup divestment to ADES International Holding PLC.
(2) As of September 7
th
, 2021 closing price of $27.46/share for 66.6 million shares including penny warrants but excluding other warrants and management incentive plan.
Total Fleet Size
20 (12 Floaters / 8 Jackups)
Net Cash
$40 million
Financial
Operational
Total Liquidity
$900+ million
Backlog
$1.3 billion
Market Cap
~$1.8 billion
Average Fleet Age
8 Years
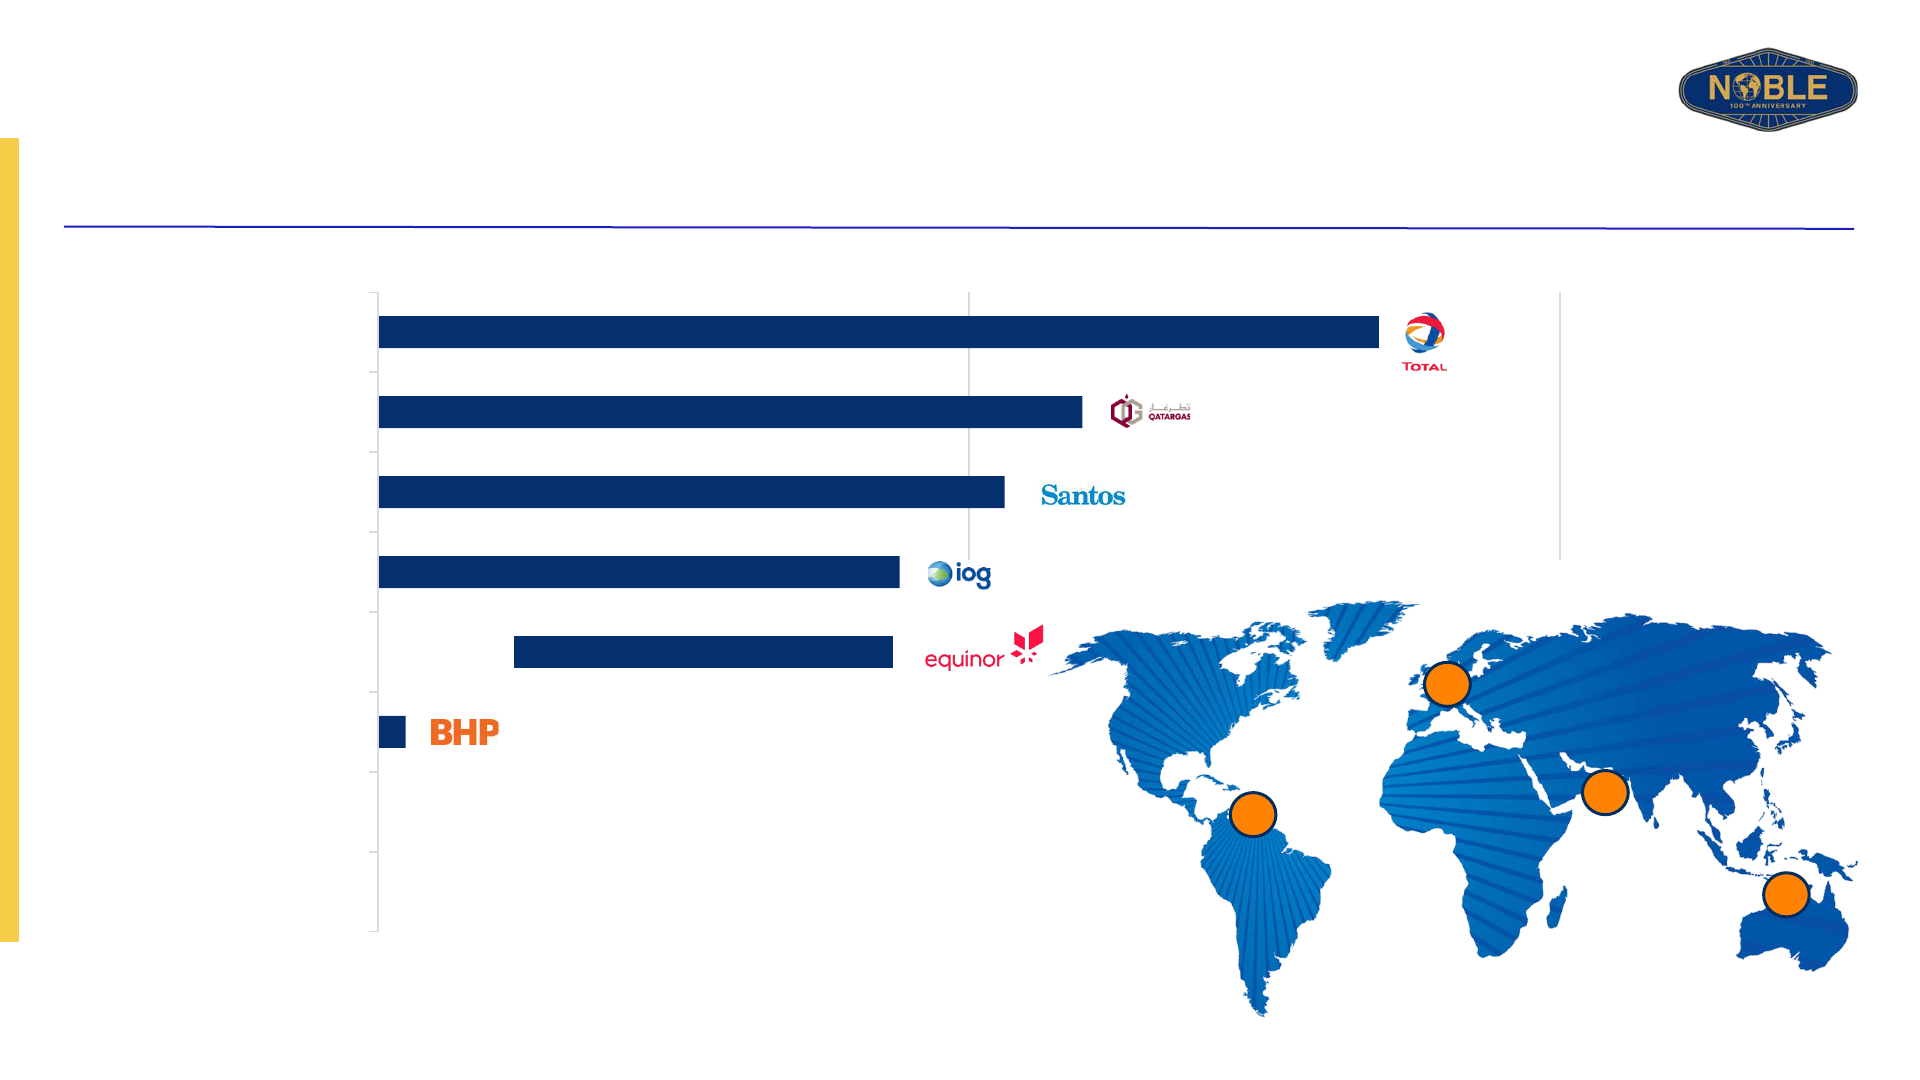
Select Customer
Relationships
(2)
(1)

4
The Noble Value Proposition
Ability to get paid in current market environment (“Yield”) with exposure to improving market (“Growth”)
Growth
Free Cash Flow in
Current Market
Environment
Yield
Improving
Market
+
Ability to
Return
Capital
=
Cash Flow
Growth
=

5
Recently Announced Divestment of Jackups in Saudi Arabia
Compelling economic return that accelerates ability to return capital to shareholders
Key Transaction Terms
Significant Increase in
Financial Flexibility
Net cash position anticipated in 2022
Significantly enhanced liquidity position
Improved position to prioritize:
Debt repayment
Returning cash to shareholders
through share buybacks and
dividends
Announced:
Estimated Closing:
Buyer:
Price:
Rigs:
August 26
th
, 2021
October 2021
ADES International Holding PLC
US $292 million
Noble Roger Lewis
Noble Scott Marks
Noble Joe Knight
Noble Johnny Whitstine
(1) Anticipated cash proceeds from transaction are $285 million, net of fees, expenses, and settlement of working capital.
(1)

6
APA Corp – Suriname – Noble Gerry de Souza
Murphy Oil – US GoM – Noble Faye Kozack
EnVen – US GoM – Noble Faye Kozack
Noble Platform and Brand to Drive Consolidation
Noble has the proven ability to drive industry consolidation
Noble Gerry de Souza (formerly Pacific Santa Ana)
Noble Faye Kozack (formerly Pacific Khamsin)
Noble Stanley Lafosse (formerly Pacific Sharav)
Rig Renaming
Rigs Scrapped
Pacific Mistral
Pacific Bora
Rig Contracts Awarded
(1)
(1) Noble Gerry de Souza completed rename change on September 1, 2021. Pacific Khamsin and Pacific Sharav will complete name changes during the next available window in contract drilling schedules
PACD Acquisition
Scorecard
Grew high-spec UDW fleet
Won contracts & added backlog
Expanded customer base
Realized $30 million of synergies
Strengthened balance sheet
Exercised capital discipline
Key Actions with PACD Fleet

7
Noble’s Key Value Drivers

8
Fleet Quality and Utilization Drive Cash Flow Generation
7G Drillships
6G Drillships
Semisubmersible
7
4
1
Floaters comprise 60% of Noble’s rig fleet
Floater Fleet
83%
12
Contracted
Average Age
~8 years
(1) Current fleet presented as pro forma divestment of 4 jackups to ADES International Holding PLC.
(1)

9
Fleet Quality and Utilization Drive Cash Flow Generation
Ultra High-Spec CJ70
High-Spec
1
7
Jackup Fleet
75%
8
Contracted
Average Age
~8 years
(1)
(1) Current fleet presented as pro forma divestment of 4 jackups to ADES International Holding PLC.
(1)
Jackups comprise 40% of Noble’s rig fleet

10
Fleet Quality and Utilization Drive Cash Flow Generation
Source: Rystad Energy UCube; Rystad Energy research and analysis, IHS Markit Petrodata
(1) Average Utilization 2015 – 2020.
(2) Competitive fleet includes all jackups and 6th and 7th generation drillships; excludes owner-operated and rigs working in China and Iran. Contract term fixed includes only new, mutually agreed contracts for competitive fleet
Noble owns ~4% of the global rig fleet – but won
7% of all rig years awarded over the last 6 years
Noble Premium
Noble’s fleet utilization is consistently high
In 2020, the Noble fleet captured 3x its share of
contracted rig years
(1)
(2)(1),

11
Note: Excludes cold stacked rigs
Jun-21 Jun-22 Jun-23 Jun-24
Pacific Scirocco
Pacific Meltem
Noble Gerry De Souza (Santa Ana)
Noble Clyde Boudreaux
Noble Faye Kozack (Khamsin)
Noble Stanley Lafosse (Sharav)
Noble Globetrotter I
Noble Sam Croft
Noble Bob Douglas
Noble Don Taylor
Noble Globetrotter II
Noble Tom Madden
4
4
1
2
1
(1) Per Fleet Status Report as of June 23, 2021 plus updates for contracts announced on 2Q21 earnings call for Noble Gerry de Souza (Santa Ana), and Noble Faye Kozack (Khamsin)
Jan-27
Floater Fleet Status
Strong Backlog Across a Diverse Customer Base
12
Jun-21 Jun-22 Jun-23
Noble Houston Colbert
Noble Sam Hartley
Noble Regina Allen
Noble Lloyd Noble
Noble Hans Deul
Noble Tom Prosser
Noble Mick O'Brien
Noble Sam Turner
Strong Backlog Across a Diverse Customer Base
Jackup Fleet Status
1
5
1
1
(1) Per Fleet Status Report as of June 23, 2021 plus updates for contract announced on 2Q21 earnings call for Noble Tom Prosser
(2) Pro forma for sale of four jackups in Saudi Arabia

13
Exposure to Improving Ultra-Deepwater Market
UDW floater supply and demand forecast
Source: Rystad Energy Research, September 2021
83
65
63
72
60
65
81
84
90
98
104
114
108
110
111
104
92
96
102
107
111
115
127
131
133
134
129
121
118
123
125
126
128
0
50
100
150
2016 2017 2018 2019 2020 2021 2022 2023 2024 2025 2026
Demand Marketed supply Total supply
Rig years
ForecastHistorical
+0 +5 +4 +8 +2 +6
Increase in
Rystad’s demand
forecast since
June 2021

14
Financial Focus
Capital Structure Highlights
Committed to capital discipline, which
includes exercising a balanced economic
approach to capital related decisions
Dedicated to running a highly efficient cost
structure, both offshore and onshore
Focused on free cash flow generation –
expect to be free cash flow positive in
2022
(1) As of June 30
th
, 2021 and pro forma for divestment of four jackups to ADES International Holding PLC
(2) The Company expects to generate approximately $285 million in cash from the transaction net of fees, expenses, and the settlement of working capital.
Financially Disciplined and Cash Flow Focused
(1)
($ in millions)
(2)
Unadjusted
Cash and Cash Equivalents $161 $446
Debt
Maturity
Revolving Credit Facility 2025 $190 $190
2L Notes 2028 $216 $216
Total Debt $406 $406
Liquidity $636 $921
Net Debt / (Cash) $245 ($40)
Pro forma for
Saudi Asset Sale
As of June 30, 2021

15
Updated
2021 Guidance
(1,2)
Preliminary
2022 Guidance
(1)
Adjusted Revenue
(3)
$860 - $890 $975 - $1,050
Adjusted EBITDA
(3), (4)
$95 - $115 $265 - $300
Capital Expenditures $175 - $195 $105 - $120
(1) Noble provides guidance based on guidance basis, which is a non-GAAP financial measure. Management evaluates Noble’s financial performance in part based on guidance basis, which management
believes enhances investors’ understanding of Noble’s overall financial performance by providing them with an additional meaningful and relevant comparison of current and anticipated future results
across periods. The adjustments to arrive at guidance basis are described below. Due to the forward-looking nature of Adjusted EBITDA, management cannot reliably predict certain of the necessary
components of the most directly comparable forward-looking GAAP measure. Accordingly, the company is unable to present a quantitative reconciliation of such forward-looking non-GAAP financial
measure to the most directly comparable forward-looking GAAP financial measure without unreasonable effort.
(2) The Company has combined the 2021 results for the Predecessor and Successor periods as non-GAAP measures when giving full-year 2021 guidance since we believe it provides the most meaningful
basis to analyze our 2021 results.
(3) Adjusted to exclude recognition of the non-cash intangible contract asset amortization of ~$51 million and ~$44 million in 2021 and 2022, respectively. Without these adjustments, Revenue guidance
ranges for 2021 and 2022 would be $809 million - $839 million and $931 million - $1,006 million, respectively.
(4) The Company discloses Adjusted EBITDA (Operating Profit/loss excluding Depreciation and Amortization and, when applicable, Other Items). Other Items include amortization of intangible contract
assets, restructuring related items, merger and integration costs, and non-cash stock-based compensation expense related to the Company’s management incentive plan.
(5) Of the total calendar days available for our fleet in 2022, Noble assumes 86% of the days are operating days (excluding cold stacked rigs). Of the operating days, 61% are currently under firm contract,
and 22% are assumed exercised options. 22% of the available days are under the CEA agreement where the market rate has yet to be determined.
($ in millions)
As of September 9
th
, 2021
Financial Guidance
(5)
(5)

16
(1) The dayrates, utilizations, and business results shown here are hypothetical. The information is provided with the sole intention of highlighting how Noble’s business profitability might vary
across various market scenarios and should not be misconstrued as guidance.
(2) Highly Illustrative annual EBITDA calculation is representative of 10 active floaters and 8 jackups (pro forma divestment of 4 jackup rigs) operating under Noble’s current cost structure. Noble
Lloyd Noble dayrate is illustratively assumed at $275k for all cases. Calculations do not adjust for Noble’s current contract profile.
Highly Illustrative EBITDA sensitivity to Dayrates and Utilization for Noble’s fleet
(1) (2)
Noble has significant earnings power with its current fleet
Floater dayrates $250k $275k $300k
Jack-up dayrates $80k $100k $120k
Fleet Utilization 85% 88% 90%
Highly Illustrative EBITDA ~$275mm ~$460mm ~$650mm

17
Noble is the
platform for
investment in
offshore drilling
Noble represents a Yield + Growth opportunity for investors
Why Noble?

www.noblecorp.com

1919
Additional
Information

20
Reconciliation of Adjusted EBITDA
Income (loss) before income taxes $ 18,576 $ (25,271) $ 253,651 $ (2,844,179) $ (25,597)
Interest expense, net of amounts capitalized 7,863 6,895 229 67 23,427
Interest income and other, net (6,509) (8) (399) (466) (7,872)
Depreciation and amortization 25,339 14,244 20,622 90,477 90,606
Loss on impairment - - - 2,795,891 -
Intangible contract amortization 14,256 8,459 - - -
Professional services - tax refund success fee 4,679 - - - -
Professional services - corporate projects 3,414 - - - -
Merger and integration costs 6,740 2,013 - - -
Gain on bargain purchase (64,479) - - - -
(Gain)/Loss on extinguishment of debt - - - - (17,847)
Pre-petition charges - - - - 3,894
Reorganization items, net - - (252,051) 14,916 9,014
Adjusted EBITDA $ 9,879 $ 6,332 $ 22,052 $ 56,706 $ 75,625
Successor
Period from
Period from
Predecessor
Three Months Ended
Three Months Ended
31-Dec-20
30-Sep-20
30-Jun-21
31-Mar-21
5-Feb-21
6-Feb-21
1-Jan-21
Three Months Ended
through
through
Non-GAAP Reconciliation
(1) Certain non-GAAP performance measures and corresponding reconciliations to GAAP financial measures for the Company have been provided for meaningful comparisons between current results
and prior operating periods. Generally, a non-GAAP financial measure is a numerical measure of a company's performance, financial position, or cash flows that excludes or includes amounts that
are not normally included or excluded in the most directly comparable measure calculated and presented in accordance with generally accepted accounting principles. In order to fully assess the
financial operating results, management believes that the use of EBITDA, or earnings before interest, taxes, depreciation and amortization, adjusted for the items listed above, is an appropriate
measure of the continuing and normal operations of the Company. These non-GAAP adjusted measures should be considered in addition to, and not as a substitute for, or superior to, contract
drilling revenue, contract drilling cost, contract drilling margin, average daily revenue, operating income, cash flows from operations, or other measures of financial performance prepared in
accordance with GAAP. Please see the following Non-GAAP Financial Measures and Reconciliations for a complete description of the adjustments.
(2) Upon emergence, Noble adopted fresh-start accounting which resulted in Noble becoming a new reporting entity for accounting and financial reporting purposes. Accordingly, our financial
statements and notes after February 5, 2021 are not comparable to our financial statements and notes prior to that date. As required by GAAP, results must be presented separately for the
predecessor period from all prior dates through February 5, 2021 (the “Predecessor” period) and the successor period from February 6, 2021 through all dates after (the “Successor” period).
($ in thousands)

21
Overview of Common Shares
Total Shares
Common Shares Issued at Emergence
50.0
Shares Issued to PACD 16.6
Total Common Shares Outstanding 66.6
Overview of Warrants
Strike Price
Expiration
Total Shares
Tranche 1 Warrants $19.27 02/08/28 8.3
Tranche 2 Warrants 23.13 02/08/28 8.3
Tranche 3 Warrants 124.40 02/08/26 2.8
Total Warrants 19.4
Total Shares + Warrants (excl MIP shares) 86.0
Common Shares and Warrant Overview
(1) Shares shown herein reflect shares prior to MIP shares.
(2) Includes 6.5mm shares converted to Penny Warrants after emergence. Penny Warrants are economically equivalent to ordinary shares.
(3) Sensitivity based on Treasury Stock Method and does not include any impact of Black-Scholes Protection as described in warrant agreements.
(1)(2)
(3)
(shares in millions)
Noble Share Price $20.00 $22.50 $25.00 $27.50 $30.00 $32.50 $35.00
Common Shares Outstanding 66.6 66.6 66.6 66.6 66.6 66.6 66.6
(+) Net Dilution from In-The-Money Warrants
0.3 1.1 2.1 3.2 4.2 5.0 5.7
Fully Diluted Noble Shares 66.9 67.7 68.7 69.8 70.8 71.6 72.3
Common Ownership 99.6% 98.4% 97.0% 95.4% 94.1% 93.0% 92.1%
Warrant Ownership 0.4% 1.6% 3.0% 4.6% 5.9% 7.0% 7.9%
Noble Share Summary
Illustrative Warrant Dilution Summary
