
NTIA TR-99-361
TECHNICAL CHARACTERISTICS OF RADIOLOCATION
SYSTEMS OPERATING IN THE 3.1-3.7 GHz BAND AND
PROCEDURES FOR ASSESSING EMC WITH FIXED
EARTH STATION RECEIVERS
report series
U.S. DEPARTMENT OF COMMERCE Ž National Telecommunications and Information Administration

NTIA TR- 99-361
TECHNICAL CHARACTERISTICS OF
RADIOLOCATION SYSTEMS OPERATING IN
THE 3.1-3.7 GHz BAND AND PROCEDURES
FOR ASSESSING EMC WITH FIXED
EARTH STATION RECEIVERS
Steven K. Jones
Robert L. Hinkle
Frank H. Sanders
Brad J. Ramsey
U.S. DEPARTMENT OF COMMERCE
William M. Daley, Secretary
Gregory Rohde, Assistant Secretary
for Communications and Information
December 1999

iii
TABLE OF CONTENTS
Page
1.0 INTRODUCTION ......................................................... 1
1.1 Background ............................................................ 1
1.2 Objectives .............................................................. 2
1.3 Approach .............................................................. 2
2.0 RADAR FUNCTIONS IN THE 3.1-3.7 GHz BAND ............................... 2
3.0 LOCATION OF RADAR OPERATIONS IN THE 3.1-3.7 GHz BAND ............... 2
4.0 TECHNICAL CHARACTERISTICS OF RADARS IN THE 3.1-3.7 GHz BAND ....... 9
4.1 Shipboard Radars ........................................................ 9
4.1.1 Shipboard Radar Transmitters .......................................... 9
4.1.2 Shipboard Radar Antennas ............................................. 9
4.2 Airborne Radars ......................................................... 9
4.2.1 Airborne Radar Transmitter ............................................ 10
4.2.2 Airborne Radar Antenna ............................................... 10
4.3 Land-Based Radars ....................................................... 10
4.3.1 Land-Based Radar Transmitter .......................................... 10
4.3.2 Land-Based Radar Antenna ............................................ 10
5.0 ELECTROMAGNETIC INTERFERENCE MECHANISMS .......................12
5.1 Receiver Front-End Overload ............................................... 12
5.2 Radar Transmitter Spurious Emission Coupling .................................. 12
6.0 ASSESSING THE ELECTROMAGNETIC COMPATIBILITY ..................... 12
6.1 Assessing the Potential for Receiver Front-End Overload .......................... 12
6.2 Assessing the Potential for EMI from Radar Spurious Emissions ..................... 14
7.0 METHODS FOR PRECLUDING OR MITIGATING RADAR EMI ................. 16
7.1 Methods for Reducing the EMI Potential of Radar Transmitters ..................... 16
7.1.1 Emissions fitering ....................................................16
7.1.2 Operational guidelines ................................................ 16
7.2 Methods for Reducing Earth Station Receiver Susceptibility to Radar Emissions ......... 17
7.2.1 Site selection ....................................................... 17
7.2.2 RF filtering ......................................................... 17
7.2.3 Use of high performance antennas ....................................... 17
7.2.4 Use of error-correction digital signal processing ............................. 17
8.0 ADDITIONAL INFORMATION .............................................. 17

iv
LIST OF FIGURES
Figure Page
1 Homeports, Shipyards, Maintenance Facilities, Test Ranges, and Other Fixed Sites. ...... 6
2 Military Operating Areas, Restricted Areas, and Military Training Routes in the
United States .............................................................7
3 Frequency Dependent Rejection for Shipboard Radar A ........................... 15
4 Frequency Dependent Rejection for Shipboard Radar B ........................... 15
5 Frequency Response Curve for a Typical Commercial 3.7-4.2 GHz Bandpass Filter ....... 18
LIST OF TABLES
Table Page
1 Shipboard Radar A Land-Based Test and Training Sites ........................... 3
2 Shipboard Radar B Land-Based Test and Training Sites ........................... 3
3 Shipboard Radars A and B Homeports ........................................ 3
4 Naval At-Sea Operational Areas ............................................. 4
5 Land-Based Radar Test and Training Sites ..................................... 8

1
National Telecommunications and Information Administration, U.S. Department of
Commerce, NTIA Report 94-313, Analysis of Electromagnetic Compatibility Between Radar
Stations and 4 GHz Fixed-Satellite Earth Stations (July 1994).
2
National Telecommunications and Information Administration, U.S. Department of
Commerce, Summary of Measurements and Tests Related to RF Interference at Bath, Maine
(September 1997).
1
1.0 INTRODUCTION
1.1 Background
The Federal Government operates fixed and mobile radionavigation and radiolocation radar
systems in the 3.1-3.7 GHz band in accordance with the U.S. National Table of Frequency Allocations
(Table). The Table allocates the Government radiolocation service on a primary basis in the 3.1-3.7
GHz band. Overlapping this band, and extending above it, is a non-government primary allocation for
the fixed-satellite service (FSS) from 3.6-4.2 GHz. Frequency assignments to non-government FSS
systems in the 3.6-3.7 GHz band have been subject to an electromagnetic compatibility analysis, on a
case-by-case basis, under Footnote US 245 to the Table. However, the 3.65-3.70 GHz band segment
has recently been transferred from Federal control to the Federal Communications Commission (FCC)
under the provisions of the Omnibus Budget Reallocation Act of 1993 (OBRA 93). Federal frequency
assignments have been withdrawn or limited to a non-interference basis by the National
Telecommunications and Information Administration (NTIA) and Footnote US 245 no longer applies to
the fixed-satellite assignments in this segment of the band. Although the 3.65-3.70 GHz is no longer
allocated to the Government Radiolocation service, some of the Federal radars that were operating in
this portion of the band are permitted to continue operations under the “mixed use” allocation status
specified in OBRA 93. In addition, radar operations aboard US Navy ships at sea may continue to
operate up to 3.7 GHz on a non-interference basis. For these reasons, the frequency range considered
in this report is 3.1-3.7 GHz.
In recent years, there has been a significant increase in the number of reported cases of
electromagnetic interference (EMI) to 3.7-4.2 GHz FSS earth stations from radar stations operating in
the 3.1-3.7 GHz band. The increase in reported interference cases has been largely attributed to the
rapid growth of television receive-only (TVRO) and audio distribution receive-only (ADRO) earth
stations, and the trend towards the use of digital modulations by satellite systems. As the FSS expands
their use of spectrum below 3.65 GHz, EMI interactions are anticipated to further increase. Since the
radars involved in the reported interference cases have been Federal Government systems, the National
Telecommunications and Information Administration (NTIA) has investigated the causes of such
interference and developed recommended solutions to these problems.
To identify the causes of and potential solutions to these reported interference cases, NTIA has
sponsored several measurement and analysis efforts.
1,2
In addition to the measurement and analysis
efforts, a joint working group was formed in August 1997, co-chaired by NTIA and the Federal
Communications Commission (FCC), to discuss these EMI issues and recommend solutions. One
recommendation provided by this working group was to gather technical data on Government radars

3
The radar operational and technical characteristics presented in the report are
representative as of the date of the report. This report will be updated as the electromagnetic
environment changes.
2
operating in the 3.1-3.7 GHz band, in particular, those radars that operate near the upper band edge,
and to make this information available to the FCC for dissemination to the private sector, in particular,
to current and prospective operators of adjacent band satellite earth stations.
1.2 Objectives
The objectives of this report were to: 1) identify operational characteristics of representative
Government radars operating in the 3.1-3.7 GHz frequency band,
3
2) outline a procedure for assessing
the potential for EMI from these radars to adjacent-band FSS earth station receivers, and 3) identify
methods for mitigating any received EMI.
1.3 Approach
Operating characteristics of radar transmitters in the 3.1-3.7 GHz band were provided for
representative systems. Where applicable, installation locations and operational areas were defined. A
method was presented for assessing the electromagnetic compatibility (EMC) between these radar
systems and FSS earth station receivers operating, or planned for operation, in the 3.6-4.2 GHz band.
Methods for precluding or mitigating EMI from adjacent-band radars were discussed.
2.0 RADAR FUNCTIONS IN THE 3.1-3.7 GHz BAND
High power, highly mobile, shipboard, airborne, and land-based radars operate in the 3.1-3.7 GHz
frequency band throughout the world. Functions performed include the search and tracking of near-
surface and high-altitude airborne projectiles, sea surveillance, and tracking of airborne objects.
3.0 LOCATION OF RADAR OPERATIONS IN THE 3.1-3.7 GHz BAND
Ship and aircraft radar platforms are highly mobile and their on-board high-power radar systems
are designed to cover broad areas consistent with their mission to defend the United States. Routine
naval operations are more limited geographically than airborne operations and occur principally in
coastal areas, shipyards, and training ranges. Accordingly, radars operating in these areas present a
potential for EMI to fixed earth station receivers that can be somewhat more predictable. Tables 1 and
2 identify land-based locations in the United States where testing and training operations for two of the
most prevalent shipboard radars, denoted as radars A and B, are conducted. Table 3 lists locations
where testing and maintenance of these radar systems can occur when the host ship is in port. Table 4
identifies “at-sea” operational areas (OPAREAs) where training exercises and system qualification tests
are routinely conducted. Figure 1 graphically depicts areas where the above-described testing, training,
and maintenance operations occur within the continental United States (CONUS), Hawaii and the
Carribean. A 150-km contour, consistent with the maximum range of the radar systems examined in
this paper, has been drawn around each radar site to indicate areas where these radars may interact with
adjacent-band users. For the “at-sea” OPAREAs, the solid line represents the OPAREA boundary and

3
the dashed line depicts the boundary of an area in which adjacent band users could be affected by radar
operations. Any satellite earth station planned for operation within the bounds of one or more of these
contours should assess the potential for EMI from radar operations in the adjacent band.
Table 1. Shipboard Radar A Land-Based Test and Training Sites.
RADAR LOCATION LATITUDE LONGITUDE
Pensacola, FL 30E 21' 28" N 087E 16' 26" W
Pascagoula, MS 30E 22' 00" N 088E 29' 00" W
St. Inigoes, MD 38E 10' 00" N 076E 23' 00" W
Table 2. Shipboard Radar B Land-Based Test and Training Sites.
RADAR LOCATION LATITUDE LONGITUDE
Moorestown, NJ 39E 58' 49" N 074E 56' 30" W
Wallops Island, VA 37E 56' 00" N 075E 28' 00" W
Table 3. Shipboard Radars A and B Home Ports.
RADAR LOCATION LATITUDE LONGITUDE
Bath, ME 43E 54' 25" N 069E 48' 48" W
Bremerton, WA 47E 33' 24" N 122E 38' 11" W
Everett, WA 47E 58' 58" N 122E 13' 54" W
Mayport, FL 30E 23' 34" N 081E 24' 27" W
Norfolk, VA 36E 52' 00" N 076E 21' 00" W
Pascagoula, MS 30E 22' 53" N 088E 29' 33" W
Pearl Harbor, HI 21E 20' 00" N 158E 00' 00" W
Portland, ME 43E 41' 00" N 070E 18' 00" W
San Diego, CA 32E 41' 05" N 117E 08' 00" W

4
Table 4. Naval At-Sea Operational Areas
OPERATIONAL AREA LATITUDE LONGITUDE
Atlantic Fleet Weapons
Training Facility (AFWTF)
North Range
18E 30' 00" N
20E 00' 00" N
22E 10' 00" N
22E 10' 00" N
18E 50' 00" N
18E 50' 00" N
18E 25' 00" N
18E 30' 00" N
18E 30' 00" N
067E 00' 00" W
067E 00' 00" W
065E 48' 00" W
065E 20' 00" W
062E 00' 00" W
062E 00' 00" W
064E 30' 00" W
064E 45' 00" W
066E 38' 00" W
067E 00' 00" W
AFWTF South Range
18E 05' 00" N
18E 05' 00" N
18E 15' 00" N
18E 15' 00" N
17E 00' 00" N
16E 58' 00" N
15E 33' 00" N
15E 39' 00" N
16E 30' 00" N
16E 30' 00" N
067E 55' 00" W
065E 27' 00" W
065E 10' 00" W
064E 10' 00" W
064E 10' 00" W
064E 28' 00" W
066E 06' 00" W
066E 23' 00" W
066E 23' 00" W
067E 55' 00" W
Atlantic Underwater Test and
Evaluation Center (AUTEC)
25E 20' 00" N
25E 20' 00" N
23E 25' 00" N
23E 25' 00" N
078E 05' 00" W
077E 45' 00" W
076E 20' 00" W
077E 15' 00" W
FORACS, Hawaii
21E 25' 30" N
21E 21' 00" N
21E 15' 00" N
21E 15' 00" N
158E 11' 00" W
158E 15' 00" W
158E 08' 00" W
158E 07' 00" W
Gulf of Mexico OPAREA
29E 36' 01" N
29E 25' 21" N
28E 41' 01" N
28E 52' 31" N
080E 01' 30" W
086E 48' 00" W
086E 48' 00" W
087E 44' 00" W
Pacific Missile Range Facility
(PMRF)
22E 00' 00" N
22E 08' 00" N
22E 45' 00" N
26E 00' 00" N
159E 45' 00" W
162E 00' 00" W
161E 40' 00" W
158E 15' 00" W

OPERATIONAL AREA LATITUDE LONGITUDE
5
Pearl Harbor South OPAREA
19E 08' 00" N
21E 00' 00" N
21E 00' 00" N
19E 18' 00" N
18E 49' 00" N
159E 15' 00" W
158E 08' 00" W
157E 36' 00" W
156E 20' 00" W
157E 45' 00" W
Southern California (SOCAL)
OPAREA
38E 52' 00" N
39E 00' 00" N
31E 15' 00" N
30E 00' 00" N
125E 52' 00" W
124E 00' 00" W
116E 30' 00" W
120E 30' 00" W
Virginia Capes OPAREA
38E 45' 00" N
38E 45' 00" N
37E 45' 00" N
35E 06' 00" N
32E 00' 00" N
34E 24' 00" N
35E 40' 00" N
37E 00' 00" N
075E 00' 00" W
074E 30' 00" W
072E 40' 00" W
072E 40' 00" W
077E 12' 00" W
077E 30' 00" W
075E 25' 00" W
075E 50' 00" W

6
S. California
OPAREA
Gulf of Mexico
South Range P.R.
AUTEC
Virginia
Capes
OPAREA
North Range P.R.
Pearl Harbor S. OPAREA
FORACS
PMRF
Note: The highly mobile
nature and National Defense
mission of naval radars
extend the potential
shipboard radar operational
areas to include ALL waters
and thereby ALL coastal
areas of the United States
and Possessions.
Pensacola
Pearl Harbor
Portland
Bath
Moorestown
Norfolk
Wallops Island
St. Inigoes
Mayport
Pascagoula
San Diego
Everett
Bremerton
Figure 1. Homeports, Shipyards, Maintenance Facilities, Test Ranges, and Other Fixed Sites.
Radar Locations ( Ž ), OPAREA Boundaries ( ), 150 km Contours (- - -).

7
Note that while Figure 1 depicts areas where naval shipboard radar operations are common, the
high mobility and National Defense mission of Navy ships extends the potential operational area to
include all waters, and thereby all coastal areas, of the United States and Possessions (US&P). Thus,
earth stations outside of the 150-km contours indicated in Figure 1, particularly those within 150 km of
the US&P coast, should be aware of potential interactions with mobile shipboard radars.
Airborne operations of radar systems in this band can occur anywhere in the US&P. Figure 2
shows the existing nominal military operating areas (MOAs), restricted areas (RAs), and military training
routes (MTRs) where military flights are most likely, although specific missions may require unscheduled
airborne radar system operations in this band anywhere in the US&P at anytime, day or night. Note that
at nominal altitudes of 30 thousand feet, the radio line-of-sight extends for hundreds of kilometers
beyond the areas and routes shown in Figure 2. Spurious emissions from these radars are typically
suppressed due to the need to eliminate clutter and other unwanted transmitted energy and the
requirement to operate in hostile electromagnetic environments. As a result of the low spurious
emissions associated with these radars, the potential for EMI interactions with other spectrum users is
reduced considerably.
Figure 2. Military Operating Areas, Restricted Areas, and Military Training
Routes in the United States.
The land-based radars operating in this band are normally fielded in a tactical deployment;
however, they are also used for testing and training purposes at a number of locations within CONUS.
These locations are listed in Table 5.

8
Table 5. Land-Based Radar Test and Training Sites.
RADAR LOCATION LATITUDE LONGITUDE
Fort Lewis, WA 47E 05' 25" N 122E 35' 10" W
Yakima Firing Center, WA 46E 40' 18" N 120E 21' 35" W
Fort Carson, CO 38E 38' 10" N 104E 47' 50" W
Fort Riley, KS 38E 58' 13" N 096E 51' 39" W
Fort Shafter, HI 21E 18' 00" N 157E 49' 00" W
Hunter AAF, GA 32E 01' 00" N 081E 08' 00" W
Fort Gillem, GA 33E 36' 00" N 084E 19' 00" W
Fort Benning, GA 32E 21' 30" N 084E 58' 15" W
Fort Stewart, GA 31E 51' 45" N 081E 36' 55" W
Fort Rucker, AL 31E 19' 47" N 085E 42' 55" W
Yuma Proving Grounds, AZ 33E 01' 14" N 114E 18' 55" W
Fort Hood, TX 31E 08' 30" N 097E 45' 50" W
Fort Knox, KY 37E 53' 50" N 085E 56' 55" W
Fort Bragg, NC 35E 08' 05" N 079E 00' 35" W
Fort Campbell, KY 36E 39' 50" N 087E 28' 20" W
Fort Polk, LA 31E 03' 43" N 093E 12' 26" W
Fort Leonard Wood, MO 37E 44' 30" N 092E 07' 37" W
Fort Irwin, CA 35E 15' 36" N 116E 41' 02" W
Fort Sill, OK 34E 40' 24" N 098E 23' 52" W
Fort Bliss, TX 31E 48' 50" N 106E 25' 33" W
Fort Leavenworth, KS 39E 21' 15" N 094E 55' 00" W
Fort Drum, NY 44E 01' 15" N 075E 48' 44" W
Fort Gordon, GA 33E 25' 10" N 082E 09' 10" W
Fort McCoy, WI 44E 06' 36" N 090E 41' 27" W
Fort Dix, NJ 40E 00' 25" N 074E 37' 13" W
Parks Reserve Forces Training Area, CA 37E 42' 54" N 121E 42' 18" W
Aberdeen Proving Ground, MD 39E 28' 25" N 076E 06' 55" W
Fort Huachuca, AZ 31E 35' 00" N 110E 20' 00" W
Fort Monmouth, NJ 40E 19' 00" N 074E 02' 15" W
Picatinny Arsenal, NJ 40E 56' 00" N 074E 34' 00" W
Redstone Arsenal, AL 34E 36' 30" N 086E 36' 10" W
White Sands Missile Range, NM 32E 22' 46" N 106E 28' 13" W
Army Research Laboratory, MD 39E 00' 00" N 076E 58' 00" W
Fort Hunter Ligget, CA 35E 57' 56" N 121E 14' 04" W
Kelly Support Facility, PA 40E 23' 57" N 080E 09' 25" W
9
4.0 TECHNICAL CHARACTERISTICS OF RADARS IN THE 3.1-3.7 GHz BAND
Representative characteristics of Government radiolocation systems in the 3.1-3.7 GHz band are
provided in Table 6. The data are sufficient for general calculations to assess the electromagnetic
compatibility (EMC) between the radars and adjacent-band FSS systems.
4.1 Shipboard Radars
Two representative types of shipboard radars operating in the 3.1-3.7 GHz band are depicted in
Table 6 as Radar A and Radar B. Radar A is typical of the primary Air Traffic Control system aboard
U.S. aircraft carriers. Radar B is typical of the multi-function radars deployed aboard escort ships.
Operational areas of these shipboard radars include both littoral regions and the high seas. These radars
typically are operated on a 24-hour schedule. Up to ten of type B radars may operate simultaneously
during escort missions. In addition to being located on shipboard platforms, there are fixed installations
of these shipboard radars located on land that are used for training and testing, as listed in Tables 1 and
2. Also, routine maintenance and testing operations require that these radars be activated occasionally in
certain ports.
4.1.1 Shipboard Radar Transmitters
Radar A transmits in the 3.5-3.7 GHz band with a peak power of 1 MW. Radar B transmits in the
3.1-3.5 GHz band with a peak power of 4 MW and uses a combination of phase modulation and
frequency hopping. Radar B emissions are frequency agile over ten bands, each 40 MHz wide,
designated as bands 1 through 10. The sequence of variable pulse widths is random.
4.1.2 Shipboard Radar Antennas
Radar A uses a mechanically rotating reflector type antenna with an azimuth beamwidth of 1.5E
and fan beam in elevation from 5.8E to 45E with a mainbeam gain of 32 dBi. The nominal antenna
height is 46 meters above the ships water line. Radar B uses four planar electronically-steered phased-
array antennas to provide 360E coverage with a mainbeam gain of 42 dBi. The nominal height of the
Radar B antenna is 20 meters above the ships water line.
4.2 Airborne Radars
The technical characteristics of an example airborne radar that operates within the
3.1-3.7 GHz band are also given in Table 6. Airborne radars are used to conduct long-range
surveillance and target tracking. Aircraft carrying these radars are capable of worldwide operations.
They typically are operated at about 30,000 feet (though the radar will also be in operation while
climbing to, and descending from nominal operating altitude) and can be operated for extended periods
of up to 12 hours. In some situations constant surveillance is maintained on a 24-hour-per-day basis.
10
4.2.1 Airborne Radar Transmitter
The example airborne radar transmitter uses a klystron output device which emits a relatively
“clean” spectrum with improved unwanted emission characteristics; however, the use of such output
devices is not always feasible, depending on the overall radar architecture and mission-driven system
parameters. For example, solid state output devices may offer other operational advantages at the cost
of higher spurious outputs. Typical peak output power of airborne radar transmitters can be as high as 1
MW.
4.2.2 Airborne Radar Antenna
The antenna used by the example airborne radar system is a large, slotted waveguide array
assembly mounted atop of the airframe. It provides a 40 dBi mainbeam gain with an estimated sidelobe
gain of -10 dBi. The nominal operation height of aircraft equipped with this radar is 30,000 feet above
ground level.
4.3 Land-Based Radars
The technical characteristics for an example land-based radar system operating in this band are
listed in Table 6. The system is an artillery locating radar used by US Army field artillery units. It is
used to detect and track incoming projectiles and provide the location of the source and the point of
impact. The radar is capable of operation in either single frequency or frequency agile modes in the
3.11-3.39 GHz segment of the band.
4.3.1 Land-Based Radar Transmitter
The example radar transmitter employs a two-stage amplifier chain comprised of a solid-state first
stage and a liquid-cooled traveling-wave tube (TWT) second stage. A crystal-controlled frequency
synthesizer generates 15 frequencies, spaced 20 MHz apart, from 3.11 to 3.39 GHz. Both search and
track waveforms have nonlinear frequency modulation (FM) coding.
4.3.2 Land-Based Radar Antenna
The example land-based radar set antenna is a phased array with phase scanning in both azimuth
and elevation. The antenna is 2.36 meters wide by 3.66 meters high. Three beams are formed; a sum
beam (used on transmit and receive) and monopulse beams in azimuth and elevation. An auxiliary beam
for coherent sidelobe cancellation is also available.

11
Table 6. Technical Characteristics of Representative 3.1-3.7 GHz Government Radars
CHARACTERISTIC
SHIPBOARD
SYSTEMS
AIRBORNE
SYSTEM
LAND-BASED
SYSTEM
RADAR
A
RADAR B
Modulation P0N Q7N Q7N P0N
Tuning Range (GHz) 3.5-3.7 3.1-3.5 --- 3.1-3.4
Peak Transmitter Power into
Antenna (MW)
1 4 1 0.12
Pulse Width (Fsec) 1.0 3.2-51.2 1, 25 10.75
Pulse Repetition Rate (kHz) 1.125 0.152-6.0 2 2793.3 to 5050.51
Compression Ratio N/A --- 250 ---
Duty Cycle (%) 0.001 0.8-2.0 5 0.041
Transmitter 3-dB Bandwidth
(MHz)
4, 16.6 4 >30 1 (Narrowband); 10
(Wideband)
Mainbeam Antenna Gain
(dBi)
32 42 40 36
Antenna Type Reflector Phased Array Slotted Waveguide
Array
Phase Scan Array
Antenna Beamwidth (deg.)
(Horizontal/Vertical)
4.4/1.75 1.7/1.7 1.2/3.5 ---
Nominal Antenna Height 46 m 20 m 30,000 ft ---
Max Vert. Scan (deg.) NA 90 60 30
Horizontal Scan Type Rotating N/A Rotating N/A
Max Horizontal Scan (deg.) 360 360 360 90
Horizontal Scan Rate
(deg./sec.)
90 --- 36 ---
Polarization --- V --- V
N/A = Not Applicable
--- = Not Available

12
5.0 ELECTROMAGNETIC INTERFERENCE MECHANISMS
Investigations of several interference cases have identified two primary EMI coupling mechanisms
between radar stations in the 3.1-3.7 GHz band and adjacent-band fixed-satellite service earth stations.
These are front-end overload in the earth station receiver, and radar transmitter spurious emissions. A
detailed discussion of the interference mechanisms are provided in Reference 1, which is available on the
worldwide web at www.its.bldrdoc.gov.
5.1 Receiver Front-End Overload
This mechanism occurs when energy from the fundamental frequency (necessary emissions) of an
undesired signal saturates the low noise amplifier (LNA) in the victim receiver front-end, resulting in
gain compression of the desired signal sufficient to degrade performance. Receiver front-end overload is
typically a result of inadequate RF selectivity ahead of the LNA in the front-end of the victim FSS earth
station receiver.
5.2 Radar Transmitter Spurious Emission Coupling
This form of interference occurs when out-of-band or spurious energy emitted from the radar
transmitter falls within the passband of the FSS earth station receiver. This energy then passes through
the receiver front-end with little or no attenuation. When the undesired emission levels are high relative
to the desired signal level, a performance degradation to the receiver can occur. A dominant factor
affecting the level of spurious emissions from a radar system is the type of transmitter output device
employed.
6.0 ASSESSING THE ELECTROMAGNETIC COMPATIBILITY (EMC)
Analysis procedures for assessing the EMC between the Government radar stations and the
adjacent-band earth stations are presented in Reference 1 for each of the interference mechanisms
discussed in this paper. These procedures are summarized in the following paragraphs.
6.1 Assessing the Potential for Receiver Front-End Overload
The input threshold at which receiver front-end overload occurs is a function of the 1-dB gain
compression (saturation) level and the gain of the front-end LNA. Specifically:
T = C - G (1)
where:
T = input threshold at which receiver front-end overload occurs, dBm
C = output 1-dB gain compression (saturation) level of the LNA, dBm (typically +10 dBm)
G = the LNA gain at the radar fundamental frequency, dB.
A typical range of values for T is -55 to -40 dBm, depending on the gain of the LNA.

4
47 CFR § 25.209 specifies earth station antenna gain as [32 - 25 log
10
(2)] dBi for 1E #
2 # 48E and -10 dBi for 48E # 2 # 180E.
13
A potential for interference from receiver front end overload will exist whenever
I
max
$ T + FDR
RF
(2)
where:
I
max
= the maximum fundamental frequency radar signal level referenced to the input of
the earth station receiver, in dBm
T = input threshold at which receiver front-end overload occurs, in dBm
FDR
RF
= frequency dependent rejection of the radar fundamental from any RF selectivity
that may be ahead of the LNA or that may be inherent in the LNA itself, in dB
c.
The propagation path loss required to preclude front-end overload to an earth station receiver from
adjacent-band radar emissions can then be determined as follows:
L
P
= P
T
+ G
T
+ G
R
(2) - L
T
- L
R
- I
max
(3)
where:
L
P
= the propagation path loss between transmitting and receiving antennas necessary
to preclude front-end overload from radar emissions, in dB
P
T
= the peak power of the radar transmitter under analysis (from Table 1), dBm
G
T
= the main beam antenna gain of the radar under analysis (from Table 1), dBi
G
R
(2) = the earth station antenna gain in the direction of the radar station under analysis,
dBi
4
L
T
= the insertion loss in the radar station transmitter, in dB (2 dB assumed)
L
R
= the insertion loss in the earth station receiver, in dB (0 dB assumed)
I
max
= the maximum radar fundamental signal level, referenced to the input of the earth
station receiver, which precludes front-end overload, dBm.
Once the required propagation loss is determined, an appropriate propagation model should be
utilized to determine the necessary distance separation. Two propagation models utilized by NTIA are
contained in the Microcomputer Spectrum Analysis Model (MSAM) package, available at
http://ntiacsd.ntia.doc.gov/msam. One of these propagation models, the Terrain Integrated Rough Earth
Model (TIREM), will predict the propagation loss as a function of the existing terrain profile between
the radar transmitter and the earth station receiver site. TIREM considers topographic features only and
will not account for buildings or other man-made obstructions that may exist along the propagation path.
The second model, NLAMDA, calculates the propagation loss assuming a smooth Earth (e.g., no
topographic features) and thus yields more conservative propagation loss estimates than those obtained
from the TIREM model.

5
International Telecommunication Union Radiocommunication Sector (ITU-R)
Recommendation M.1314, Reduction of Spurious Emissions of Radar Systems Operating in the 3
GHz and 5 GHz Bands, Annex 1, at 5 (1997).
14
6.2 Assessing the Potential for EMI from Radar Spurious Emissions
The propagation path loss required to preclude spurious emission interference to an FSS earth
station receiver from adjacent-band radar emissions can be determined from:
L
P
= (C/I) - C + P
T
+ G
T
+ G
R
(2) - L
T
- L
R
- FDR
IF
(4)
where:
L
P
= the propagation path loss between transmitting and receiving antennas necessary
to preclude interference from radar spurious emissions, in dB
C/I = the carrier-to-interference ratio at the predetector input (IF output) necessary to
maintain acceptable performance criteria, dB (+12 dB nominal)
C = the received carrier signal level at the FSS earth station antenna output, dBm
(-105 to -95 dBm with -100 dBm nominal)
P
T
= the peak power of the radar transmitter under analysis (from Table 3), dBm
G
T
= the main beam antenna gain of the radar under analysis (from Table 3), dBi
G
R
(2) = the FSS earth station antenna gain in the direction of the radar station under
analysis, dBi (see footnote 4 in previous section)
L
T
= the insertion loss in the radar station transmitter, in dB (2 dB assumed)
L
R
= the insertion loss in the earth station receiver, in dB (0 dB assumed)
FDR
IF
= the frequency-dependent rejection of the radar unwanted emissions provided by
the receiver IF selectivity, dBc.
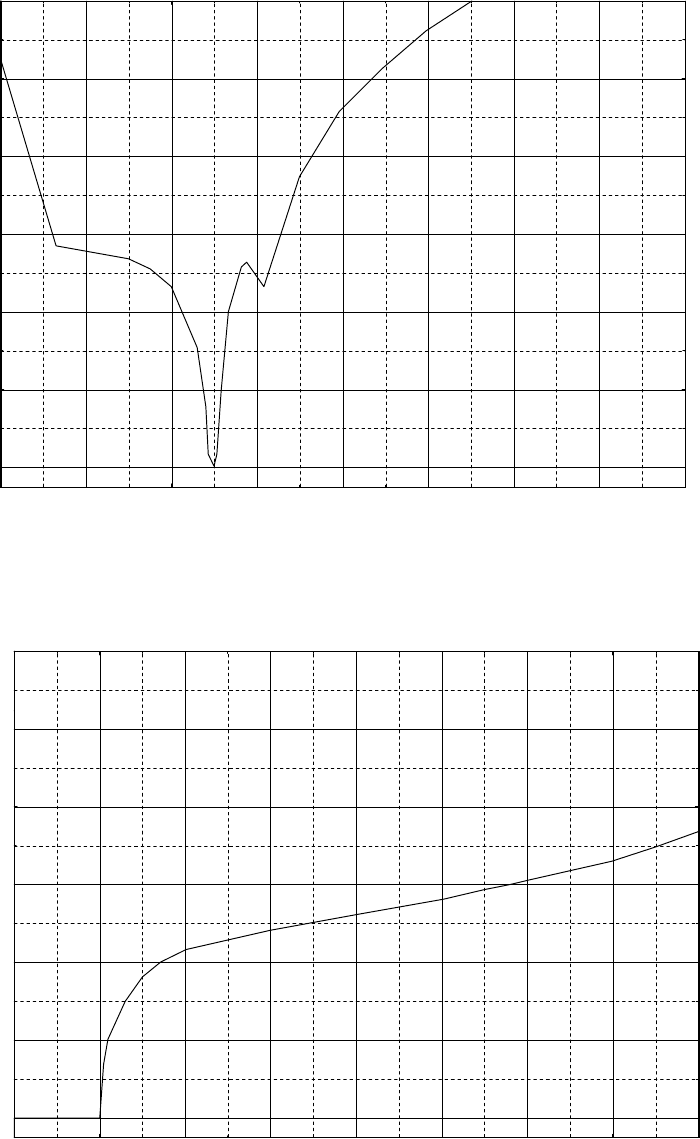
The FDR value to be used in Equation 4 can be determined from Figure 2 for shipboard radar A
and Figure 3 for shipboard radar B, which are based on measured emission spectra. The FDR shown in
these figures is based on a nominal receiver IF bandwidth of 25 MHz, assuming an ideal bandpass filter.
Once the required propagation loss is determined, an appropriate propagation model
should be utilized to determine whether the necessary propagation loss will be realized. A brief
description of these models and the Internet location where they can be accessed is given in the previous
section.
Measured FDR data for the example airborne radar is not provided in this report; however, the
example airborne radar transmitter utilizes a klystron output device with typical spurious emission levels
on the order of -110 to -120 dBc in a 1 MHz bandwidth.
5
To date, there have been no reported cases of
interference from this radar to earth stations operating above 3.6 GHz via transmitter spurious emission
coupling due to the low spurious emission levels. However, this conclusion may not be valid if training,
or other operations, require that several typical airborne radars operate simultaneously in the same
electromagnetic environment or when airborne radars must operate within line-of-sight of land or sea
based radars.
15
0
20
40
60
80
100
120
3400 3500 3600 3700 3800 3900 4000 4100 4200
Frequency, MHz
Frequency Dependent Rejection, in 25 MHz Bandwidth, dB
Figure 3. Frequency Dependent Rejection for Shipboard Radar A (assuming
an ideal 25 MHz receiver IF bandpass filter)
0
20
40
60
80
100
120
3400 3500 3600 3700 3800 3900 4000 4100 4200
Frequency, MHz
Frequency Dependent Rejection, in 25 MHz Bandwidth, dB
0
20
40
60
80
100
120
3400 3500 3600 3700 3800 3900 4000 4100 4200
Frequency, MHz
Frequency Dependent Rejection, in 25 MHz Bandwidth, dB
Figure 4. Frequency Dependent Rejection for Shipboard Radar B (assuming
an ideal 25 MHz receiver IF bandpass filter)
16
Measured FDR data for the example land-based radar is also not provided in this report; however,
it’s transmitter utilizes a traveling-wave tube (TWT) output device which has spurious emission levels
on the order of -105 to -115 dBc in a 1 MHz bandwidth (see Reference 5). Because of the low spurious
levels and the fact that the example land-based radar will be well removed in frequency from an FSS
earth station receiver, interference interactions are very unlikely. To date, there have been no reported
incidents of interference interactions between this radar and earth station receivers.
7.0 METHODS FOR PRECLUDING OR MITIGATING RADAR EMI
The adjacent-band EMI interactions described in this paper, can for the most part, be precluded or
mitigated by utilizing a combination of techniques applied to both the interfering transmitter and the
victim receiver. The following discussion offers some suggested methods for mitigating EMI between
these adjacent-band systems.
7.1 Methods for Reducing the EMI Potential of Radar Transmitters
7.1.1 Emission filtering
The spurious emission characteristics of a radar transmitter typically can be improved through
additional filtering. The disadvantages of this technique are: 1) emission filters capable of handling the
“high power” signals of a radar are typically bulky, heavy, and expensive; 2) because a radar normally
uses the same antenna system to transmit and to receive, burdensome configurations might be needed to
avoid incurring the filter insertion losses twice; and 3) whether or not additional filtering is feasible is
highly dependent upon the particular platform and radar system requirements. Nevertheless, the U.S.
Navy has installed emission filters in all of the shipboard type A radars in its inventory in an attempt to
mitigate adjacent-band EMI interactions. Retrofitting emission filters in the shipboard type B radar
system is not feasible due to technical problems associated with the phased-array antennas.
Airborne platforms may have severe weight and space limitations, in addition to output device
constraints, that may encumber the retrofitting of emission filters. The transmitter system used by the
typical example airborne radar system operating in this band, which may or may not be applicable to
other airborne radars with different operational requirements, demonstrates very good spurious emission
characteristics, attributable to the klystron output device utilized, and therefore does not require
additional filtering. The land-based radar also does not require filtering due to low spurious emission
levels produced by the TWT output device.
7.1.2 Operational guidelines
Guidelines for operation in areas where a potential for adjacent-band EMI exists can be an
effective mitigation technique. Currently, the U.S. Navy adheres to voluntary operational guidelines
(e.g., reduced power operation, sector blanking, and channel limitations) on shipboard radars when used
near U.S. coast lines and within ports. This mitigation technique is not applicable to airborne platforms,
particularly since their missions often specifically require, but do not limit, their operation to around
national borders and coastlines.
17
7.2 Methods for Reducing Earth Station Receiver Susceptibility to Radar Emissions
7.2.1 Site selection
The most effective technique for precluding EMI from adjacent band radar systems is the careful
selection of sites for FSS earth station receivers. Sites should be selected that provide adequate distance
separation or site shielding between an FSS earth station antenna and any high-power radar transmitter
in the environment. The information in Tables 1 through 4, and in Figure 1 can be used to aid in site
selection. In selecting sites in areas where radars are known to exist, maximum use should be made of
natural or man-made shielding between the antennas. Equations 3 and 4 can help to determine the
required path loss for precluding EMI from receiver front-end overload and spurious emissions,
respectively. Once determined, site locations can be evaluated based on achieving this required
propagation path loss from a combination of distance separation and shielding attenuation.
7.2.2 RF filtering
Based on the cases investigated to date, EMI from receiver front-end overload can be precluded by
improving the receiver’s RF selectivity ahead of the LNA. A bandpass filter can be installed ahead of the
receiver LNA at a relatively low cost (on the order of $400). Figure 4 shows a frequency response
curve for a commercially available 3.7-4.2 GHz bandpass filter. Installation of a similar filter has been
shown to be very effective in eliminating receiver front-end overload as an EMI mechanism.
7.2.3 Use of high performance antennas
The use of shrouded parabolic and horn antennas in areas where a potential for EMI from radars
exists can also be an effective mitigation technique. These antennas provide greater directivity toward
the desired satellite and reduce the gain of undesired energy in the receiver antenna sidelobe region.
This assumes that the earth station site is selected such that the receive antenna will not point in the
direction of the radar.
7.2.4 Use of error-correction digital signal processing
Advanced digital signal processing techniques, such as forward error correction coding and bit
interleaving, can be very effective in reducing the susceptibility of an FSS earth station receiver to EMI
from adjacent-band radars and from other interference sources.
8.0 ADDITIONAL INFORMATION
Additional information regarding U.S. Government radio operations can be obtained by writing to
the Office of Spectrum Management, National Telecommunications and Information Administration,
U.S. Department of Commerce, HCHB Room 4099, Washington, DC 20230.

18
Figure 5. Frequency Response Curve for a Typical
Commercial 3.7-4.2 GHz Bandpass Filter.
