
CRIME TRENDS
Since 1995, serious violent victimizations
2
in urban areas have decreased by approximately 74%. Other forms of
victimization, including simple assault and personal theft, have also declined by 75% and 74%, respectively. In comparison,
serious violent victimizations in rural areas have decreased by 67%, while simple assaults have dropped 74%.
3,4B
In 2015, victimizations of people from urban areas accounted
for 40% of all rapes and sexual assaults, 48% of robberies,
and 40% of aggravated assaults. Victimizations of people
from rural areas accounted for 5% of rapes and sexual
assaults, 5% of robberies, and 14% of aggravated assaults.
B4
Victimization by Location of Residence
B
While national-level crime statistics provide important information regarding overall crime trends, they cannot
always demonstrate differences in crime and victimization at the sub-national level or clearly isolate factors
contributing to crime. The Bureau of Justice Statistics has recognized the need for more nuanced sub-national
victimization data, and is working to estimate crime at the state and local levels through the National Crime
Victimization Survey (NCVS) Subnational program.
1
While existing research–including data collected by the FBI’s
Uniform Crime Reporting (UCR) program and the NCVS–indicates that urban areas generally have higher crime
rates than suburban or rural areas, there are exceptions. Demographics, geography, and culture each are related
to the incidence, prevalence, and types of victimization.
A
For more about the UCR and NCVS, see the Crime and
Victimization in the United States fact sheet in this series.
R
E
A
C
H
A
L
L
V
I
C
T
I
M
S
E
X
P
A
N
D
T
H
E
C
I
R
C
L
E
DID YOU KNOW?
In both urban and rural areas, youth ages 12 to 14 have
the highest rate of victimization.
B
LGBT students in rural locales experienced higher
frequencies of victimization at school based on their
sexual orientation or gender expression. They were also
less likely to have access to LGBT-related resources
or support.
C
Motor vehicle theft is 4x more likely to occur in urban
areas than rural areas.
B
Urban and Rural Victimization
Urban Victimization
B
rate per 1,000 people age 12 or older
Rural Victimization
B
rate per 1,000 people age 12 or older
56.4
60
1995 1997 1999 2003 20052001 2007 20152009 2011 2013
17.3
11.6
4.5
3.1
Simple assault
Aggravated assault
Robbery
Rape/Sexual assault
Personal theft
14.1
3.6
3.1
1.9
0.8
60
1995 1997 1999 2003 20052001 2007 20152009 2011 2013
37.9
8.3
2.9
1.5
0.6
9.7
3.0
0.7
0.6
0.1
Simple assault
Aggravated assault
Robbery
Rape/Sexual assault
Personal theft
2018 National Crime Victims’ Rights Week Resource Guide: Crime and Victimization Fact Sheets
Rape/Sexual assault
4
Aggravated assault
Robbery
4
60%
40
48
40
5
14
Urban
Rural
5
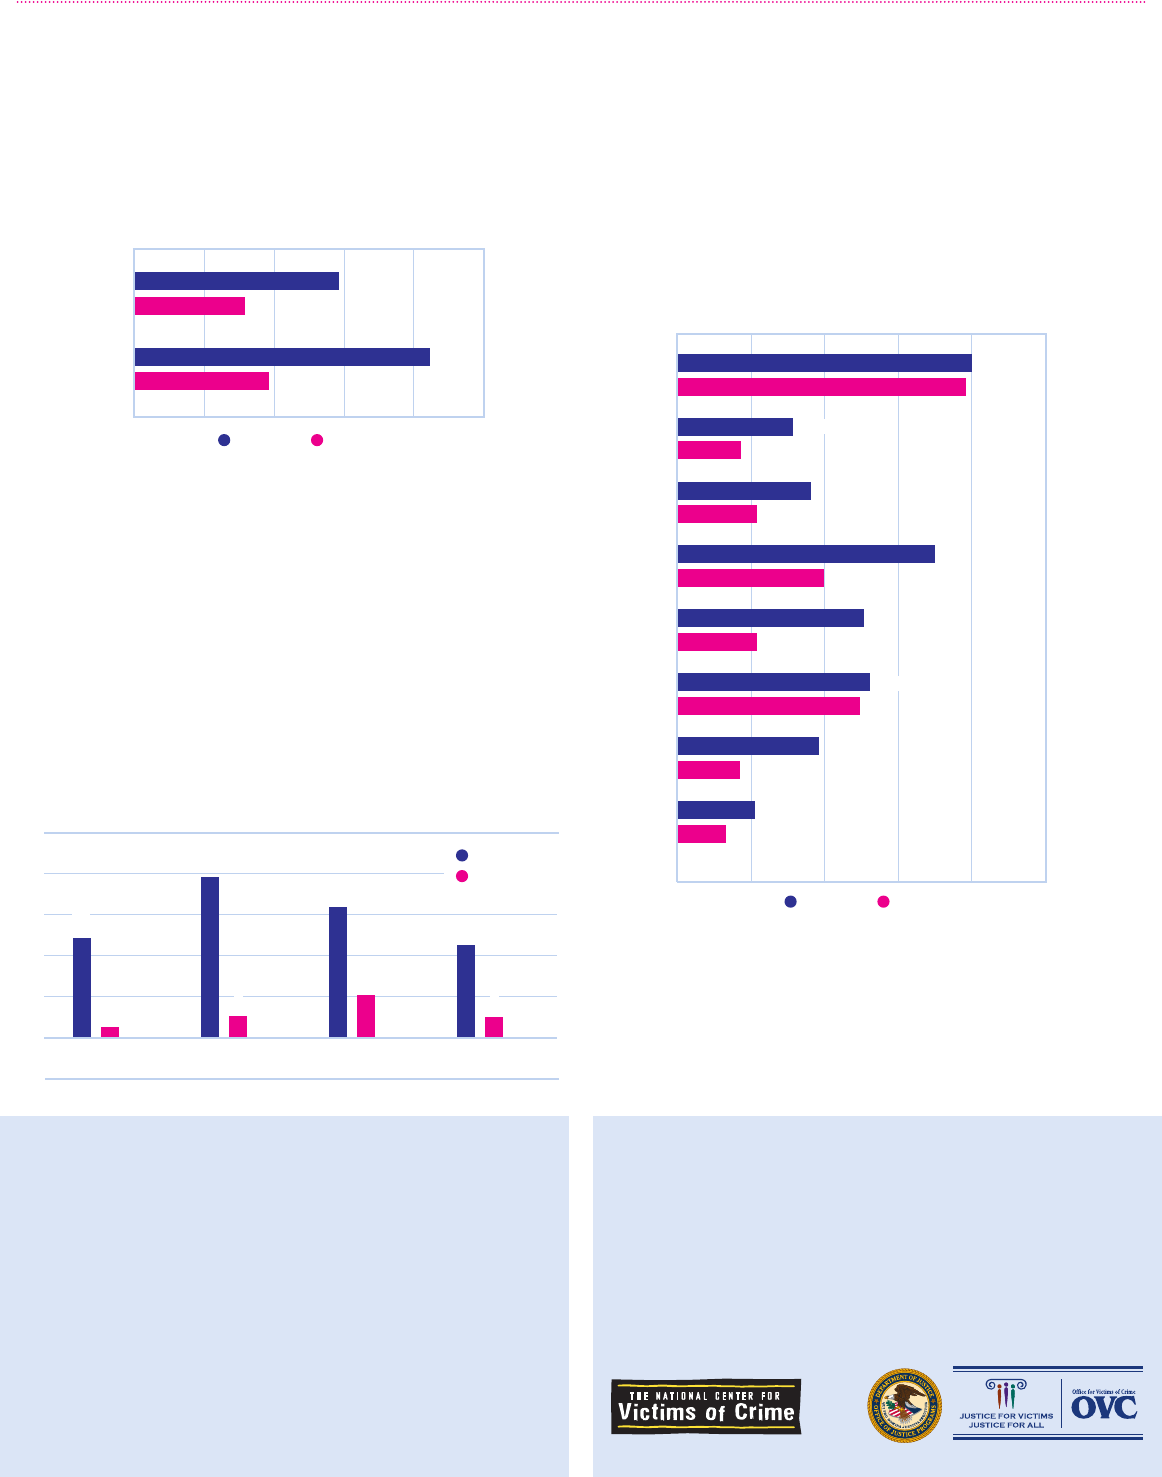
Residents of urban areas experienced the highest rates of
victimization in 2015. On average, the rate of serious violent
victimization among men and women in urban areas was
about 2x higher than in rural areas.
B
In 2015, rates of violent victimization for different
age groups were generally greater in urban than rural
communities, though those residents ages 12 to 14 and
35 to 49 experienced similar rates of victimization in
urban and rural areas. Youth ages 12 to 14 had the highest
rates of violent victimization in both urban and rural
communities.
B
Only 55% of serious violent victimizations in 2015 were
reported to the police. Victimizations of those living in
urban locales were more likely to be reported to the police,
compared to those in rural locales. Rape and sexual assault
are among the least reported forms of victimization; an
estimated 19% of rape and sexual assault victimizations
were reported to the police in urban areas. Comparatively, an
estimated 2% of rape and sexual assault victimizations were
reported to the police in rural areas.
B
Violent Victimization by Locale and Age
B
rate per 1,000 people
Serious Violent Victimization by Locale and Sex
B
rate per 1,000 people 12 or older
Victims Who Reported Victimization to Police
B
percentage by location of residence
Rape/
Sexual assault
Aggravated
assault
Robbery
40%
Urban
Rural
19
31
25
2
4
8
Simple
assault
18
4
NOTES
1 For more on this effort, see: www.bjs.gov/index.cfm?ty=tp&tid=911.
State- and local-level data will be available in future BJS reports.
2 Serious violent victimizations include rape/sexual assault, robbery, and
aggravated assault.
3 The NCVS also collects and reports information on victimization in sub-
urban areas. Generally, those numbers are mid-way between urban and
rural victimization, or are closer to urban than rural. For more information
on Suburban Victimization, please visit BJS’s Victimization Analysis Tool
(NVAT) at www.bjs.gov/index.cfm?ty=nvat.
4 Interpret data with caution, based on 10 or fewer sample cases or the
coefficient of variation is greater than 50%. For more information, please
see BJS NVAT note on Methodology: www.bjs.gov/index.cfm?ty=nvat.
SOURCES
A Ralph A. Weisheit and Joseph F. Donnermeyer, “Change and Continuity in
Crime in Rural America,” Criminal Justice vol. 1 (2000)
B Bureau of Justice Statistics, National Crime Victimization Survey, Concate-
nated File, 1995 - 2015, (U.S. Department of Justice)
C GLSEN, “2013 National School Climate Survey: The Experiences of LGBT
Youth in Our Nation’s Schools,” (2014), www.glsen.org/sites/default/
les/2013%20National%20School%20Climate%20Survey%20Full%20
Report_0.pdf
CURRENT DATA ON URBAN AND RURAL VICTIMIZATION
Men
7.0
Women
3.8
12
4.6
Urban Rural
10.12
50%
12–14
15–17
4
25–34
65+
18–20
4
21–24
35–49
50–64
9
40
18
39
9
25
11
25
19
35
20
26
16
11
Urban Rural
7
11
