
The University of the State of New York
REGENTS HIGH SCHOOL EXAMINATION
ALGEBRA II
Wednesday, January 24, 2018 — 1:15 to 4:15 p.m., only
MODEL RESPONSE SET
Table of Contents
Question 25. . . . . . . . . . . . . . . . . . 2
Question 26. . . . . . . . . . . . . . . . . . 8
Question 27. . . . . . . . . . . . . . . . . 14
Question 28. . . . . . . . . . . . . . . . . 17
Question 29. . . . . . . . . . . . . . . . . 22
Question 30. . . . . . . . . . . . . . . . . 26
Question 31. . . . . . . . . . . . . . . . . 31
Question 32. . . . . . . . . . . . . . . . . 36
Question 33. . . . . . . . . . . . . . . . . 40
Question 34. . . . . . . . . . . . . . . . . 47
Question 35. . . . . . . . . . . . . . . . . 52
Question 36. . . . . . . . . . . . . . . . . 59
Question 37. . . . . . . . . . . . . . . . . 68

Algebra II – Jan. ’18 [2]
Question 25
25 Elizabeth tried to find the product of (2 ⫹ 4i) and (3 ⫺ i), and her work is shown below.
(2 ⫹ 4i)(3 ⫺ i)
⫽ 6 ⫺ 2i ⫹ 12i ⫺ 4i
2
⫽ 6 ⫹ 10i ⫺ 4i
2
⫽ 6 ⫹ 10i ⫺ 4(1)
⫽ 6 ⫹ 10i ⫺ 4
⫽ 2 ⫹ 10i
Identify the error in the process shown and determine the correct product of (2 ⫹ 4i) and (3 ⫺ i).
Score 2: The student gave a complete and correct response.

Algebra II – Jan. ’18 [3]
Question 25
25 Elizabeth tried to find the product of (2 ⫹ 4i) and (3 ⫺ i), and her work is shown below.
(2 ⫹ 4i)(3 ⫺ i)
⫽ 6 ⫺ 2i ⫹ 12i ⫺ 4i
2
⫽ 6 ⫹ 10i ⫺ 4i
2
⫽ 6 ⫹ 10i ⫺ 4(1)
⫽ 6 ⫹ 10i ⫺ 4
⫽ 2 ⫹ 10i
Identify the error in the process shown and determine the correct product of (2 ⫹ 4i) and (3 ⫺ i).
Score 2: The student gave a complete and correct response.

Algebra II – Jan. ’18 [4]
Question 25
25 Elizabeth tried to find the product of (2 ⫹ 4i) and (3 ⫺ i), and her work is shown below.
(2 ⫹ 4i)(3 ⫺ i)
⫽ 6 ⫺ 2i ⫹ 12i ⫺ 4i
2
⫽ 6 ⫹ 10i ⫺ 4i
2
⫽ 6 ⫹ 10i ⫺ 4(1)
⫽ 6 ⫹ 10i ⫺ 4
⫽ 2 ⫹ 10i
Identify the error in the process shown and determine the correct product of (2 ⫹ 4i) and (3 ⫺ i).
Score 2: The student gave a complete and correct response.

Algebra II – Jan. ’18 [5]
Question 25
25 Elizabeth tried to find the product of (2 ⫹ 4i) and (3 ⫺ i), and her work is shown below.
(2 ⫹ 4i)(3 ⫺ i)
⫽ 6 ⫺ 2i ⫹ 12i ⫺ 4i
2
⫽ 6 ⫹ 10i ⫺ 4i
2
⫽ 6 ⫹ 10i ⫺ 4(1)
⫽ 6 ⫹ 10i ⫺ 4
⫽ 2 ⫹ 10i
Identify the error in the process shown and determine the correct product of (2 ⫹ 4i) and (3 ⫺ i).
Score 1: The student made an error by dividing the complex number by 10.

Algebra II – Jan. ’18 [6]
Question 25
25 Elizabeth tried to find the product of (2 ⫹ 4i) and (3 ⫺ i), and her work is shown below.
(2 ⫹ 4i)(3 ⫺ i)
⫽ 6 ⫺ 2i ⫹ 12i ⫺ 4i
2
⫽ 6 ⫹ 10i ⫺ 4i
2
⫽ 6 ⫹ 10i ⫺ 4(1)
⫽ 6 ⫹ 10i ⫺ 4
⫽ 2 ⫹ 10i
Identify the error in the process shown and determine the correct product of (2 ⫹ 4i) and (3 ⫺ i).
Score 1: The student used 0 for i
2
.

Algebra II – Jan. ’18 [7]
Question 25
25 Elizabeth tried to find the product of (2 ⫹ 4i) and (3 ⫺ i), and her work is shown below.
(2 ⫹ 4i)(3 ⫺ i)
⫽ 6 ⫺ 2i ⫹ 12i ⫺ 4i
2
⫽ 6 ⫹ 10i ⫺ 4i
2
⫽ 6 ⫹ 10i ⫺ 4(1)
⫽ 6 ⫹ 10i ⫺ 4
⫽ 2 ⫹ 10i
Identify the error in the process shown and determine the correct product of (2 ⫹ 4i) and (3 ⫺ i).
Score 0: The student did not identify the error or value of i
2
, and did not determine the correct
product.

Algebra II – Jan. ’18 [8]
Question 26
26 A runner is using a nine-week training app to prepare for a “fun run”. The table below represents
the amount of the program completed, A, and the distance covered in a session, D, in miles.
Based on these data, write an exponential regression equation, rounded to the nearest thousandth,
to model the distance the runner is able to complete in a session as she continues through the
nine-week program.
A
4
__
9
5
__
9
6
__
9
8
__
9
1
D 2 2 2.25 3 3.25
Score 2: The student gave a complete and correct response.

Algebra II – Jan. ’18 [9]
Question 26
Based on these data, write an exponential regression equation, rounded to the nearest thousandth,
to model the distance the runner is able to complete in a session as she continues through the
nine-week program.
Score 2: The student gave a complete and correct response. The variables x and y are accepted
as the regression equation was not restricted in terms of A and D.
26 A runner is using a nine-week training app to prepare for a “fun run”. The table below represents
the amount of the program completed, A, and the distance covered in a session, D, in miles.
A
4
__
9
5
__
9
6
__
9
8
__
9
1
D 2 2 2.25 3 3.25

Algebra II – Jan. ’18 [10]
Question 26
26 A runner is using a nine-week training app to prepare for a “fun run”. The table below represents
the amount of the program completed, A, and the distance covered in a session, D, in miles.
Based on these data, write an exponential regression equation, rounded to the nearest thousandth,
to model the distance the runner is able to complete in a session as she continues through the
nine-week program.
A
4
__
9
5
__
9
6
__
9
8
__
9
1
D 2 2 2.25 3 3.25
Score 1: The student did not round correctly.

Algebra II – Jan. ’18 [11]
Question 26
26 A runner is using a nine-week training app to prepare for a “fun run”. The table below represents
the amount of the program completed, A, and the distance covered in a session, D, in miles.
Based on these data, write an exponential regression equation, rounded to the nearest thousandth,
to model the distance the runner is able to complete in a session as she continues through the
nine-week program.
A
4
__
9
5
__
9
6
__
9
8
__
9
1
D 2 2 2.25 3 3.25
Score 1: The student wrote an expression, not an equation.

Algebra II – Jan. ’18 [12]
Question 26
26 A runner is using a nine-week training app to prepare for a “fun run”. The table below represents
the amount of the program completed, A, and the distance covered in a session, D, in miles.
Based on these data, write an exponential regression equation, rounded to the nearest thousandth,
to model the distance the runner is able to complete in a session as she continues through the
nine-week program.
A
4
__
9
5
__
9
6
__
9
8
__
9
1
D 2 2 2.25 3 3.25
Score 1: The student used an incorrect regression model, but rounded correctly.

Algebra II – Jan. ’18 [13]
Question 26
26 A runner is using a nine-week training app to prepare for a “fun run”. The table below represents
the amount of the program completed, A, and the distance covered in a session, D, in miles.
Based on these data, write an exponential regression equation, rounded to the nearest thousandth,
to model the distance the runner is able to complete in a session as she continues through the
nine-week program.
A
4
__
9
5
__
9
6
__
9
8
__
9
1
D 2 2 2.25 3 3.25
Score 0: The student gave a completely incorrect response.

Algebra II – Jan. ’18 [14]
Question 27
27 A formula for work problems involving two people is shown below.
1
__
t
1
⫹
1
__
t
2
⫽
1
__
t
b
t
1
⫽ the time taken by the first person to complete the job
t
2
⫽ the time taken by the second person to complete the job
t
b
⫽ the time it takes for them working together to complete the job
Fred and Barney are carpenters who build the same model desk. It takes Fred eight hours to build
the desk while it only takes Barney six hours. Write an equation that can be used to find the time
it would take both carpenters working together to build a desk.
Score 2: The student gave a complete and correct response.
Determine, to the nearest tenth of an hour, how long it would take Fred and Barney working
together to build a desk.

Algebra II – Jan. ’18 [15]
Question 27
27 A formula for work problems involving two people is shown below.
1
__
t
1
⫹
1
__
t
2
⫽
1
__
t
b
t
1
⫽ the time taken by the first person to complete the job
t
2
⫽ the time taken by the second person to complete the job
t
b
⫽ the time it takes for them working together to complete the job
Fred and Barney are carpenters who build the same model desk. It takes Fred eight hours to build
the desk while it only takes Barney six hours. Write an equation that can be used to find the time
it would take both carpenters working together to build a desk.
Score 1: The student only stated a correct equation.
Determine, to the nearest tenth of an hour, how long it would take Fred and Barney working
together to build a desk.

Algebra II – Jan. ’18 [16]
Question 27
27 A formula for work problems involving two people is shown below.
1
__
t
1
⫹
1
__
t
2
⫽
1
__
t
b
t
1
⫽ the time taken by the first person to complete the job
t
2
⫽ the time taken by the second person to complete the job
t
b
⫽ the time it takes for them working together to complete the job
Fred and Barney are carpenters who build the same model desk. It takes Fred eight hours to build
the desk while it only takes Barney six hours. Write an equation that can be used to find the time
it would take both carpenters working together to build a desk.
Score 0: The student did not write a correct equation to solve for t
b
and showed no further
correct work.
Determine, to the nearest tenth of an hour, how long it would take Fred and Barney working
together to build a desk.

Algebra II – Jan. ’18 [17]
Question 28
28 Completely factor the following expression:
x
2
⫹ 3xy ⫹ 3x
3
⫹ y
Score 2: The student gave a complete and correct response.

Algebra II – Jan. ’18 [18]
Question 28
28 Completely factor the following expression:
x
2
⫹ 3xy ⫹ 3x
3
⫹ y
Score 1: The student did not put parentheses around x
2
⫹ y.

Algebra II – Jan. ’18 [19]
Question 28
28 Completely factor the following expression:
x
2
⫹ 3xy ⫹ 3x
3
⫹ y
Score 1: The student did not completely factor the expression.

Algebra II – Jan. ’18 [20]
Question 28
28 Completely factor the following expression:
x
2
⫹ 3xy ⫹ 3x
3
⫹ y
Score 1: The student did not recognize 3x ⫹ 1 as the GCF.

Algebra II – Jan. ’18 [21]
Question 28
28 Completely factor the following expression:
x
2
⫹ 3xy ⫹ 3x
3
⫹ y
Score 0: The student did not show enough correct work to receive any credit.

Algebra II – Jan. ’18 [22]
Question 29
29 Researchers in a local area found that the population of rabbits with an initial population of
20 grew continuously at the rate of 5% per month. The fox population had an initial value of 30
and grew continuously at the rate of 3% per month.
Find, to the nearest tenth of a month, how long it takes for these populations to be equal.
Score 2: The student gave a complete and correct response.

Algebra II – Jan. ’18 [23]
Question 29
29 Researchers in a local area found that the population of rabbits with an initial population of
20 grew continuously at the rate of 5% per month. The fox population had an initial value of 30
and grew continuously at the rate of 3% per month.
Find, to the nearest tenth of a month, how long it takes for these populations to be equal.
Score 2: The student gave a complete and correct response.

Algebra II – Jan. ’18 [24]
Question 29
29 Researchers in a local area found that the population of rabbits with an initial population of
20 grew continuously at the rate of 5% per month. The fox population had an initial value of 30
and grew continuously at the rate of 3% per month.
Find, to the nearest tenth of a month, how long it takes for these populations to be equal.
Score 1: The student used incorrect rates, but rounded correctly.

Algebra II – Jan. ’18 [25]
Question 29
29 Researchers in a local area found that the population of rabbits with an initial population of
20 grew continuously at the rate of 5% per month. The fox population had an initial value of 30
and grew continuously at the rate of 3% per month.
Find, to the nearest tenth of a month, how long it takes for these populations to be equal.
Score 0: The student made several errors.

Algebra II – Jan. ’18 [26]
Question 30
30 Consider the function h(x) ⫽ 2sin(3x) ⫹ 1 and the function q represented in the table below.
Determine which function has the smaller minimum value for the domain [⫺2,2]. Justify your
answer.
x q
(
x
)
–2 –8
–1 0
0 0
1 –2
2 0
Score 2: The student gave a complete and correct response.

Algebra II – Jan. ’18 [27]
Question 30
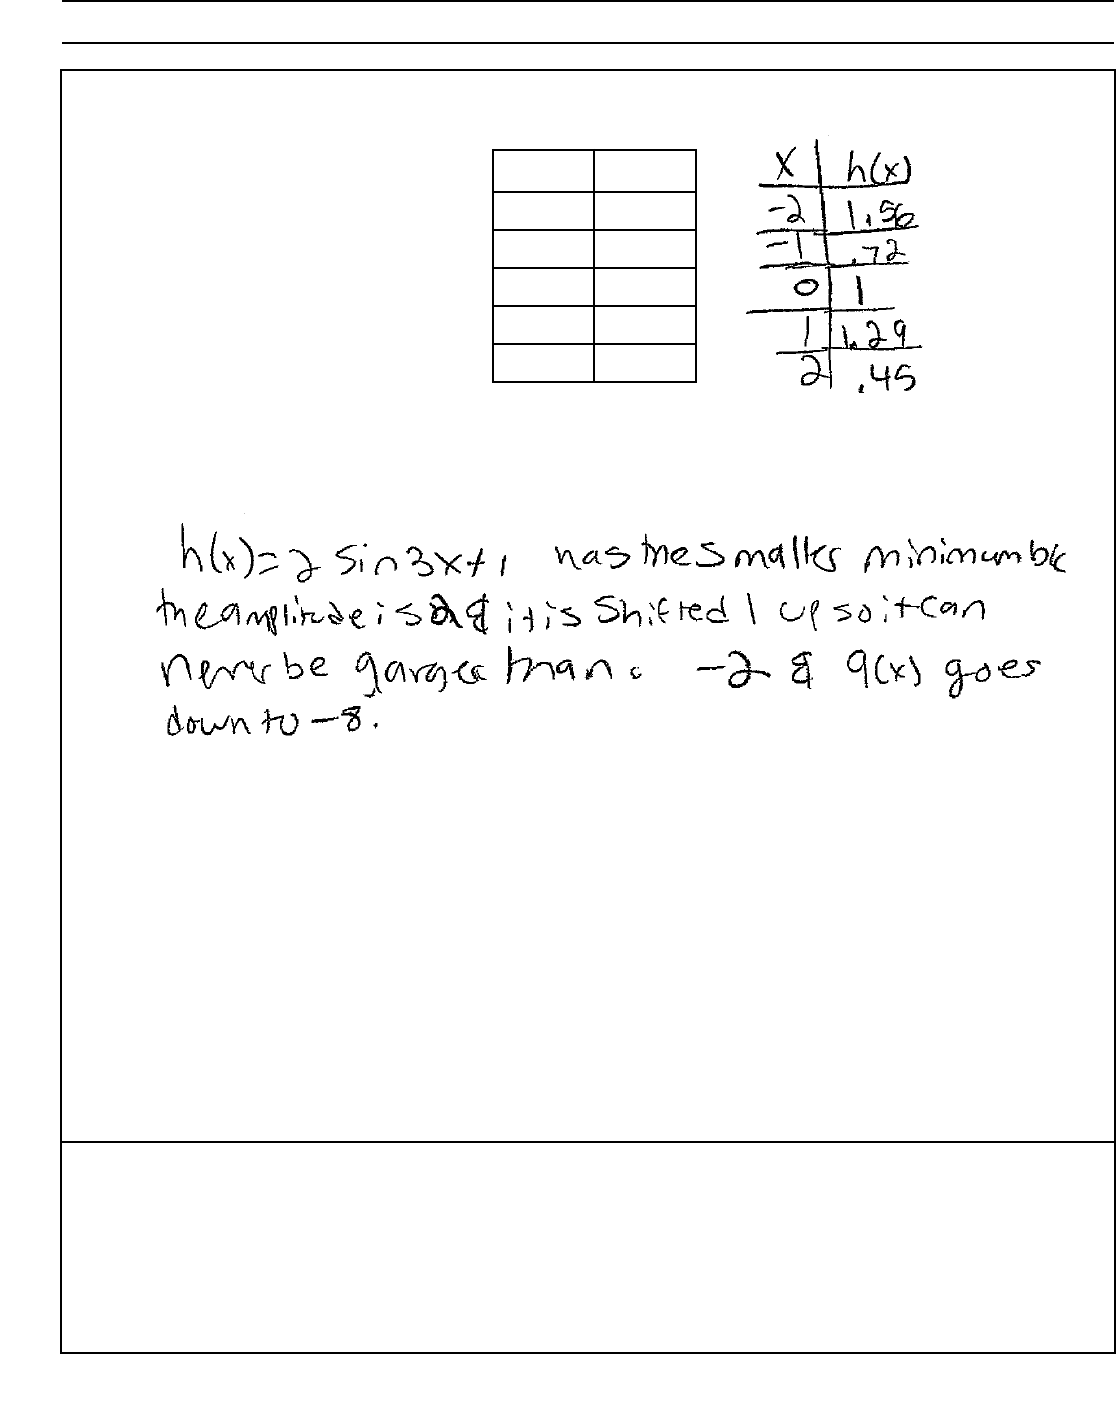
30 Consider the function h(x) ⫽ 2sin(3x) ⫹ 1 and the function q represented in the table below.
Determine which function has the smaller minimum value for the domain [⫺2,2]. Justify your
answer.
x q
(
x
)
–2 –8
–1 0
0 0
1 –2
2 0
Score 1: The student incorrectly identified the minimum of h.

Algebra II – Jan. ’18 [28]
Question 30
30 Consider the function h(x) ⫽ 2sin(3x) ⫹ 1 and the function q represented in the table below.
Determine which function has the smaller minimum value for the domain [⫺2,2]. Justify your
answer.
x q
(
x
)
–2 –8
–1 0
0 0
1 –2
2 0
Score 1: The student gave an incomplete justification.

Algebra II – Jan. ’18 [29]
Question 30
30 Consider the function h(x) ⫽ 2sin(3x) ⫹ 1 and the function q represented in the table below.
Determine which function has the smaller minimum value for the domain [⫺2,2]. Justify your
answer.
x q
(
x
)
–2 –8
–1 0
0 0
1 –2
2 0
Score 1: The student made an error by using the wrong mode.
Algebra II – Jan. ’18 [30]
Question 30
30 Consider the function h(x) ⫽ 2sin(3x) ⫹ 1 and the function q represented in the table below.
Determine which function has the smaller minimum value for the domain [⫺2,2]. Justify your
answer.
x q
(
x
)
–2 –8
–1 0
0 0
1 –2
2 0
Score 0: The student did not show enough correct work to receive any credit.

Algebra II – Jan. ’18 [31]
Question 31
31 The zeros of a quartic polynomial function h are ⫺1, ⫾2, and 3.
Sketch a graph of y ⫽ h(x) on the grid below.
Score 2: The student gave a complete and correct response.

Algebra II – Jan. ’18 [32]
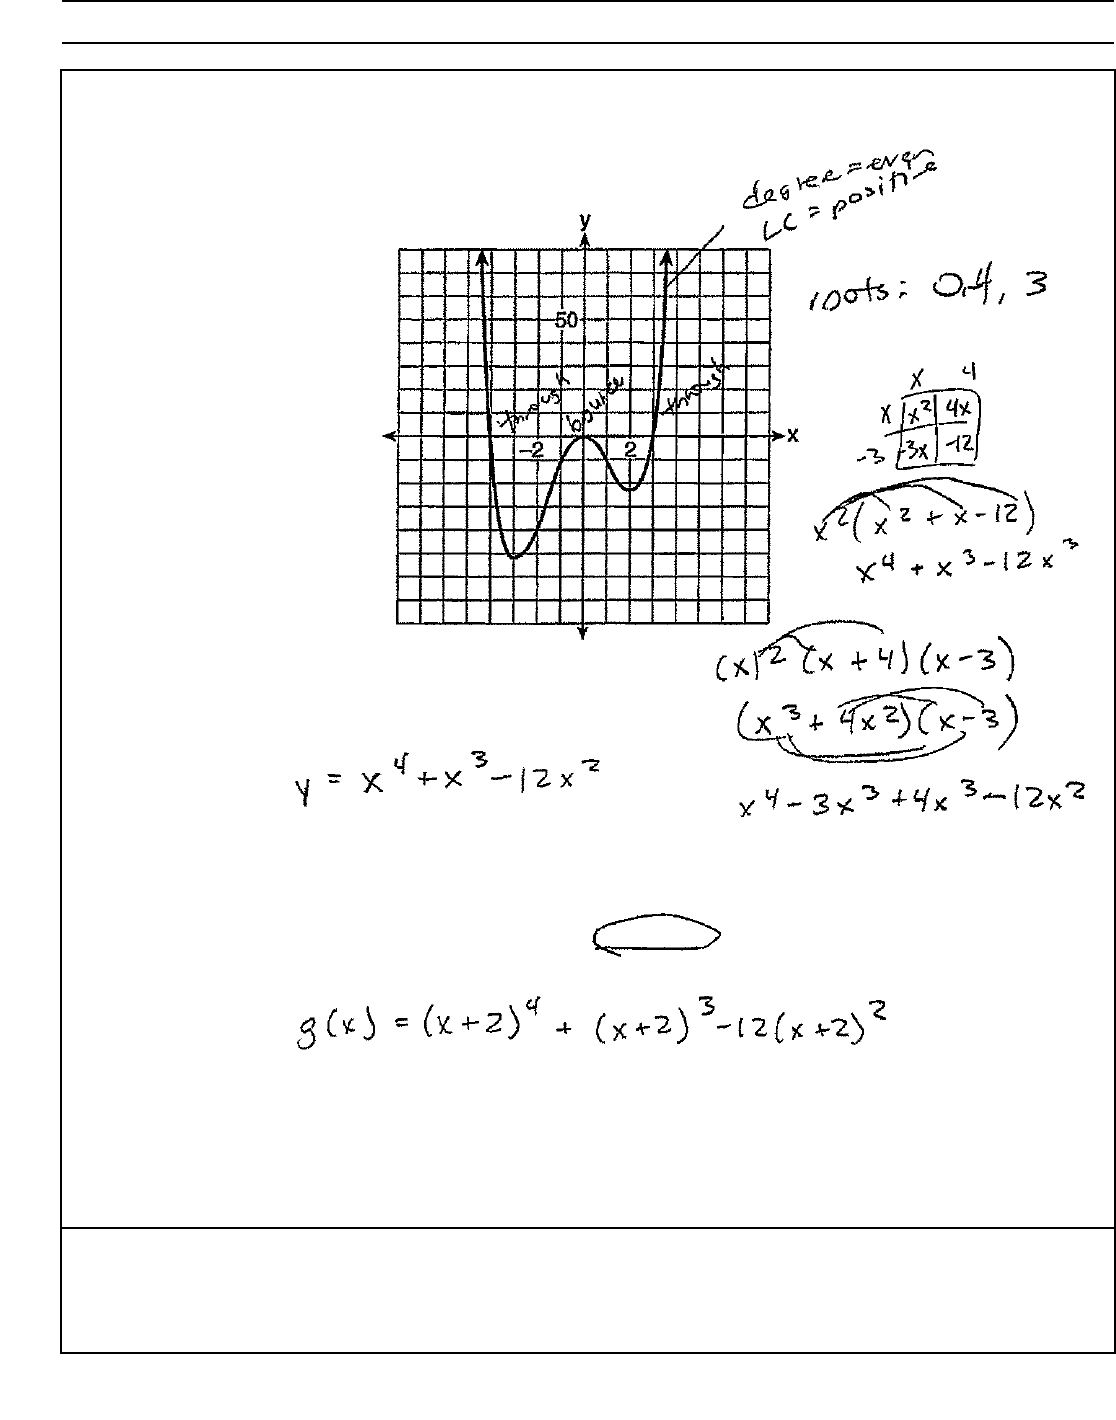
Question 31
31 The zeros of a quartic polynomial function h are ⫺1, ⫾2, and 3.
Sketch a graph of y ⫽ h(x) on the grid below.
Score 2: The student gave a complete and correct response.

Algebra II – Jan. ’18 [33]
Question 31
31 The zeros of a quartic polynomial function h are ⫺1, ⫾2, and 3.
Sketch a graph of y ⫽ h(x) on the grid below.
Score 1: The student made one graphing error.

Algebra II – Jan. ’18 [34]
Question 31
31 The zeros of a quartic polynomial function h are ⫺1, ⫾2, and 3.
Sketch a graph of y ⫽ h(x) on the grid below.
Score 1: The student incorrectly interpreted the zeros.

Algebra II – Jan. ’18 [35]
Question 31
31 The zeros of a quartic polynomial function h are ⫺1, ⫾2, and 3.
Sketch a graph of y ⫽ h(x) on the grid below.
Score 0: The student gave a completely incorrect response.

Algebra II – Jan. ’18 [36]
Question 32
32 Explain why 81
3
__
4
equals 27.
Score 2: The student gave a complete and correct response.

Algebra II – Jan. ’18 [37]
Question 32
32 Explain why 81
3
__
4
equals 27.
Score 1: The student gave an imcomplete explanation because no reference was made to 27.

Algebra II – Jan. ’18 [38]
Question 32
32 Explain why 81
3
__
4
equals 27.
Score 1: The student gave a justification and did not write an explanation.

Algebra II – Jan. ’18 [39]
Question 32
32 Explain why 81
3
__
4
equals 27.
Score 0: The student gave completely incorrect response.

Algebra II – Jan. ’18 [40]
Question 33
33 Given: f(x) ⫽ 2x
2
⫹ x ⫺ 3 and g(x) ⫽ x ⫺ 1
Express f(x) • g(x) ⫺
[
f(x) ⫹ g(x)
]
as a polynomial in standard form.
Score 4: The student gave a complete and correct response.

Algebra II – Jan. ’18 [41]
Question 33
33 Given: f(x) ⫽ 2x
2
⫹ x ⫺ 3 and g(x) ⫽ x ⫺ 1
Express f(x) • g(x) ⫺
[
f(x) ⫹ g(x)
]
as a polynomial in standard form.
Score 3: The student made a transcription error copying the sum.

Algebra II – Jan. ’18 [42]
Question 33
33 Given: f(x) ⫽ 2x
2
⫹ x ⫺ 3 and g(x) ⫽ x ⫺ 1
Express f(x) • g(x) ⫺
[
f(x) ⫹ g(x)
]
as a polynomial in standard form.
Score 3: The student correctly found the product and sum, but subtracted incorrectly.

Algebra II – Jan. ’18 [43]
Question 33
33 Given: f(x) ⫽ 2x
2
⫹ x ⫺ 3 and g(x) ⫽ x ⫺ 1
Express f(x) • g(x) ⫺
[
f(x) ⫹ g(x)
]
as a polynomial in standard form.
Score 2: The student found the correct sum only.

Algebra II – Jan. ’18 [44]
Question 33
33 Given: f(x) ⫽ 2x
2
⫹ x ⫺ 3 and g(x) ⫽ x ⫺ 1
Express f(x) • g(x) ⫺
[
f(x) ⫹ g(x)
]
as a polynomial in standard form.
Score 2: The student made a conceptual error by performing a composition.

Algebra II – Jan. ’18 [45]
Question 33
33 Given: f(x) ⫽ 2x
2
⫹ x ⫺ 3 and g(x) ⫽ x ⫺ 1
Express f(x) • g(x) ⫺
[
f(x) ⫹ g(x)
]
as a polynomial in standard form.
Score 1: The student made an error computing the sum.

Algebra II – Jan. ’18 [46]
Question 33
33 Given: f(x) ⫽ 2x
2
⫹ x ⫺ 3 and g(x) ⫽ x ⫺ 1
Express f(x) • g(x) ⫺
[
f(x) ⫹ g(x)
]
as a polynomial in standard form.
Score 0: The student did not show enough correct work to receive any credit.

Algebra II – Jan. ’18 [47]
Question 34
Are the events “the student is a junior” and “the student’s favorite subject is Math” independent
of each other? Explain your answer.
Score 4: The student gave a complete and correct response.
34 A student is chosen at random from the student body at a given high school. The probability that
the student selects Math as the favorite subject is
1
__
4
. The probability that the student chosen is
a junior is
116
___
459
. If the probability that the student selected is a junior or that the student chooses
Math as the favorite subject is
47
___
108
, what is the exact probability that the student selected is a
junior whose favorite subject is Math?

Algebra II – Jan. ’18 [48]
Question 34
Are the events “the student is a junior” and “the student’s favorite subject is Math” independent
of each other? Explain your answer.
Score 3: The student did not provide an explanation.
34 A student is chosen at random from the student body at a given high school. The probability that
the student selects Math as the favorite subject is
1
__
4
. The probability that the student chosen is
a junior is
116
___
459
. If the probability that the student selected is a junior or that the student chooses
Math as the favorite subject is
47
___
108
, what is the exact probability that the student selected is a
junior whose favorite subject is Math?

Algebra II – Jan. ’18 [49]
Question 34
Are the events “the student is a junior” and “the student’s favorite subject is Math” independent
of each other? Explain your answer.
Score 2: The student did not find the exact probability and did not provide an explanation.
34 A student is chosen at random from the student body at a given high school. The probability that
the student selects Math as the favorite subject is
1
__
4
. The probability that the student chosen is
a junior is
116
___
459
. If the probability that the student selected is a junior or that the student chooses
Math as the favorite subject is
47
___
108
, what is the exact probability that the student selected is a
junior whose favorite subject is Math?

Algebra II – Jan. ’18 [50]
Question 34
Are the events “the student is a junior” and “the student’s favorite subject is Math” independent
of each other? Explain your answer.
Score 1: The student made one transcription error and did not write an explanation.
34 A student is chosen at random from the student body at a given high school. The probability that
the student selects Math as the favorite subject is
1
__
4
. The probability that the student chosen is
a junior is
116
___
459
. If the probability that the student selected is a junior or that the student chooses
Math as the favorite subject is
47
___
108
, what is the exact probability that the student selected is a
junior whose favorite subject is Math?

Algebra II – Jan. ’18 [51]
Question 34
Are the events “the student is a junior” and “the student’s favorite subject is Math” independent
of each other? Explain your answer.
Score 0: The student did not show enough correct work to receive any credit.
34 A student is chosen at random from the student body at a given high school. The probability that
the student selects Math as the favorite subject is
1
__
4
. The probability that the student chosen is
a junior is
116
___
459
. If the probability that the student selected is a junior or that the student chooses
Math as the favorite subject is
47
___
108
, what is the exact probability that the student selected is a
junior whose favorite subject is Math?

Algebra II – Jan. ’18 [52]
Question 35
b) A study claims “50 percent of men 21 and older in the United States are married.” Do your
results from part a contradict this claim? Explain.
Score 4: The student gave a complete and correct response.
114 120 126 132 138 144 150 156 162
0
6
12
18
Mean = 138.905
SD = 7.950
Number of Married Men
Frequency
35 In a random sample of 250 men in the United States, age 21 or older, 139 are married. The graph
below simulated samples of 250 men, 200 times, assuming that 139 of the men are married.
a) Based on the simulation, create an interval in which the middle 95% of the number of
married men may fall. Round your answer to the nearest integer.

Algebra II – Jan. ’18 [53]
Question 35
b) A study claims “50 percent of men 21 and older in the United States are married.” Do your
results from part a contradict this claim? Explain.
Score 4: The student gave a complete and correct response.
114 120 126 132 138 144 150 156 162
0
6
12
18
Mean = 138.905
SD = 7.950
Number of Married Men
Frequency
35 In a random sample of 250 men in the United States, age 21 or older, 139 are married. The graph
below simulated samples of 250 men, 200 times, assuming that 139 of the men are married.
a) Based on the simulation, create an interval in which the middle 95% of the number of
married men may fall. Round your answer to the nearest integer.

Algebra II – Jan. ’18 [54]
Question 35
b) A study claims “50 percent of men 21 and older in the United States are married.” Do your
results from part a contradict this claim? Explain.
Score 3: The student made a rounding error creating the interval.
114 120 126 132 138 144 150 156 162
0
6
12
18
Mean = 138.905
SD = 7.950
Number of Married Men
Frequency
35 In a random sample of 250 men in the United States, age 21 or older, 139 are married. The graph
below simulated samples of 250 men, 200 times, assuming that 139 of the men are married.
a) Based on the simulation, create an interval in which the middle 95% of the number of
married men may fall. Round your answer to the nearest integer.

Algebra II – Jan. ’18 [55]
Question 35
b) A study claims “50 percent of men 21 and older in the United States are married.” Do your
results from part a contradict this claim? Explain.
Score 2: The student stated an incorrect interval, but gave a complete explanation based on the
interval.
114 120 126 132 138 144 150 156 162
0
6
12
18
Mean = 138.905
SD = 7.950
Number of Married Men
Frequency
35 In a random sample of 250 men in the United States, age 21 or older, 139 are married. The graph
below simulated samples of 250 men, 200 times, assuming that 139 of the men are married.
a) Based on the simulation, create an interval in which the middle 95% of the number of
married men may fall. Round your answer to the nearest integer.

Algebra II – Jan. ’18 [56]
Question 35
b) A study claims “50 percent of men 21 and older in the United States are married.” Do your
results from part a contradict this claim? Explain.
Score 2: The student only received credit for the correct interval.
114 120 126 132 138 144 150 156 162
0
6
12
18
Mean = 138.905
SD = 7.950
Number of Married Men
Frequency
35 In a random sample of 250 men in the United States, age 21 or older, 139 are married. The graph
below simulated samples of 250 men, 200 times, assuming that 139 of the men are married.
a) Based on the simulation, create an interval in which the middle 95% of the number of
married men may fall. Round your answer to the nearest integer.

Algebra II – Jan. ’18 [57]
Question 35
b) A study claims “50 percent of men 21 and older in the United States are married.” Do your
results from part a contradict this claim? Explain.
Score 1: The student made a rounding error creating the interval and did not provide an
explanation.
114 120 126 132 138 144 150 156 162
0
6
12
18
Mean = 138.905
SD = 7.950
Number of Married Men
Frequency
35 In a random sample of 250 men in the United States, age 21 or older, 139 are married. The graph
below simulated samples of 250 men, 200 times, assuming that 139 of the men are married.
a) Based on the simulation, create an interval in which the middle 95% of the number of
married men may fall. Round your answer to the nearest integer.

Algebra II – Jan. ’18 [58]
Question 35
b) A study claims “50 percent of men 21 and older in the United States are married.” Do your
results from part a contradict this claim? Explain.
Score 0: The student did not show any correct work.
114 120 126 132 138 144 150 156 162
0
6
12
18
Mean = 138.905
SD = 7.950
Number of Married Men
Frequency
35 In a random sample of 250 men in the United States, age 21 or older, 139 are married. The graph
below simulated samples of 250 men, 200 times, assuming that 139 of the men are married.
a) Based on the simulation, create an interval in which the middle 95% of the number of
married men may fall. Round your answer to the nearest integer.

Algebra II – Jan. ’18 [59]
Question 36
Score 4: The student gave a complete and correct response.
36 The graph of y ⫽ f(x) is shown below. The function has a leading coefficient of 1.
Write an equation for f(x).
50
–2 2
y
x
The function g is formed by translating function f left 2 units. Write an equation for g(x).
Algebra II – Jan. ’18 [60]
Question 36
Score 4: The student gave a complete and correct response.
36 The graph of y ⫽ f(x) is shown below. The function has a leading coefficient of 1.
The function g is formed by translating function f left 2 units. Write an equation for g(x).
Write an equation for f(x).

Algebra II – Jan. ’18 [61]
Question 36
Score 3: The student made a notation error by mislabeling g(x).
36 The graph of y ⫽ f(x) is shown below. The function has a leading coefficient of 1.
Write an equation for f(x).
50
–2 2
y
x
The function g is formed by translating function f left 2 units. Write an equation for g(x).

Algebra II – Jan. ’18 [62]
Question 36
Score 3: The student used x ⫺ 4 instead of x ⫺ 3.
36 The graph of y ⫽ f(x) is shown below. The function has a leading coefficient of 1.
Write an equation for f(x).
50
–2 2
y
x
The function g is formed by translating function f left 2 units. Write an equation for g(x).

Algebra II – Jan. ’18 [63]
Question 36
Score 2: The student made two errors writing the equation for f(x).
36 The graph of y ⫽ f(x) is shown below. The function has a leading coefficient of 1.
Write an equation for f(x).
50
–2 2
y
x
The function g is formed by translating function f left 2 units. Write an equation for g(x).

Algebra II – Jan. ’18 [64]
Question 36
Score 2: The student made a conceptual error not realizing x ⫽ 0 was a double root.
36 The graph of y ⫽ f(x) is shown below. The function has a leading coefficient of 1.
Write an equation for f(x).
50
–2 2
y
x
The function g is formed by translating function f left 2 units. Write an equation for g(x).

Algebra II – Jan. ’18 [65]
Question 36
Score 1: The student only received credit for g(x).
36 The graph of y ⫽ f(x) is shown below. The function has a leading coefficient of 1.
Write an equation for f(x).
50
–2 2
y
x
The function g is formed by translating function f left 2 units. Write an equation for g(x).

Algebra II – Jan. ’18 [66]
Question 36
Score 1: The student made a conceptual error not realizing x ⫽ 0 was a double root and
incorrectly determined g(x).
50
–2 2
y
x
The function g is formed by translating function f left 2 units. Write an equation for g(x).
36 The graph of y ⫽ f(x) is shown below.
T
Write an equation for f(x).

Algebra II – Jan. ’18 [67]
Question 36
Score 0: The student did not show enough correct work to receive any credit.
36 The graph of y ⫽ f(x) is shown below. The function has a leading coefficient of 1.
Write an equation for f(x).
50
–2 2
y
x
The function g is formed by translating function f left 2 units. Write an equation for g(x).

Algebra II – Jan. ’18 [68]
Question 37
37 The resting blood pressure of an adult patient can be modeled by the function P below, where
P(t) is the pressure in millimeters of mercury after time t in seconds.
P(t) ⫽ 24cos(3πt) ⫹ 120
On the set of axes below, graph y ⫽ P(t) over the domain 0
≤
t
≤
2.
Score 6: The student gave a complete and correct response.

Algebra II – Jan. ’18 [69]
Question 37 continued.
Determine the period of P. Explain what this value represents in the given context.
Normal resting blood pressure for an adult is 120 over 80. This means that the blood pressure
oscillates between a maximum of 120 and a minimum of 80. Adults with high blood pressure
(above 140 over 90) and adults with low blood pressure (below 90 over 60) may be at risk for
health disorders. Classify the given patient’s blood pressure as low, normal, or high and explain
your reasoning.

Algebra II – Jan. ’18 [70]
Question 37
37 The resting blood pressure of an adult patient can be modeled by the function P below, where
P(t) is the pressure in millimeters of mercury after time t in seconds.
P(t) ⫽ 24cos(3πt) ⫹ 120
On the set of axes below, graph y ⫽ P(t) over the domain 0
≤
t
≤
2.
Score 5: The student provided an incomplete explanation of period in the given contest.

Algebra II – Jan. ’18 [71]
Question 37 continued.
Determine the period of P. Explain what this value represents in the given context.
Normal resting blood pressure for an adult is 120 over 80. This means that the blood pressure
oscillates between a maximum of 120 and a minimum of 80. Adults with high blood pressure
(above 140 over 90) and adults with low blood pressure (below 90 over 60) may be at risk for
health disorders. Classify the given patient’s blood pressure as low, normal, or high and explain
your reasoning.

Algebra II – Jan. ’18 [72]
Question 37
37 The resting blood pressure of an adult patient can be modeled by the function P below, where
P(t) is the pressure in millimeters of mercury after time t in seconds.
P(t) ⫽ 24cos(3πt) ⫹ 120
On the set of axes below, graph y ⫽ P(t) over the domain 0
≤
t
≤
2.
Score 4: The student made an error graphing the range and incorrectly interpreted the graph.

Algebra II – Jan. ’18 [73]
Question 37 continued.
Determine the period of P. Explain what this value represents in the given context.
Normal resting blood pressure for an adult is 120 over 80. This means that the blood pressure
oscillates between a maximum of 120 and a minimum of 80. Adults with high blood pressure
(above 140 over 90) and adults with low blood pressure (below 90 over 60) may be at risk for
health disorders. Classify the given patient’s blood pressure as low, normal, or high and explain
your reasoning.

Algebra II – Jan. ’18 [74]
Question 37
37 The resting blood pressure of an adult patient can be modeled by the function P below, where
P(t) is the pressure in millimeters of mercury after time t in seconds.
P(t) ⫽ 24cos(3πt) ⫹ 120
On the set of axes below, graph y ⫽ P(t) over the domain 0
≤
t
≤
2.
Score 3: The student correctly identified the period and, based on the graph, correctly classified
and explained the patient’s blood pressure.

Algebra II – Jan. ’18 [75]
Question 37 continued.
Determine the period of P. Explain what this value represents in the given context.
Normal resting blood pressure for an adult is 120 over 80. This means that the blood pressure
oscillates between a maximum of 120 and a minimum of 80. Adults with high blood pressure
(above 140 over 90) and adults with low blood pressure (below 90 over 60) may be at risk for
health disorders. Classify the given patient’s blood pressure as low, normal, or high and explain
your reasoning.

Algebra II – Jan. ’18 [76]
Question 37
37 The resting blood pressure of an adult patient can be modeled by the function P below, where
P(t) is the pressure in millimeters of mercury after time t in seconds.
P(t) ⫽ 24cos(3πt) ⫹ 120
On the set of axes below, graph y ⫽ P(t) over the domain 0
≤
t
≤
2.
Score 2: The student received credit for a correct graph only.

Algebra II – Jan. ’18 [77]
Question 37 continued.
Determine the period of P. Explain what this value represents in the given context.
Normal resting blood pressure for an adult is 120 over 80. This means that the blood pressure
oscillates between a maximum of 120 and a minimum of 80. Adults with high blood pressure
(above 140 over 90) and adults with low blood pressure (below 90 over 60) may be at risk for
health disorders. Classify the given patient’s blood pressure as low, normal, or high and explain
your reasoning.

Algebra II – Jan. ’18 [78]
Question 37
37 The resting blood pressure of an adult patient can be modeled by the function P below, where
P(t) is the pressure in millimeters of mercury after time t in seconds.
P(t) ⫽ 24cos(3πt) ⫹ 120
On the set of axes below, graph y ⫽ P(t) over the domain 0
≤
t
≤
2.
Score 2: The student correctly classified and explained the patient’s blood pressure based on the
graph.

Algebra II – Jan. ’18 [79]
Question 37 continued.
Determine the period of P. Explain what this value represents in the given context.
Normal resting blood pressure for an adult is 120 over 80. This means that the blood pressure
oscillates between a maximum of 120 and a minimum of 80. Adults with high blood pressure
(above 140 over 90) and adults with low blood pressure (below 90 over 60) may be at risk for
health disorders. Classify the given patient’s blood pressure as low, normal, or high and explain
your reasoning.

Algebra II – Jan. ’18 [80]
Question 37
37 The resting blood pressure of an adult patient can be modeled by the function P below, where
P(t) is the pressure in millimeters of mercury after time t in seconds.
P(t) ⫽ 24cos(3πt) ⫹ 120
On the set of axes below, graph y ⫽ P(t) over the domain 0
≤
t
≤
2.
Score 1: The student correctly stated the period.

Algebra II – Jan. ’18 [81]
Question 37 continued.
Determine the period of P. Explain what this value represents in the given context.
Normal resting blood pressure for an adult is 120 over 80. This means that the blood pressure
oscillates between a maximum of 120 and a minimum of 80. Adults with high blood pressure
(above 140 over 90) and adults with low blood pressure (below 90 over 60) may be at risk for
health disorders. Classify the given patient’s blood pressure as low, normal, or high and explain
your reasoning.

Algebra II – Jan. ’18 [82]
Question 37
37 The resting blood pressure of an adult patient can be modeled by the function P below, where
P(t) is the pressure in millimeters of mercury after time t in seconds.
P(t) ⫽ 24cos(3πt) ⫹ 120
On the set of axes below, graph y ⫽ P(t) over the domain 0
≤
t
≤
2.
Score 1: The student made one graphing error relating to the period.

Algebra II – Jan. ’18 [83]
Question 37 continued.
Determine the period of P. Explain what this value represents in the given context.
Normal resting blood pressure for an adult is 120 over 80. This means that the blood pressure
oscillates between a maximum of 120 and a minimum of 80. Adults with high blood pressure
(above 140 over 90) and adults with low blood pressure (below 90 over 60) may be at risk for
health disorders. Classify the given patient’s blood pressure as low, normal, or high and explain
your reasoning.

Algebra II – Jan. ’18 [84]
Question 37
37 The resting blood pressure of an adult patient can be modeled by the function P below, where
P(t) is the pressure in millimeters of mercury after time t in seconds.
P(t) ⫽ 24cos(3πt) ⫹ 120
On the set of axes below, graph y ⫽ P(t) over the domain 0
≤
t
≤
2.
Score 0: The student made multiple graphing errors and showed no further work.

Algebra II – Jan. ’18 [85]
Question 37 continued.
Determine the period of P. Explain what this value represents in the given context.
Normal resting blood pressure for an adult is 120 over 80. This means that the blood pressure
oscillates between a maximum of 120 and a minimum of 80. Adults with high blood pressure
(above 140 over 90) and adults with low blood pressure (below 90 over 60) may be at risk for
health disorders. Classify the given patient’s blood pressure as low, normal, or high and explain
your reasoning.
